Abstract
Respondents each evaluated 24 unique combinations of messages (vignettes) pertaining to the choice of a banquet hall, rating each vignette on a Likert scale for likelihood to choose the banquet hall for their next event, and then selecting one of five emotions to show their feeling about the banquet hall as described. The approach, Mind Genomics, revealed the part-worth contribution of each of 36 messages to both choice (question #1) and to feeling/emotion (question #2). Respondents fell into one of three different mind-sets, based upon their patterns of choice, MS1 – Practical aspects of hiring a banquet hall; MS2 – Focus on cost; MS3 – Focus on experience. Membership in the mind-sets did not correlate with any aspects of the respondent as determined by a self-profiling classification. The paper presents a PVI, personal viewpoint identifier, six questions on a 2-point scale, developed by the mind-set segmentation, which assign a new person to one of the three mind-sets.
Introduction
Anthropology and Sociology
The study of everyday events by psychologists, sociologists, anthropologists and even commercially- oriented market researchers, creates a foundation of knowledge about a society. Researchers observe from the outside, often talk to those in the society, and then describe what they see, often in very readable papers and books, occasionally in charts and statistics. Those who observe people in their own environment, talk to them, record these interactions, and perhaps even substantiate some of the information with charts and tables, provide a very readable account of the people as those people go about their daily lives.
The focus of this paper in on a very simple aspect of daily life, specifically hiring a banquet hall. Rather than presenting this topic from the point of view of statistics or economics such as how many halls are rented, whom, for what reasons, and so forth, we approach it from the perspective of the inner, personal aspect, the thinking which may go on in the mind of the prospect who is about to hire the hall.
Banquets and banquet halls present a plethora of interesting aspects to study. Banquets are ceremonial meals. A number of papers present to us the nature of the banquet in ancient times, as well as the role of the banquet and banquet hall today. This paper is not a review of the extensive literature about banquets and banquet halls other than to recognize the rich academic history that the public feasting has enjoyed, whether the academic work focuses on what happened across history [1,2], on the position of banqueting and banquet halls in society [3-5], and even on the nature of banqueting in different cultures [6-8].
There is a practical aspect as well, today’s economy. High-priced banquet activities at wedding receptions have significantly contributed to the growth in the overall profits of the food and beverage (F&B) departments of hotels [9]. Restaurants are, by their very frequency, more important economically than are banquets. Yet, banquets are critical for the hospitality world [10-14]. Almost 70% of the food and beverage revenue of hotels in the U.S. is generated by banquets. Fifty percent of these profits come from weddings in the United States.
When we turn to the topic of ‘banquet’ in the academic literature, searching through Google Scholar we have many more hits, about 51,000, but many of these are relevant to issues of service quality and customer satisfaction on the one hand, and historical aspects of banqueting on the other. Indeed, banqueting as a topic in and of itself is of less interest than banqueting as a social institution, and how it may fit into the complex of daily institutions in one’s culture, whether that culture be current around the world, or part of the daily events of historical times, such as banqueting during the days of the Roman empire, and how the behavior changed with history. There is very little about the topic of ‘banquet halls,’ however.
Despite the paucity of information about banquet halls (not banquets themselves!) in the academic literature, such as the importance of the different reasons for choosing a banquet hall, there are some relevant papers, such as Ling Guan’s master’s thesis in Iowa State University [15] on ‘Push and pull factors in determining the consumer’s motivations for choose wedding banquet venues: A case study in Chongging, China. Guan introduces the notion of two types of factors for the choice of venue; push and pull. four push factors (“seeking relaxation and knowledge”, “fulfilling prestige”, “escaping from daily routine”, and “social networking”) derived from the extracted 10 push items and six pull factors (“budget”, “atmosphere”, “facilities”, “wedding services”, “transportation”, and “service and quality”). Peng & Wang [16] also talk about the wedding banquet as a set of decision with different strategies for decision making.
The alternative to a rigorous academic study of the topic of banquet halls is a study of the commercial banquet hall, how the hall is used, how the hall is chosen, the position of the banquet hall in everyday life. One need only look at the local newspapers of a community, at the websites of business in that community, or just drive around the main streets to get a sense of the nature of the banquet facilities that are offered, how these are presented to the prospective customers. In the same spirit, one can request a market research study about attitudes and practices with regard to banquet halls, or even commission a focus group of banquet hall customers or prospects to discuss their experiences with, and their attitudes towards banquet halls. No doubt such commercially relevant studies have been done, not so much for publication as for business use, to know, for example, how to present one’s banquet hall to customers to increase business.
The Internet is an increasingly popular source of knowledge about daily people, especially because the content of the Internet matches the interests of those who search for information. Popular topics like health have hundreds of millions of sites. When we look for the phrase “banquet halls’ in Google, we end up with approximately 46,000 hits as of July 30, 2020. People also search for the practical aspects of banquet halls such as ‘what are the different types of banquets?, ‘In a banquet hall a good business, what is a banquet hall?’, How do banquet halls charge?’, What happens at a banquet?’, ‘What is a banquet menu?’, and so forth. These are the relevant questions. The websites which address these questions are usually commercial sites, providing an answer to the question, and then offering a particular banquet-related service to the person who is doing the searching.
A good idea of what can be found for in a search for a banquet is the following:
Banquet halls are among the most popular types of venues for events, particularly wedding. The popularity stems from the benefits these halls bring such as stress-free planning for families and couples. These banquet facilities are typically all-inclusive which means a lot of the little details are covered such as catering, seating, decorating and so much more.
https://www.uniquevenues.com/banquet-halls
Applying Mind Genomics to study what appeals to a person asked to choose a banquet facility
Banquets provide a topic which can contribute to the understanding of choice for celebratory events, events that are affordable and which move beyond the everyday dining behavior that one does at a restaurant. Studying the choice of options for a banquet brings into play the recognition of clearly different factors influencing that choice. The different aspects range across topics such as the nature of the information to which people pay attention when choosing a banquet, the influence of the person who is presenting the information, the income of the person giving the banquet, the choice of banquet amenities, and so forth. The reality is that the academic literature on both hospitality and choice, respectively, recognizes the importance of such information, but there is little to be found which treats the options of choice in a banquet hall in a rigorous fashion.
As the 21st century progresses, and with the plethora of available methods to measure and to analyze, what is missing is a deep psychological understanding of the everyday. We can study the economics and sociology of banqueting, either by reading papers in the scientific literature, by immersing oneself in the veritable flood of advertisements in the popular press and Internet, or from going through the verbatims of in-depth interviews with consumers or the mountains of survey results run by market researchers. Yet, unless there is a sharp focus, one will obtain a great deal of ‘data’ but not understand the ‘mind’ of the customer of a banquet hall. The topic is simply too limited for today’s scientist.
What is needed is a fast, inexpensive, knowledge-creating system to understand any topic where judgment is key, where the data are scarce and where the experience is widespread. Mind Genomics is that key. Mind Genomics was borne out of the desire to understand the mind of the person as that person lives life, doing so in the spirit of Weber to study the ‘whole’ but also in the spirit of experimenting science. Mind Genomics is a branch of experimental psychology, one informed by consumer research in the world of the applied, informed by the statistics of experimental design, and inspired by the images of the MRI (magnetic resonance imagery) in medicine which takes pictures of tissues from different angles, and inspired by genomics which focuses what drives individuation [17-19].
Mind Genomics begins with notion that people may not know what they are thinking but will know It when they see it. The strategy of a Mind Genomics experiment is to combine elements, messages, descriptions of various aspects of the topic (banquet halls), create small vignettes whose composition is known, present the combinations to respondents, obtain a response to the combination, and then estimate the degree to which each element in the combination drives the response. The experiments are quick, affordable, informative, and archival. Most of all, the experiments are targeted to answer question in a direct fashion.
We show the use of Mind Genomics to study banquet facilities, beginning with the topic (Banquet facilities), moving through the selection of questions and answers, and then on to the actual study, the data and analysis, the discovery of mind-sets even within this limited world, and finally the creation of a tool to discover these mind-sets in the population. The demonstration study, which can be developed and run in less than a day, provides the potential to generate a ‘Wiki of the Mind’ for topics relevant to society, in different cultures, different situations.
Explicating the process through the study of choosing a banquet hall
Step 1 – Choose the topic, questions, and answers
The topic is banquet halls. In this particular version of Mind Genomics, we deal with the 6×6 design, comprising six questions, and six answers to each question. Table 1 shows the six different questions, and for each question six different answers. The questions and answers are left to the researcher(s). The questions and answers emerge after about 20-30 minutes of brainstorming among a group of four researchers who have never experienced Mind Genomics research before. Mind Genomics has been developed to promote rapid iterations, so one need not spend a great deal of time thinking about the questions and answers, and perhaps even overthink.
Table 1: The raw material for the Mind Genomics study of the banquet hall; six questions and the six answers to each question
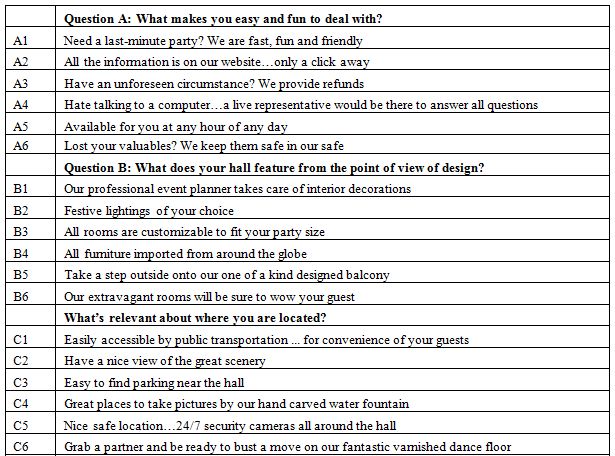
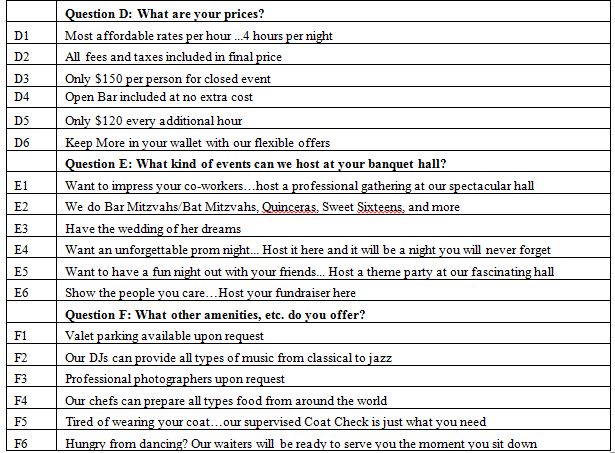
The objective of Mind Genomics, the creation of the aforementioned ‘wiki of the Mind’ requires that the test stimuli be relevant for everyday life, and not simplistic statements of the type that one would not typically encounter. That is, the stimuli in Mind Genomics are of the type that would be appropriate for the quotidian, commercial and social aspects, rather than artificially created stimuli, manipulated so that the responses to these artificial stimuli would be able to support a hypothesis about behavior, or disprove it. Thus, one can look at the material in Table 1 in the light of an ethnographic report of the types of messages one might encounter in every-day life.
A key aspect of Mind Genomics is the reality that one need not be ‘right’ at the start of the Mind Genomics experiments. Whereas in most research the effort requires a great deal of planning, the selection of the ‘correct’ test stimuli, the appropriate scales, and the appropriate respondents, the science of Mind Genomics was created to more realistically simulate the exploration of the everyday, where one does not weigh the alternatives in a carefully considered manner, in the fashion called System 2 by Nobel Laureate Daniel Kahneman [20]. Rather, the typical approach is the more automatic approach, called System 1, or in the thought of Harvard psycholinguist George Miller, TOTE, Test, Operate, Test, Exit [21]. One need not be exact to study inexact behavior. One need only be systematic, consistent, affordable, fast, and scalable to create archivable, solid knowledge.
Step 2 – Combine the elements into short, easy to read vignettes, or test concepts, each vignette comprising a maximum of four elements, and a minimum of two elements
Figures 1 and 2 show the same vignette, comprising four elements. The elements are placed one atop the other, left justified, set up to be easy to read. No effort is expended to tie the elements together.

Figure 1: Example of a 4-element vignette, showing the first rating scale (likely to choose)

Figure 2: Example of the same 4-element vignette, showing the second rating scale (select the emotion)
The vignettes are created by an underlying statistical plan called an experiment design [22]. The design for the 6×6 (six questions, each with six answers), comprises 48 vignettes, each element appearing five times, and absent 43 times. A vignette can have at most ONE element or answer from a question. This particular property of incompleteness is necessary to ensure that the 36 elements are statistically independent of each other.
Each respondent evaluates a unique set of 48 vignettes, different from the set evaluated by the other respondents. This strategy is known as a permuted design [23], ensuring that the combinations different across respondents. The strategy is to uncover the underlying pattern in the data (viz., how the elements drive the responses) by testing many combinations only once and putting together the pattern from these many combinations. The strategy is similar to the manner of the MRI (magnetic resonance imagery), which takes many pictures of an object from different angles and combines these by computer to create a 3-dimensional image. The Mind Genomics strategy differs dramatically from the conventional approach of selecting a limited set of vignettes (e.g., 48), to represent all combinations, and then testing the same 48 vignettes with many respondents to average out random error.
Step 3 – Invite the respondents to participate, and collect the ratings
Each respondent is invited through an on-line panel company, specializing in these types of studies. It is important to work with a panel provider because otherwise the response rate is low, and the study may take a week to complete, rather than the more normal hour or two. Panel companies have lists of respondents who have agreed to participate. Most panel companies can tailor the list of respondents by a variety of criteria ranging from simple geo-demographics to self-stated attitudes and behaviors. For this study, the criteria were general, since the focus was on ideas appealing to the general public. Figure 3 shows the introduction to the vignettes, including the scales on which the vignettes will be rated.
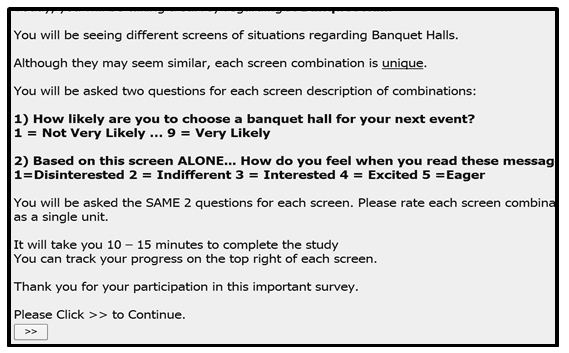
Figure 3: Orientation screen, showing instructions to the respondents, the two scales, and the expected time that will be needed to complete the Mind Genomics experiment. The experiment is positioned as a ‘survey’.
Step 4 – Create the database, to prepare it for regression analysis, and for cluster analysis, respectively
The database for the Mind Genomics study comprises one row for each vignette, for each respondent, respectively. Each of the 57 respondents evaluated 48 unique vignettes, generating a set of 2,736 rows of data. The first 36 columns of data corresponded to the 36 elements, with the database showing the number ‘1’ for those elements appearing in the particular vignette, and the number ‘0’ for those elements absent from the particular vignette. Since a vignette could comprise 2-4 elements, only 2-4 cells contained the value ‘1’, and the remainder contained the value ‘0.’ The 37th column contained the rating 1-9, and the 38th column contained the choice of the emotion.
The rating scale, values shown in the 37th column, was transformed to a binary scale, TOP3, following the practice in consumer research and public opinion studies. It is not easy to explain what is meant by any rating scale, unless each point is labelled. Researchers argue over the labelling of each point. An easier way is to bifurcate the scale into a binary scale, with the lower part of the scale (1-6) transformed to 0, and the upper part of the scale (7-9) transformed to 100. The ‘cut-point’ (6,7) is defined arbitrarily. The effect creates a ‘No/Yes’ variable, one easier explain. In order to ensure that it would be possible to run an OLS (ordinary least-squares) regression analysis on the 48 vignettes for each respondent, the Mind Genomics program added a very small random number (<10-5), to ensure some variation in the dependent variable. Otherwise, the transformed ratings from a respondent might all end up 0 or 100, were the respondent to have confined the rating to the low end of the scale, 1-6, or to the high end of the scale.
The ratings in the 38th column, the selection of emotions, were treated in a different fashion. There were five emotions. The rating scale is known as a ‘nominal scale,’ with the values 1-5 standing for different emotions. To prepare the data for analysis by OLS regression requires the expansion of the one scale into five new scales, one scale for each emotion, respectively. The expansion added five new columns of data. The respondent had to select one emotion for each vignette. The newly created variable corresponding to that emotion was coded as ‘100’ plus a very small random number. The remaining newly created variables corresponding to the four emotions not chosen were coded as 0 plus a very small random number. Thus, the five emotions were coded to immediately reveal which feeling/emotion was selected.
At this point the data matrix is ready for analysis by OLS (ordinary least-squares) regression, a well-accepted statistical technique, also colloquially known as curve-fitting. The OLS regression is executed in two steps, first to create 57 individual level models in preparation for clustering to reveal mind-sets, and then run with groups of respondents, defined by who they are (e.g., Total Panel, Gender, Age), and by how they think about the topic of banquets, here specifically three mind-sets. This paper presents only the data from the Total Panel, and from three mind-sets, respectively.
Step 5 – Create an individual-level model for each of the 57 respondents, using OLS regression, and then cluster the 57 respondents into two, and then three groups (mind-sets)
One of the continuing themes of Mind Genomics is that people differ from each other in the way they think about a topic. These different ways are called mind-set. Step 5 discovers these mind-sets.
The experimental design ensures that the 36 elements arrayed in the 48 vignettes are set up to allow for OLS regression, relating the presence/absence of the 36 elements to the binary response (TOP3), which was either 0 (rating 1-6) or 100 (rating 7-9). The OLS model was estimated without an additive constant, called forcing the regression through the origin. Estimating the coefficients without an additive constant will make it easier to cluster the respondents into either two mind-sets or into three mind-sets, respectively. The equation for the individual respondent is written as: Top3 = k1(A1) + k2(A2) … k36(F6).
The OLS regression is run 57 times, one for each respondent. The preparation stage using OLS regression generates the necessary data matrix comprising 57 rows, one per respondent, and 36 columns, one per element. The matrix is then subject to cluster analysis [24]. The cluster analysis puts the respondents into two groups and then into three groups. Respondents in a cluster show similar patterns of coefficients. Cluster analysis simply provides the solutions but does not decide the number of clusters (mind-sets). It is the researcher who selects the number of mind-sets based upon two criteria. Criterion #1 is interpretability. The strongest performing elements must tell a coherent story. Criterion #2 is parsimony. It is better to have fewer clusters than more clusters, given equal interpretability.
Step 6 – Create the model for the Total Panel and for each of three cluster which emerge
The clustering in Step 5 suggested three groups, also known as mind-sets. Two groups or mind-sets were hard to interpret. The final analysis to understand what drives selection of the banquet hall comes from putting all of the RELEVANT data together into one file and running one grand OLS regression on the data. This time the regression equation has an additive constant whose purpose will be explained below.
Right after the OLS regression on the Total Panel come three separate OLS regressions, first on the data from all respondents assigned by cluster program to Cluster 1 (Mind=Set1), second on the data from all respondents assigned to Cluster 2 (Mind-Set 2), and third and finally, on the data from all respondents repsondents assigned to Cluster 3 (Mind-Set 3). The one equation for each OLS regression is expressed as: Top3 = k0 + k1(A1) + k2(A2) … k36(F6). The analysis below will reveal just how radically different are the mind-sets of these groups. The rationale for the additive constant is that in the absence of specific information about the banquet hall there is still a proclivity to choose the banquet hall. The additive constant measures that proclivity.
Step 7 – Create a model for the Total Panel showing the linkage of each element to every one of the five emotions (scale 2)
Recall that Step 4 above, preparing the data for OLS regression, mapped the second rating scale, selection of emotions, to five new binary scales, one per emotion. The data are ready for OLS regression. This time the dependent variables are the five newly created variables, one per emotion, with the values 0 or 100, depending upon the selection of the emotion. The independent variables are the 36 elements. The model is run without the additive constant, this time because in the absence of elements there is no proclivity to choose an emotion, and therefore the additive constant is by definition 0. The reality is that whether we include an additive constant or not, the coefficients of the elements will show the truly strong performing elements.
Step 8 – Create a PVI (personal viewpoint identifier) to assign new people to one of the three mind-sets
Study after study in the world of Mind Genomics reveals that the respondents in the same mind-set fall into different geo-demographic, behavioral, and attitudinal groups. The Mind Genomics study for banquet halls is such a narrow topic that we would not expect the mind-sets to distribute by gender, age, and so forth. Thus, there needs to be a way to assign a new person to one of the mind-sets which emerge, if only to improve the nature of the interaction between sales/manager of the banquet hall and customer hiring the services of the banquet hall for a particular event. The topic of banquet halls is very narrow, and it is quite unlikely that the scientific literature can provide much guidance about how to identify the mind-sets, if even the scientific (or business) literature recognizes the existence. The PVI will be used to create a tool comprising six question which will assign a new person to one of the three mind-sets.
Results
Total panel versus emergent mind-sets
Respondents cannot easily tell the researcher what is important versus what is not important. Yet, the coefficients from the model reveal immediately how strongly each element drives the TOP3, the rating ‘I would choose’.
We begin with the additive constant. The additive constant tells us the conditional probability of a person responding 7-9 on the 9-point scale, viz., I would likely choose this banquet hall from my next event. Keep in mind that most respondents are not in the immediate situation of choosing a banquet hall. We would expect, therefore, that the respondents have not thought about the banquet hall. What is remarkable, but not surprising, is the very low additive constant, 6, one of the lowest for total panel in the many Mind Genomics studies conducted by author HRM. At a basic level the respondents are simply not interested in the banquet hall. The respondents are being honest. They are reading the vignettes and, not being interested in a banquet hall, they respond that they are not interested.
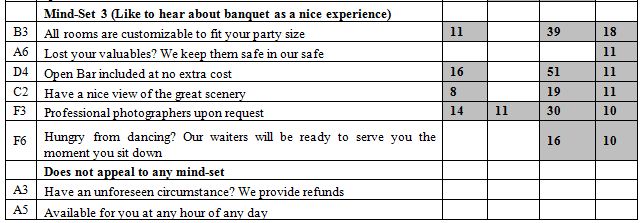
Beyond the additive constant is the contributory power of the different elements. The typical standard errors are around 3-4 for the coefficients of the elements. Table 2 shows the strong performing coefficients for the 36 elements by Total Panel, and by the three mind-sets which emerge, and discussed below. The elements are shown in descending order based upon the three mind-sets. To allow patterns to emerge, we will remove any coefficients lower than +8. We lose some of the fine-grained information, but the patterns more clearly emerge.
Table 2: Performance of the elements by Total Panel and by the three mind-sets. Only strong performing elements are shown, with coefficient of 8 or higher.
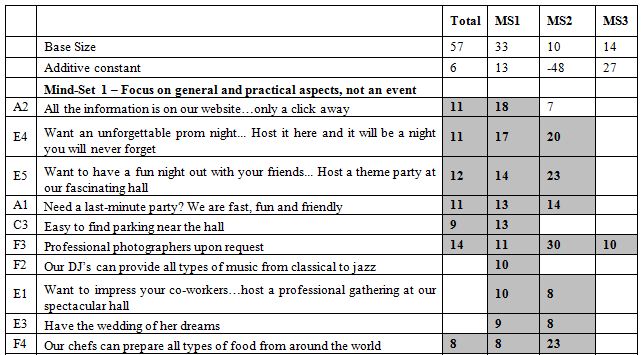
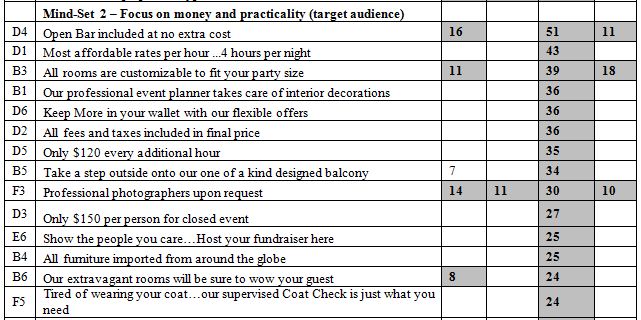
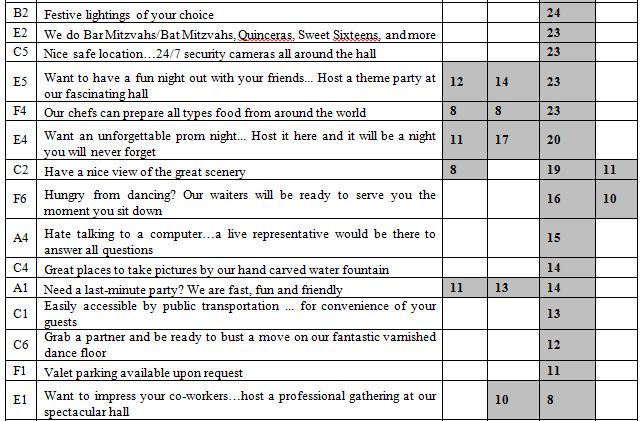
We can sort the elements based upon the Total Panel, and pull out the very strong performing elements, those elements with coefficients of +10 or higher. The coefficient tells us the increased (or decreased) percent of responses of magnitude 7-9 beyond the percent shown by the additive constant when the element is inserted into the vignette. For example, the additive constant is 6 for the Total Panel, meaning that in the absence of elements we expect to see 6% of the ratings be 7-9. Incorporate the element D4, Open Bar included at no extra cost, and we can expect an additional 16% of the responses (viz., 22%) to be 7-9. Choose D3 instead, Only $150 per person for closed event, and we can expect to lose 9% of the respondents, viz., end up with a sum of -3, viz., virtually none of the rating being 7-9. Put both D4 and D4 in together, and we can expect the percent of ratings 7-9 to be 6% (additive constant) + 16% (Open Bar …) – 9% ($150 per person) or 13%.
There are seven very strong elements. They make sense. These are the elements with coefficients of +10 or higher. There is no single ‘theme’ appropriate to these seven elements. They range from open bar to photographer, to flexibility, and so forth. It should be kept in mind that without the Mind Genomics experiment it would be highly unlikely for anyone to be able to predict that each of the seven elements would be perform well. It takes an experiment to reveal the winners.
Open Bar included at no extra cost
Professional photographers upon request
Want to have a fun night out with your friends… Host a theme party at our fascinating hall
Want an unforgettable prom night… Host it here and it will be a night you will never forget
Need a last-minute party? We are fast, fun and friendly
All the information is on our website…only a click away
All rooms are customizable to fit your party size
There are elements with coefficients of 0 or lower. These are not necessarily ‘bad’ but may be either ‘bad’ (ratings of 1-3) or ‘irrelevant’ (ratings of 4-6). We would have to analyze the data from the opposite side of the scale (1-3 transformed to 100; 4-9 transformed to 0). That analysis in the reverse direction would tell us whether the negatives are truly ‘bad’ (1-3) or merely irrelevant (4-6.)
The more revealing results emerge when we consider the nature of the mind-sets, what attracts these mind-sets, and the existence of an underlying theme for each mind-set. Respondents may or may not know about mind-sets. Indeed, unless the topic of banquet halls comes up as a focus of one’s conversation and plans, it is unlikely that one would even pay attention to what’s important about a banquet hall unless challenged to answer. The Mind Genomics experiment will, however, reveal these mind-sets in about 5-10 minutes.
The clustering program (Step 6 above) suggested three groups of respondents, based upon the pattern of coefficients. The three right-most columns of data show the strong performing elements for each of the mind-sets. An element performing well in two mind-sets appears, twice, once for each mid-set in which is performs well. The name to be given to the mind-set comes from the nature of the elements which perform best.
Mind-Set 1, with 33 respondents, has an additive constant of 13. The respondents are not particularly interested in the banquet hall but respond positively to elements of a very general nature. One gets a sense that Mind-Set 1 comprises individual who respond to general, practical information, but are not thinking of the specifics of an event.
All the information is on our website…only a click away
Want an unforgettable prom night… Host it here and it will be a night you will never forget
Want to have a fun night out with your friends… Host a theme party at our fascinating hall
Need a last-minute party? We are fast, fun and friendly
Easy to find parking near the hall
Mind-Set 2, with 10 respondents, has an additive constant of -48, but shows 29 of the 36 elements scoring very well. Mind-Set 2 is definitely interested in the particulars of the banquet. The very low additive constant is deceptive and is a statistical aberration to correct for the exceptionally high-scoring elements appropriate for a person who actively contemplates hiring a banquet hall. We can get a sense of their seriousness by looking at the elements which generate the exceptionally high coefficients of 30 or above. These are the respondents who are in the target audience.
Open Bar included at no extra cost
Most affordable rates per hour …4 hours per night
All rooms are customizable to fit your party size
Our professional event planner takes care of interior decorations
Keep More in your wallet with our flexible offers
All fees and taxes included in final price
Only $120 every additional hour
Take a step outside onto our one of a kind designed balcony
Professional photographers upon request
Mind-Set 3 with 14 respondents shows the highest additive constant, 27. They are modestly interested in the notion of a banquet hall, but the highest scoring elements give a sense of a casual shopper looking at the offer of a banquet hall. The only element which strongly interests them are ‘All rooms are customizable to fit your party size.’ One gets a sense that this is information which is ‘nice to know’ but the respondents are not excited by the idea of a banquet hall in the same way that respondents in Mind-
Set 2 are.
All rooms are customizable to fit your party size
Lost your valuables? We keep them safe in our safe
Open Bar included at no extra cost
Have a nice view of the great scenery
Linking elements to feelings/emotions
In the world of consumer research, the recognition of emotion as a key driver of purchase has a long history. Indeed, a great deal of the consumer research is on the emotions evoked by products, services, and advertisements. When emotions are invoked the typical approach instructs the respondents to select the one or two emotions which ‘fit’ the vignette. The standard analysis measures the percent of respondents assigning one or another emotion to the test stimulus, either for the entire test stimulus, or during the period that the test stimulus is being evaluated, e.g., for a video.
The Mind Genomics approach differs. The goal is to link each individual element to every one of the emotions. It is impossible to do that in a simple way because there are several different emotions, and the respondent’s job is extremely difficult to divide up the emotional feeling into the different parts. One might have the respondents select the most dominant emotion experience, the approach used here, or instruct the respondent to check ‘all which apply,’ not used here, but also feasible.
The mapping of the one rating (select the single emotion which best describes the feeling) into the five alternative emotions, allows the researcher to link the 36 elements to emotions. As noted in Step 7above, the analysis uses OLS regression, without incorporating the additive constant. The coefficients in the OLS equation can be considered to be the linkage between the element and the emotion. The linkages for the total panel appear in Table 3. Again we focus only on the strong linkages, this time defined as +8 or higher, based upon previous experiences with linkages in Mind Genomics.
Table 3: Linkages between the elements and the five feelings/emotions. Only strong linkages are show (>= 6)
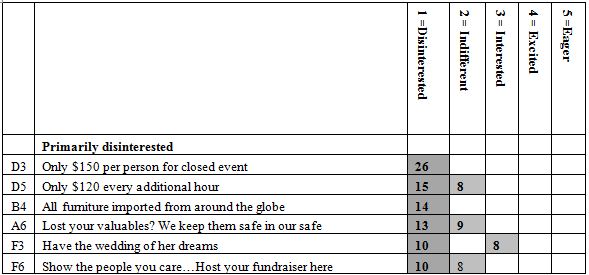
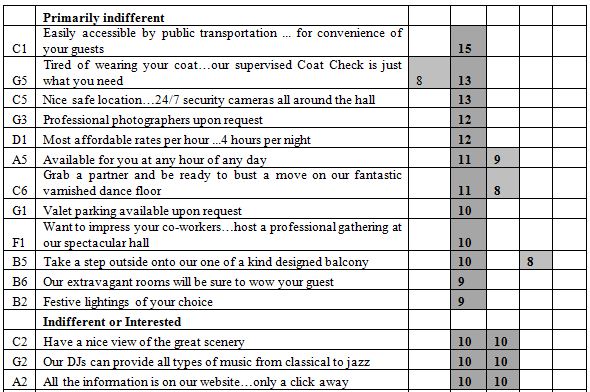
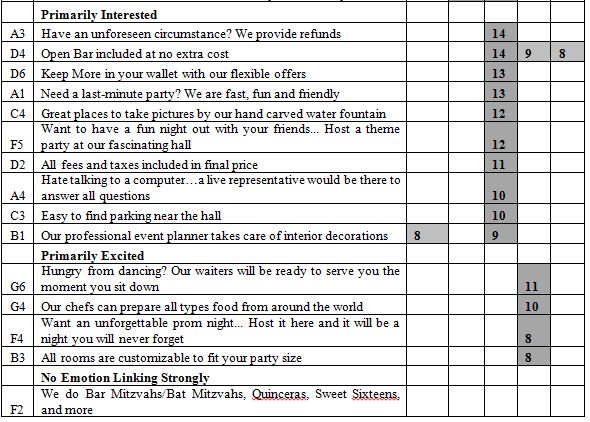
Most of the elements link strongly to feeling/emotion, as shown by the shaded cells. A few elements link strongly to two emotions. For example, element F3, Have the wedding of her dreams, a phrase not particularly interesting to anyone not contemplating marriage, links both to disinterested and to interested, presumably because of the very specific nature of the phrase, viz., a wedding.
Assigning a new person to a mind-set at any time in the knowledge development process
Knowing the nature of the mind-sets for topics of the everyday builds up the ‘Wikipedia of the Mind’. Beyond knowledge, however, is the opportunity to use the information for further research, or for applications such as sales. Rapidly and affordably uncovering the nature of the underlying mind-sets of people on any topic that can be dimensionalized is one distinct contribution of Mind Genomics. The second contribution is the ability to assign a new person to one of the mind-sets.
In the world of consumer research, sociology, and the like, there is a pervasive belief that ‘birds of a feather flock together,’ or more specifically, people who ‘look alike think alike.’ This notion underlies some of the strategies of companies such as Facebook, which observe a specific behavior of different people, and find commonalities among these people in terms of “who they are.” One can market to this newly created group by marketing to people which look like them, on a variety of dimensions, so-called look-alikes.
It is attractive to search for assignment rules which put new people into newly developed mind-sets. Those who work with so-called ‘Big Data’ believe that it is possible to do so, if only the algorithms and the computing power is sufficient, only if the data to be processed is sufficient, and only there are enough cases so that one is not working with random noise. The attraction of such ‘hope’ is enormous, despite the fact that the use of Big Data is to assign individuals to specific, granular segments, of a type that may not even be suspected.
Such marketing strategies make sense when one looks at behavior from the ‘outside-in’, searching for common properties of a group of people which are of interest. Mind Genomics works from the opposite direction, knowing that there are certain ways of ‘thinking’ about a topic, and then determining how a new person thinks about the topic. The approach is not to find lookalikes, but rather to create a simple test which assigns a person to a mind-set. The test, called a PVI, personal viewpoint identifier, is applied to the data of the original group of respondents which defined the mind-set, and then applied to new individuals.
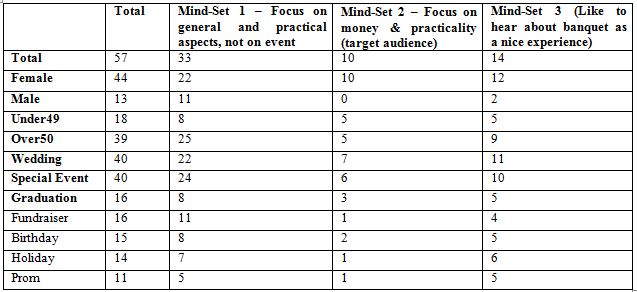
Table 4 shows the distribution of the respondents by total panel and by the three mind-sets. The respondents completed a short classification questionnaire at the start of the study. The questionnaire provided the respondent’s gender, age, and the reason(s) that the respondent might be interested in hiring a banquet hall. The respondents could select any number of the different reasons for hiring a banquet hall. It is clear from Table 4 that the mind-sets are found in all of the groups into which the respondent can define herself or himself. It is not easy, if even possible, to develop a simple assignment rule to mind-set based simply upon the pattern of who the respondent says she or he IS, or what she or he would hire a banquet hall.
Table 4: Distribution of the respondents into groups (gender, age, reason for hiring a banquet hall.)
Mind Genomics provides an entirely different approach to assigning people to groups, one working from the bottom up, from the simple granularity of an experiment that can be conducted in an hour or two, or several iterative experiments that can be conducted in a day or so. The approach used by Mind Genomics is called the PVI, the personal viewpoint identifier.
The PVI uses the basic data from the mind-sets (see Table 2), perturbing the data with random numbers added to the coefficients. Through a Monte-Carlo simulation the PVI identifies six elements which best differentiate among the mind-sets, based on a two-point scale. The PVI then generates 64 patterns. Each pattern maps to one of the two or three mind-sets.
Figure 4 shows the introductory page to the PVI, which obtains relevant information about the respondent. Each question can be suppressed. Some of the information is appropriate to marketing, other information, e.g., about time, relevant to scientific studies about decision making and diurnal rhythms and so forth. Figure 5 shows the actual PVI itself, comprising background questions about attitudes and usage, as well as the six question, which appear in randomized order, different for each respondent. The six questions appear after the background questions. Finally, Figure 6 shows the feedback to the respondent regarding the mind-set to which the respondent is assigned. The information from Figures 4-6 are maintained in a user-accessible database. Thus, the PVI provides both ‘gamification’ to interest the respondent, and archival information for subsequent work. The respondent can also be immediately led to a video or to a ‘landing page’ on a website, depending upon the mind-set to which the respondent has been just assigned.

Figure 4: Introductory page to the PVI
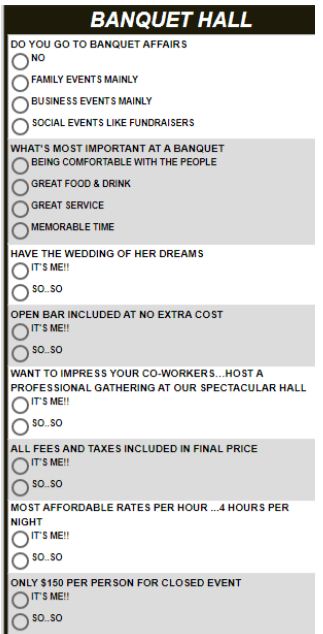
Figure 5: The background questions and the six PVI questions

Figure 6: Results from the PVI, sent to the respondent. The mind-set to which the respondent is assigned is shown by the shaded cells.
Discussion and conclusion
The Mind Genomics experiment detailed here represents a divergent way of thinking in social science. As noted in the introduction, researchers in the social science usually forego the experimental method in favor of observation when the topic is everyday behavior. The psychologists and economists might study everyday behavior, but with the exception of researchers such as Robert Shiller [25], few economists and psychologists study the simple, every-day experience, which constitutes the warp and woof of social life.
The story changes a little when we move beyond anthropology, sociology and classical economics to some aspects of experimental social psychology, behavioral economics, and occasionally consumer research, respectively. The experimentation focuses on what might be considered unusual perturbations of the everyday, such as varying prices or prices expressed in different ways. The objective is, through the experiment, to express some generality of behavior, such as the fact that people like prices specified by text rather than by numbers When it comes to consumer research the effort is no so much on experimentation at all as on the role of the test stimulus (the nature of the banquet hall, etc.) in driving choice.
Mind Genomics provides the researcher with a new set of tools, systematic experimentation that can be done using simple to vary stimuli (viz., combinations of messages, or combinations of visuals [26], and a simple respondent task (e.g., read/look, and then rate the combination on the basis of criteria laid out in a rating scale provide to the respondent.) In doing so, Mind Genomics may open up our understanding of ‘typical’ human behavior of the everyday, a rich source to understand the ‘mind of man.’
Statistical appendix – establishing consistency of response
The impetus for this statistical appendix comes from the continuing question by those introduced to the method, name ‘can people really do this task?’ We are accustomed to many people in the applied profession of consumer research who believe that ordinary people simply cannot be consistent when evaluating mixtures of messages. The ingoing assumption is that unless the messages are simple, the respondent becomes totally confused. This assumption is reinforced by exit interviews in which respondents ‘complain’ that they did not do the study correctly because they did not ‘know’ what the researcher wanted to hear, and thus they feel that their answers were random.
In order to address these ongoing issues, one can point to the data and show that the pattern of responses is meaningful, at least at an intuitive level. An example of this is element D4, ‘Open Bar included at no extra cost’ with a coefficient of +16 for the Total Panel. Such suggestions of valid results appear in study after study, but are not considered sufficiently rigorous. Some critics want statistical evidence of reliability, such as split half reliability.
One way to show consistency of responses, which may be a form of validity, is to demonstrate that the ratings accurately ‘track’ the stimuli, at the level of the individual respondent. That is, within the confines of the Mind Genomics experiment, one can create a model for each respondent relating the numerical ratings on the 9-point scale to the presence/absence of the 36 elements. The degree to which the ratings ‘track’ the elements is a measure of the consistency of the ratings, and in some respects to the validity of the respondent’s ratings within the confines of the Mind Genomics experiment.
The approach to establish consistency is to compute the Pearson multiple correlation for each respondent, showing the strength of a linear relation between the elements and the ratings. The Pearson multiple linear correlation goes from a perfect +1 (perfect linear relation), down to 0 (no apparent relation).
Figure 7 shows the distribution of multiple linear correlations for the respondents, based on 48 observations, and 36 predictors. The R values were computed by relating the presence/absence of the 36 elements to the 9-point rating, using OLS (ordinary least-squares) regression .More than half of the multiple linear correlations are 0.6 or higher, suggesting that despite the apparent difficulty of choosing the relevant information from the vignette, respondents act in a consistent manner, and in a seeming interpretable, rational manner as well.
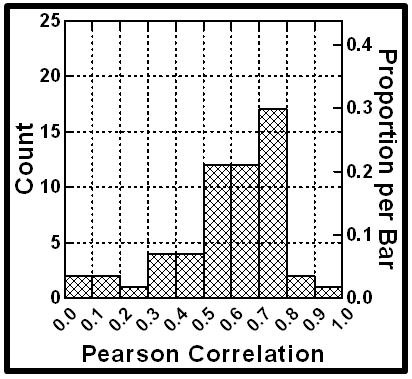
Figure 7: Distribution of the multiple Pearson R values across the 57 respondents.
Acknowledgement
Attila Gere wishes to acknowledge and thank the Premium Postdoctoral Research Program of The Hungarian Academy of Sciences
References
- Dunbabin KM (2003) The Roman Banquet: Images of Conviviality. Cambridge University Press.
- Graham JW (1967) A banquet hall at Mycenaean Pylos. American Journal of Archaeology 71: 353-360.
- Anglo S (2017) Overcrowding at court: A Renaissance problem and its solution: temporary theatres and banquet halls. In Architectures of Festival in Early Modern Europe 201-212.
- Chau AY (2008) The sensorial production of the social. Ethnos 73: 485-504.
- Meads C (2001) Banquets Set Forth: Banqueting in English Renaissance Drama. Manchester University Press.
- Edwards W (1987) The commercialized wedding as ritual: A window on social values. Journal of Japanese Studies 13: 51-78.
- Lau CK, Hui SH (2010) Selection attributes of wedding banquet venues: An exploratory study of Hong Kong prospective wedding couples. International Journal of Hospitality Management 29: 268-276.
- Schoenfeld S (1987) Folk Judaism, elite Judaism and the role of bar mitzvah in the development of the synagogue and Jewish school in America. Contemporary Jewry 9: 67.
- Adler H, Chienm TC (2005) The wedding business: a method to boost food and beverage revenues in hotels. Journal of Foodservice Business Research 7: 117-125.
- Choi JH, Choi YJ (2017) The effect of service scape of banquet hall at special class hotels on customer satisfaction and positive word-of-mouth intention. Korea Tourism Research Association 32: 125-145.
- Kim YK (2016) A study on the relationship among service quality and customer satisfaction of wedding hall restaurants, and recommendation intensity-focus on the moderating effect of wedding hall and hotel image. Culinary Science and Hospitality Research22: 252-266.
- Kim GC, Lee YJ (2009) A study on the importance and performance of the display of dining space for Hotel banquets. Culinary science and hospitality research 15: 173-187.
- LaFleur T, Hyten C (1995) Improving the quality of hotel banquet staff performance. Journal of Organizational Behavior Management 15: 69-93.
- Noone BM, Kimes SE, Renaghan LM (2003) Integrating customer relationship management and revenue management: A hotel perspective. Journal of Revenue and Pricing Management 2: 7-21.
- Guan L (2014) “Push and Pull Factors in Determining the Consumer’s Motivations for Choosing Wedding Banquet Venues: A Case Study in Chongqing, China”. Graduate Theses & Dissertations. 13851.
- Peng MC, Wang RY (2017) Evaluating wedding banquet halls using a novel multiple-criteria decision-making model. Advances in Management and Applied Economics 7: 13-28.
- Moskowitz HR (2012) ‘Mind genomics’: The experimental, inductive science of the ordinary, and its application to aspects of food and feeding. Physiology & behavior 107: 606-613.
- Moskowitz HR, Gofman A, Beckley J, Ashman H (2006) Founding a new science: Mind genomics. Journal of sensory studies 21: 266-307.
- Moskowitz HR, Gofman A (2007) Selling Blue Elephants: How to Make Great Products that People Want before they even Know they Want Them Pearson Education.
- Kahneman D (2011) Thinking, Fast and Slow. Macmillan.
- Miller GA, Galanter E, Pribram KH (1960) Plans and the Structure of Behavior. Henry Holt and Co.
- Box GE, Hunter WH, Hunter S (1978)Statistics for Experimenters (Vol. 664). New York: John Wiley & sons.
- Gofman A, Moskowitz H (2010) Isomorphic permuted experimental designs and their application in conjoint analysis. Journal of Sensory Studies 25: 127-145.
- Jain AK, Dubes RC (1988) Algorithms for Clustering Data. Prentice-Hall, Inc.
- Shiller RJ (2017) Narrative economics. American Economic Review 107: 967-1004.
- Gofman A, Moskowitz HR, Fyrbjork J, Moskowitz D, Mets T (2009) Extending rule developing experimentation to perception of food packages with eye tracking. The Open Food Science Journal 3: 66-78.
- Moskowitz MR, Ashman H, Minkus-McKenna D, Rabino S, Beckley JH (2006) Databasing the shopper’s mind: Approaches to a ‘mind genomics’. Journal of Database Marketing & Customer Strategy Management 13: 144-155.