DOI: 10.31038/ALE.2024113
Abstract
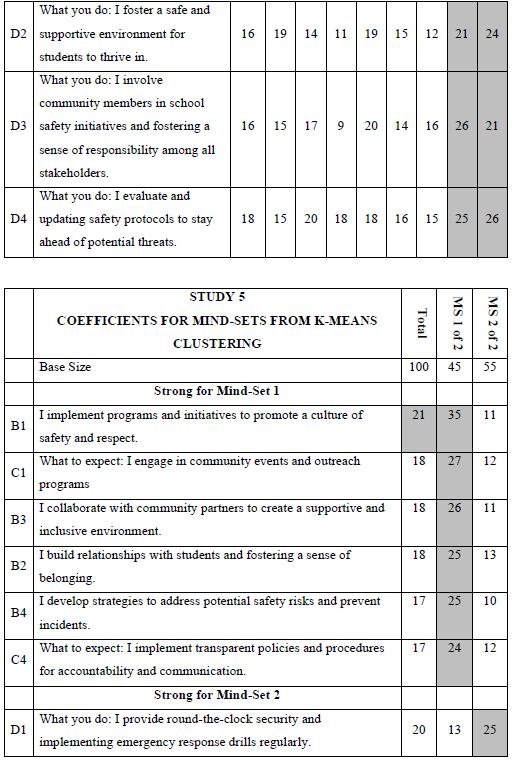
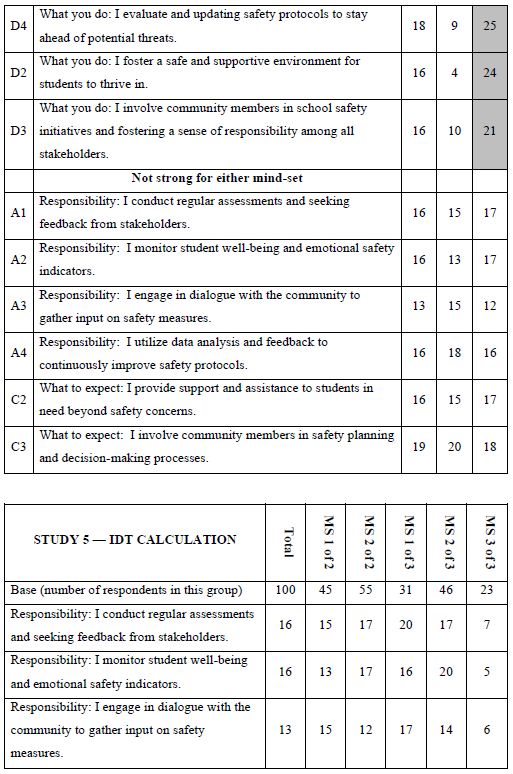
The paper presents the empirical evaluation in a Mind Genomic format of five sets of 16 elements each, previously generated entirely by AI, and dealing with the issue of aspects of a police officer’s job focused in a school, in a small town in Pennsylvania. The respondents, ages 18-30, read combinations of messages (elements) about the job, these elements combined by experimental design into vignettes comprising 2-4 elements per vignette. The results from all five studies revealed the very strong performance of the elements when the respondents were divided into mind-sets. Three studies each generated three mind-sets, two studies in turn, each generated two clear mind-sets. The entire process — from the generation of the ideas to the validation with people — required approximately four days and was done in an affordable fashion with available technology, generating easy-to-understand, immediately actionable messaging. The five studies along with the rapid generation of the ideas using generative AI open up the possibilities that AI may help to better communicate with people, through the combination of LLM (large language models) and Mind Genomics empirical thinking and experimentation.
Keywords
Generative AI, Mind genomics, Police recruitment, Synthesized mind-sets
Introduction
In the companion paper, “School Crossings and Police Staffing Shortages: How Generative AI Combined with Mind Genomics Thinking Can Become “Colleague,” Collaborating on the Solution of Problems Involved in Recruiting,” we presented four strategies to approach the issue of recruiting for a police officer position in TOWNX. Strategy 3 in that paper dealt with the creation of questions and answers. The answers were to be given by four AI-synthesized mind-sets: Dedicated Public Servant, Compassionate Protector, Community-Focused, and Proactive Problem Solver. Thus, Strategy 3 generated questions about the topic of recruiting, and answers to the questions from four simulated mind-sets. There was no guidance of the process from a human being, other than the basic question of how one gets a person to consider a career in law enforcement. This paper continues that work, looking at these AI-generated, best- guess questions and answers, not with artificial intelligence alone, but with actual respondents living in the state of Pennsylvania and of the proper age, 18 to 30, with a high school diploma, who might be interested in having a career in law enforcement. That is, how well do the ideas generated by artificial intelligence end up performing when given to real respondents in the Mind Genomics platform?
Mind Genomics
Mind Genomics is an emerging science with origins in experimental psychology and statistics and consumer research. The background to Mind Genomics and the computational approaches have been well documented and presented elsewhere [1-3]. Here are some of the specifics relevant to the data presented in this paper:
- The researcher identifies a topic of interest. Here, the topic is what communications are effective to get a young person (ages 18-30) to want to join the police force and be part of the effort to help at school properties, among other tasks.
- The researcher creates four questions. Figure 1 shows the requirement to fill in the four questions (Panel A) and the four questions that were filled in (Panel B).
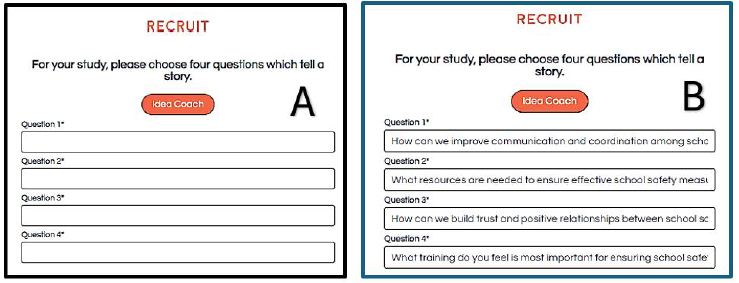
Figure 1: The BimiLeap.com screen guiding the user to provide or create the four questions (Panel A) and then the completed screen as typed in by the user (Panel B).
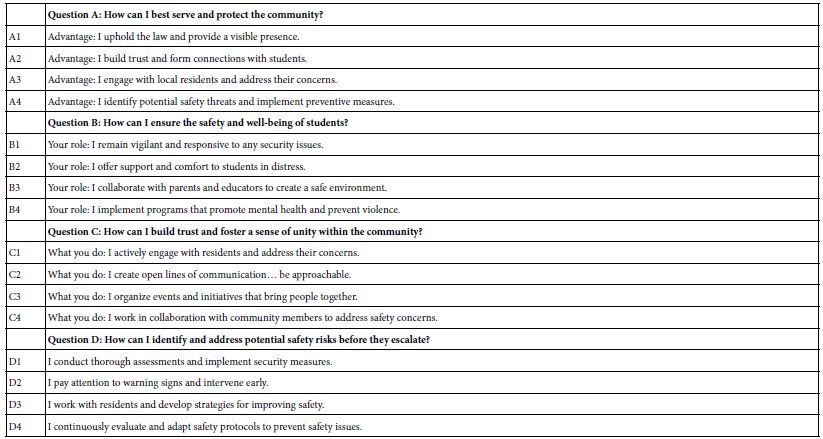
It is at this point that many prospective researchers “hit a blank wall,” feeling that they are unable to create questions. The Mind Genomics platform has been augmented with generative AI (ChatGPT 3.5) [4- 7]. The user accesses the AI through Idea Coach. Strategy 3 in the companion paper shows how AI can generate 21 questions of interest, with a simple prompt. This paper uses the 21 questions from Strategy 3 to create the questions needed for five separate experiments using the Mind Genomics platform. For each question, the researcher is instructed to provide four answers. This task is simpler, less daunting. In the companion paper, we created the questions. For each question, we generated four answers reflecting the way different types of people with different ways of thinking about the problem would answer the question. Table 1 also shows the four answers for each question. The answers were provided by AI, in the companion paper, but have been edited to be more “standalone.”
Table 1: The five questions and the four answers to each question.
Properties of the Vignettes Created by the Underlying Experimental Design
The basic unit of evaluation at the level of the individual respondents is the set of 24 vignettes, presented to and evaluated by the respondent one vignette at a time, in an interview lasting about three minutes, and done on the internet. Each respondent evaluates a different set of 24 vignettes. Rather than having to “know” the best range to test, the approach allows anyone to become an expert simply by testing many elements in this format [8]. The vignette comprises a combination of 2-4 elements, viz., message (see Figure 2, Panel B as an example of a vignette). These vignettes are created according to an experimental design. The design prescribes that there be four sets of four statements each. The statements are “elements” in the language of Mind Genomics. Each vignette comprises a minimum of two elements and a maximum of four elements. Each vignette has either one or no elements from a question. Thus, a vignette can never comprise two mutually exclusive or contradictor elements, viz., different answers or elements from the same question. The experimental design prescribes the specific composition of each vignette or combination of the 24 vignettes. For each set of 24 vignettes allocated to one respondent, each of the 16 elements appears exactly five times, once in five different vignettes, and absent from the remaining 19 vignettes. The 16 elements are statistically independent of each other, allowing the researcher to use statistical modeling (e.g., ordinary least squares regression analysis, OLS regression) to estimate the linkage between the presence of the 16 elements, and the rating that will be assigned by the respondent [9].
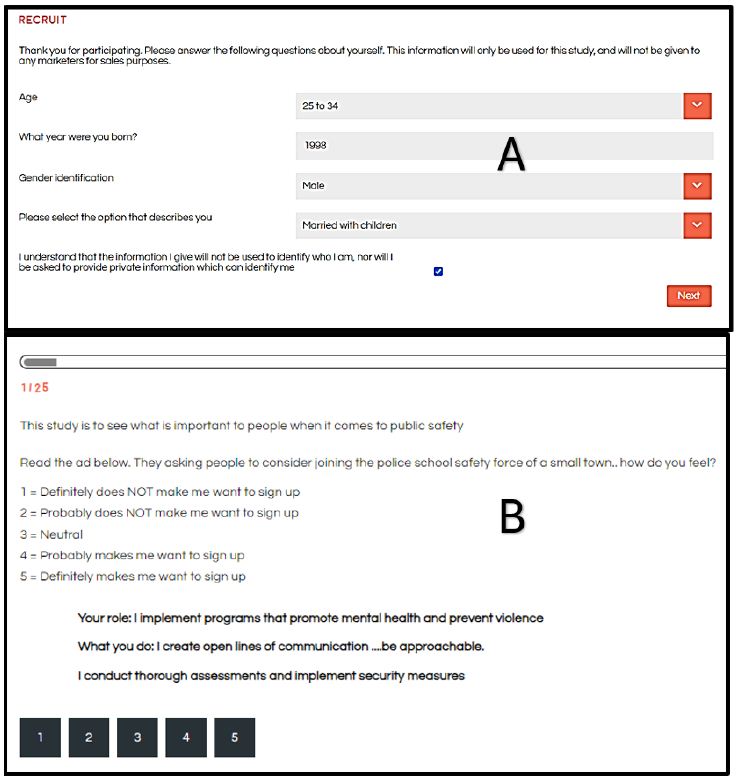
Figure 2: The respondent experience. Panel A on top shows the self-profiling classification in a pull-down menu. Panel B on the bottom shows one of 24 vignettes that the respondent will evaluate.
The Respondent Experience
These studies are typically run with respondents who have agreed to participate, signing an agreement with an online research panel “provider.” These research panels comprise thousands of individuals from all over the country and all over the world. The panel members are invited to participate, usually by email. They receive some remuneration for each participation, with the remuneration administered by the panel company. The user is guaranteed that these are not bots, but rather real people. The respondents are invited to participate by an email based upon the qualifications requested by the researcher. The respondents who agreed to participate press a link and are led to the interview. The interview itself is simple and the explanation of the interview is done by a series of slides at the beginning of the interview. The researcher first obtains some additional classification from the respondent using a pull-down menu (Figure 2, Panel A). Currently, the platform, BimiLeap.com, provides the user with up to 10 self-profiling questions, two of which are fixed: age and gender, respectively. That information can be extended dramatically to many more questions. The respondent then reads an orientation, and is led to the set of 24 vignettes, presented one vignette at a time. Figure 2, Panel B shows an example of the vignette that the respondent sees. The vignette itself comprises two to four elements as noted above, along with a short introduction to the project present in each vignette and of course the rating scale present in each vignette. The respondent reads the orientation, usually once, skips to the vignette, reads the vignette, and then assigns an answer. The objective is to get the respondent’s immediate impressions, almost a so-called “gut feeling,” where it is not judgment but feelings which are dominant.
The spare design of the vignette, without any connectives, may seem unpolished. The reality is that this spare profile of the vignette reduces fatigue. The respondent “grazes” for information in a comfortable manner, rather than having to wade through the thickets of text to get to the ideas. The respondent evaluates the vignette, considering the 2-4 elements as one idea, scoring the vignette on the scale. The Mind Genomics platform records the rating, and the response time (RT), defined as the number of seconds elapsing to the nearest 100th of a second from the time the vignette was presented to the time the rating was assigned.
Automated Preparation of the Data for Statistical Analysis
The Mind Genomics platform now creates a database which is set up to facilitate analysis. The database comprises of records for each vignette. Since each respondent evaluated 24 vignettes, each respondent generates 24 rows of data. The first set of columns is reserved for information about the respondent, generated from a self- profiling classification. This information includes gender, age, and up to eight additional self-profiling classification questions. The second set of columns is reserved for the information about the 16 elements. Each element has its own column. When the element is present in the vignette the value is “1” in the cell. When the element is absent, the value is “0” in the cell. Each vignette rated on the 5-point rating scale is converted to a binary scale, R54x or “JOIN.” A rating of 5 or 4 is converted to 100 to denote interest in joining. A rating of 3, 2, or 1 is converted to 0, to denote not interested in joining. Then, a vanishingly small random number (<10-5) is added to the newly created binary variable. The rationale is to ensure that even when a respondent rated all 24 vignettes high (5 or 4), or all 24 vignettes low (3, 2, or 1), there will be some minimal variation in the newly created binary variable. That minimal variation is necessary for the data from a single respondent or in fact any group of respondents to be analyzed later on using OLS (ordinary least-squares) regression.
Statistical Analysis — OLS Regression to Find Linkages Between Elements and Binary Variable R54x
The Mind Genomics process is now standardized. The experimental design ensures that all of the elements for each respondent are independent of each other. This up-front effort ends up allowing OLS (ordinary least squares) regression to relate the presence/absence of the 16 elements to the binary dependent variable R54x (viz., interested in joining).
The equation is simple: R54x = k1A1 + k2A2… + k16D4.
The foregoing equation can be estimated at the level of the individual respondent, at the level of any group of respondents, and of course at the level of the total panel. Note that the equation has no additive constant. The ingoing rationale is that in the absence of elements we should have a rating of 0. There is no reason to “join” when there are no elements to communicate the job. The coefficients show the driving power of the elements as a motivator of joining. A coefficient of 20 is twice as much driving power to join as a coefficient of 10. A coefficient of 20 is 2/3 of the driving power of a coefficient of 30, and so forth. The coefficients can be thought of as psychological measures of probability saying “I will join” when the element is in the mix of messages. We should look for coefficients around 21 or higher.
Creating Mind-Sets
A key hallmark of Mind Genomics is the search for mind-sets, defined as groups of respondents with similar patterns of coefficients, who think the same way. These individuals are not necessarily like each other in other ways, but they do think similarly for the topic. The topic here is the messages which drive the respondent to say they would like to join. The approach to find these groups, so-called mind-sets, is called clustering. Clustering uses the individual sets of 16 coefficients as inputs. Clustering tries to put the respondents into a small number of predefined groups (e.g., 2 or 3), so that the pattern of coefficients of the individuals within the cluster or group is similar. At the same time, the average profile on the 16 coefficients for the two or three groups is different. The clustering program used by Mind Genomics, k-means clustering, works entirely by mathematics. It is only afterwards that we try to interpret the meaning of these clusters [10]. The clusters are called mind-sets.
Interpreting the Data
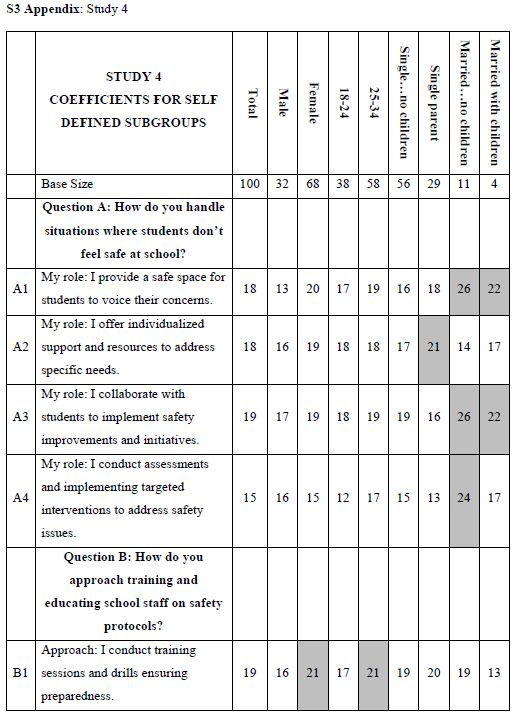
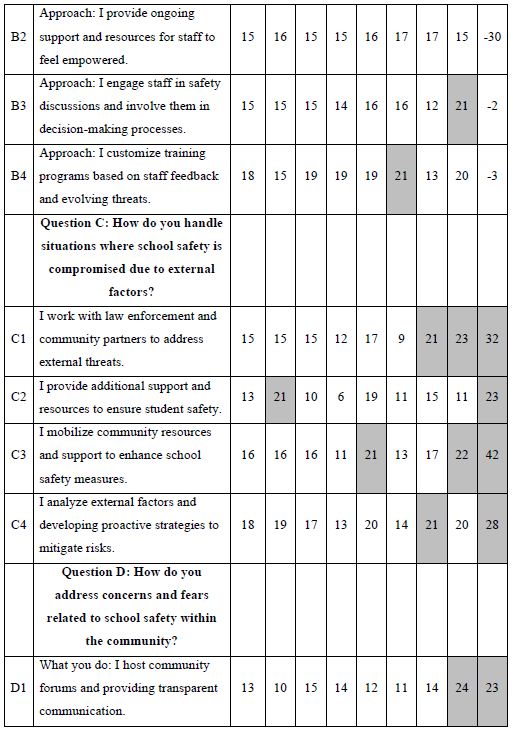
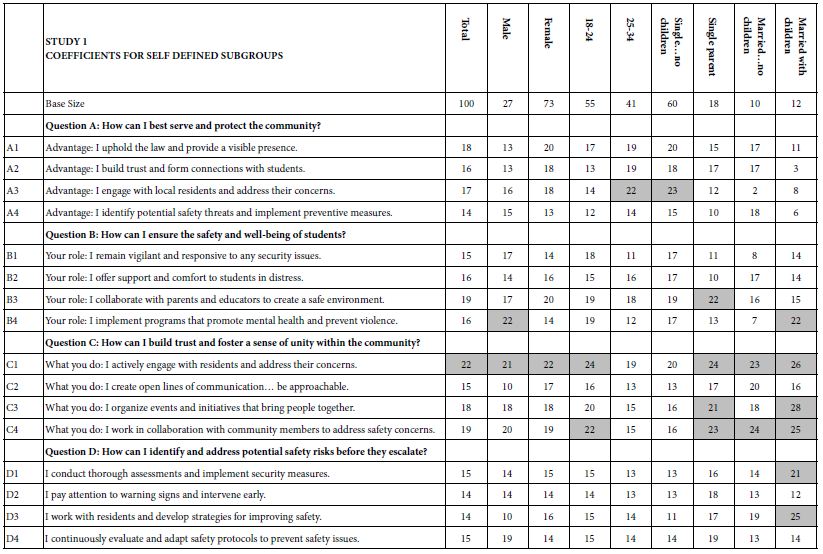
When we look at Figure 2, Panel B, viz. the sample vignette, we see that the structure of the vignette does not lend itself to “gaming the system.” There are 24 vignettes, so there is no point in expending a great deal of effort. The sheer number of vignettes militates against trying to outguess the researcher. Another aspect, namely the spare structure of the combinations, and the fact that to the untrained eye these vignettes seem to be random. Every respondent sees a different set of 24 vignettes, with the elements in the vignettes seeming to be put in or taken out by random. The respondent quickly goes into a sense of indifference and guesses, rather than focusing on being correct and pleasing the respondent and pleasing the interviewer. The respondent participating on a computer simply proceeds, going through the evaluation. As noted above, the OLS (ordinary least squares) regression analysis shows the driving power of the elements. Table 2, column labelled Total Panel, shows the 16 coefficients for the elements below. When we look at the coefficients from the total panel, we have a coefficient as high as 22, and a coefficient as low as 14. Only one element moves beyond the pre-set criterion of coefficient C1 — What you do: I actively engage with residents and address their concerns. The remaining columns show the other groups, gender and age. Respondents not appropriate for the secondary requirements (viz., age outside the allowable range) were not considered for specific analyses, but were included in the Total Population, and in the self- profiling classifications about marital status and children. Once again, we see relatively few elements which score strongly. Only Element C1 scores consistently strongly. To make interpreting easier, keep in mind that the numbers in the body of the table are coefficients from regression. They can also be interpreted as “the increment percent of people who, reading this element, will say I will join.” Also keep in mind that we would like strong performing elements. Looking now at the Total Panel, we find that C1 has a coefficient of 22. This means that when element C1 appears in a vignette (What you do: I actively engage with residents and address their concerns), we get 22% more people saying, “I would like to join.” On the other hand, when we put in A4 for whatever reason (Advantage: I identify potential safety threats and implement preventive measures), only 14% say they will join. That’s about 2/3 as many. We clearly would want to put in Element C1. Verbalize results — look for opportunities — by looking down within a group, and across groups. The numbers can all be compared to each other, and added together, at least up to four elements, no more than one element from a question. The sum provides us with a sense of the likely percent of respondents who say they will join. The consequence of this analysis is a powerful tool to understand, and to compose, all done in a matter of hours.
Table 2: Coefficients for the 16 elements for Study 1, for Total Panel, gender, age, and self-profiling status of marriage and children.
Thinking Differently at the Granular Level of Everyday Life — The Challenge of Mind-Sets
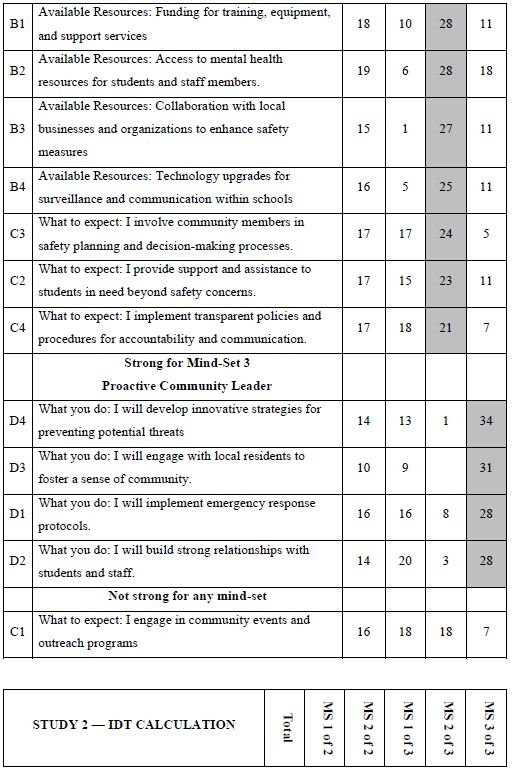
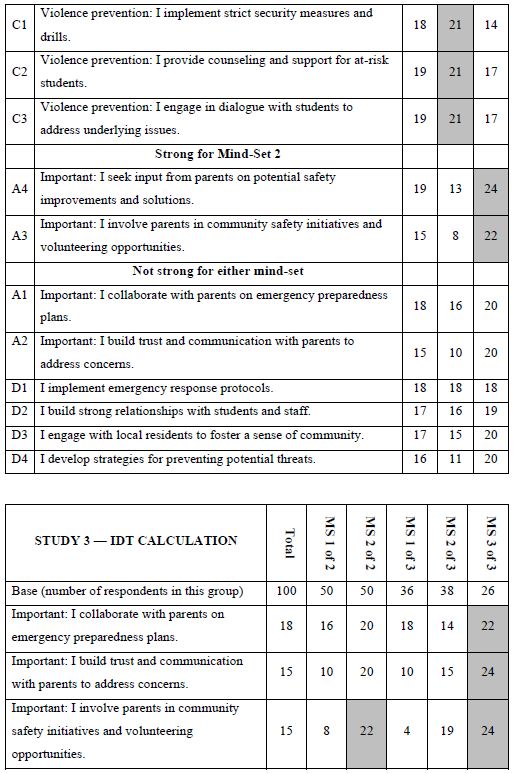
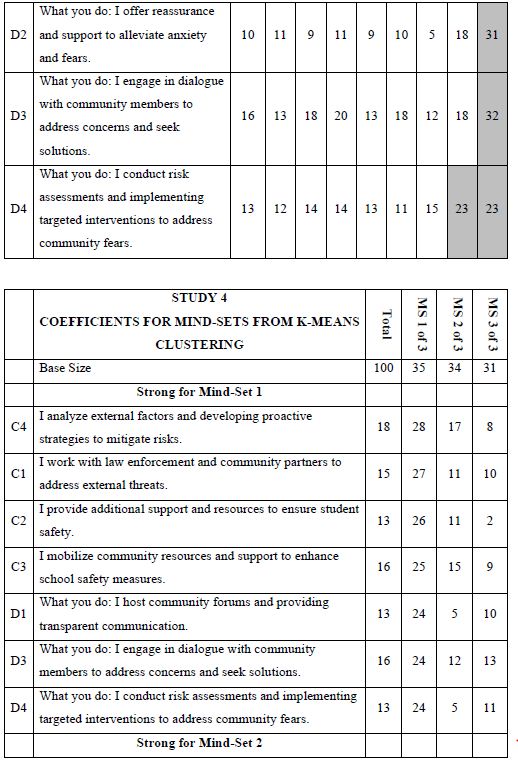
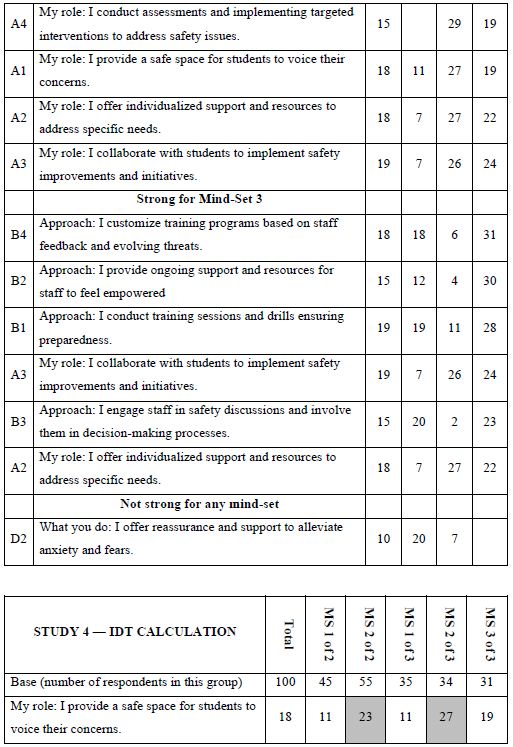
One of the hallmarks of Mind Genomics is this belief that in every area of everyday life, people differ in the way that they deal with the objectives, the goals, the messages. These are not the major differences in people, but rather everyday differences which are systematic, repeatable, and useful for things as different as medical advice and advertisements for shopping. The approach to find these so-called mind-sets, these differences in the way we approach issues, is very straightforward. Recall from above that we have regression analysis for each of our 100 respondents who saw the 24 combinations. So instead of doing the analysis at the level of all 100 people pooled together, let us do the regression analysis for each one of our 100 people, and let’s store 100 sets of the 16 coefficients in a database. When we do that analysis, we end up with 100 different models, 100 rows each with 16 columns. Each row is a respondent, one of our 100 respondents. The numbers are the coefficients estimated from the individual-level regression analysis. That difference is not based on who the people are, but rather on how the people respond to specific, relevant messages describing a small aspect of daily life. In other words, we are not interested in who people are, what they do, but how they think in a very local granular situation. There are a variety of metrics, ways to quantify the dissimilarity between respondents. We use the measure of distance between pairs of respondents, based upon the correlation of the coefficients. The distance between pairs of respondents is defined (1 – Pearson Correlation), computed on the corresponding pairs of the 16 coefficients. When the 16 coefficients of one respondent correlate perfectly with the 16 coefficients of another respondent, they are defined as having 0 distance. When the 16 coefficients of the two respondents describe opposite patterns, their distance is +2. We do not supervise the program. We simply allow the program to come up with these groups so that the patterns of the respondents within a group, within a cluster, are very similar, but the averages of the cluster on the 16 elements are very different across the three mind-sets. When we do the analysis, we find that the strongest result emerges when we ask the clustering program, the K-means clustering program, to create three groups. The bottom line is that even without intellectually thinking through the study, the regression analysis and clustering end up with radically different interpretable groups, as shown in Table 3. The important thing here is that the clusters are interpretable, the coefficients are very high, and it makes sense. What’s also important is that the coefficients are high for one group and reasonably low for the other group. We are really dealing with different mind-sets, responding to different messages as motivators. The important thing for this study is that the generation of these elements by artificial intelligence, Strategy 3 in the companion paper, with slight editing, ends up showing remarkably different types of people, suggesting the power of artificial intelligence revealed by human responses in a situation where respondents can game the system.
Table 3: The performance of all elements in Study 1, for Total Panel and for the three mind-sets generated by k-means clustering (MS1, MS2, MS3). Strong performing elements are shown by shaded cells.
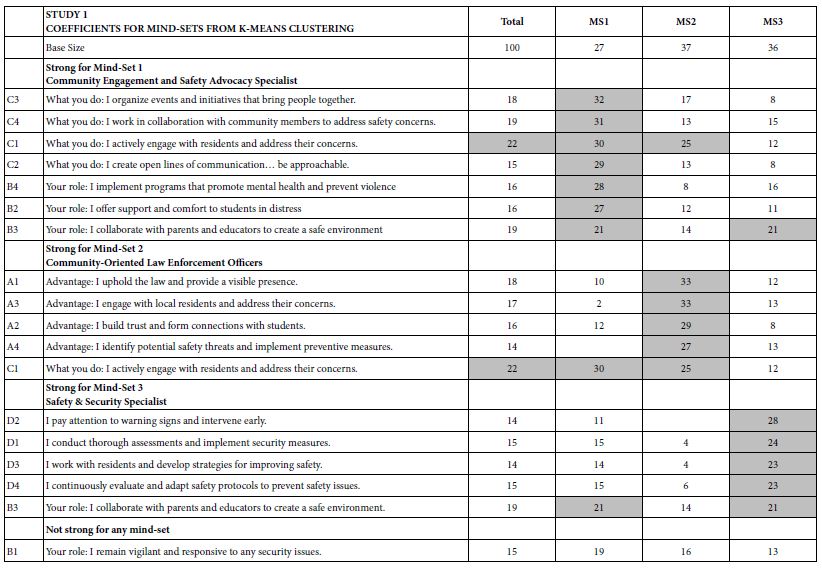
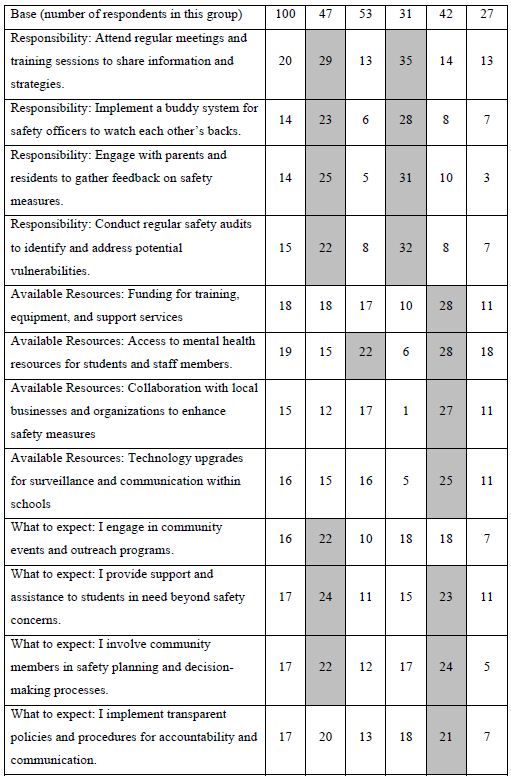
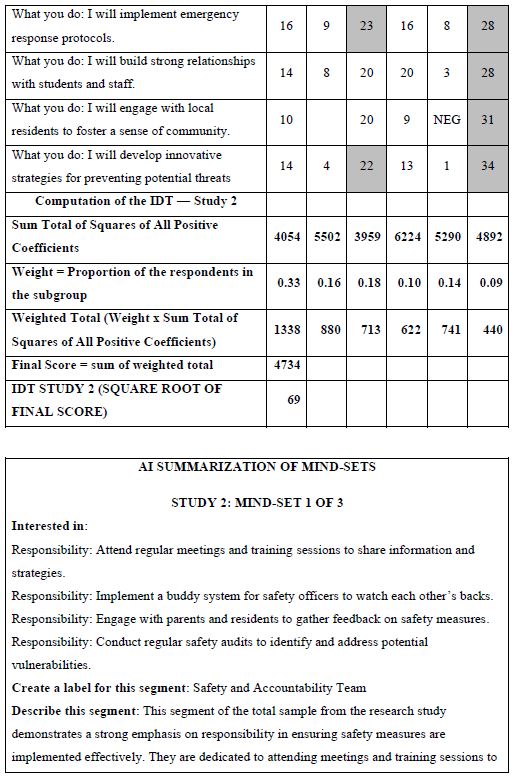
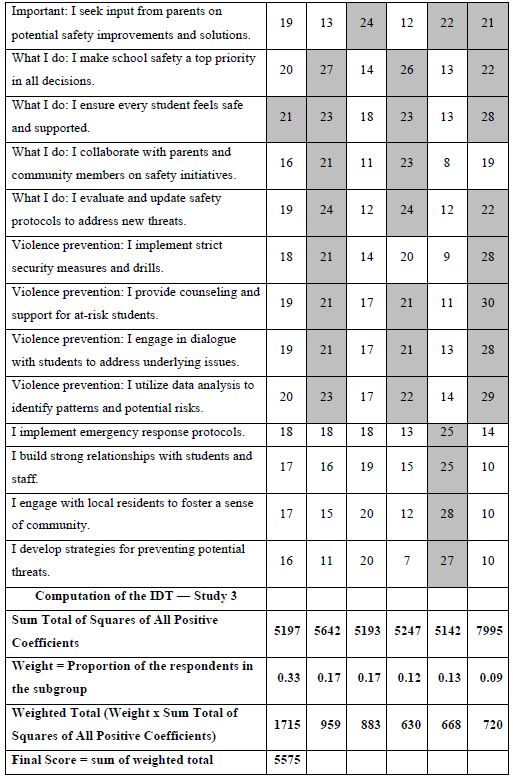
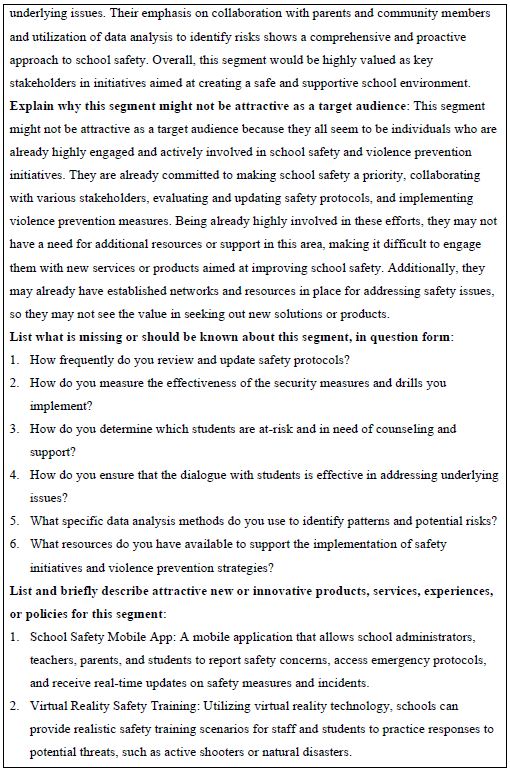
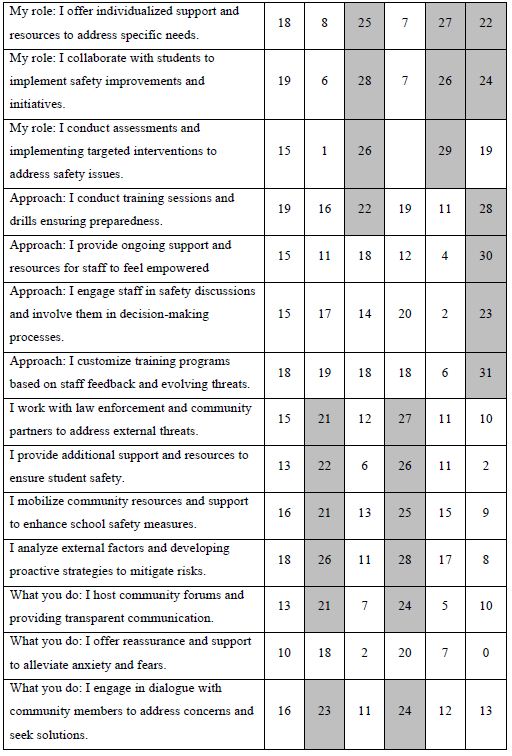
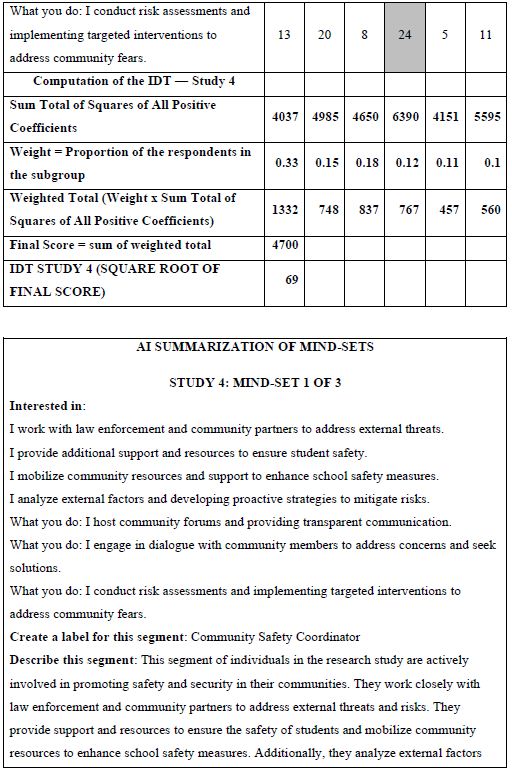
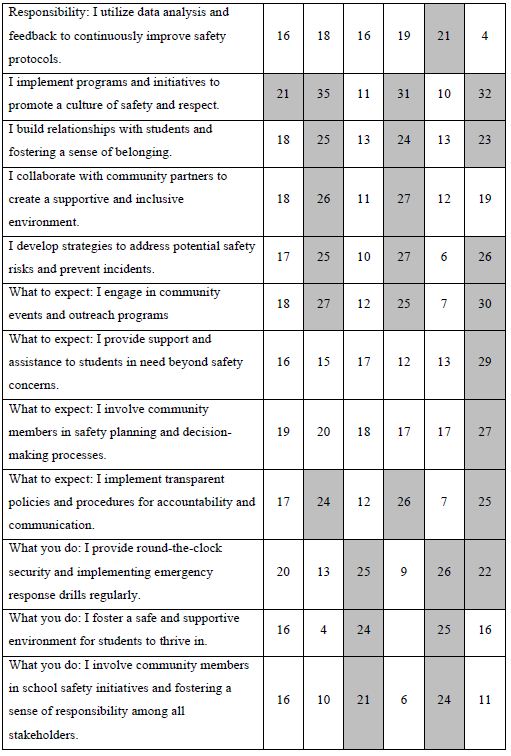
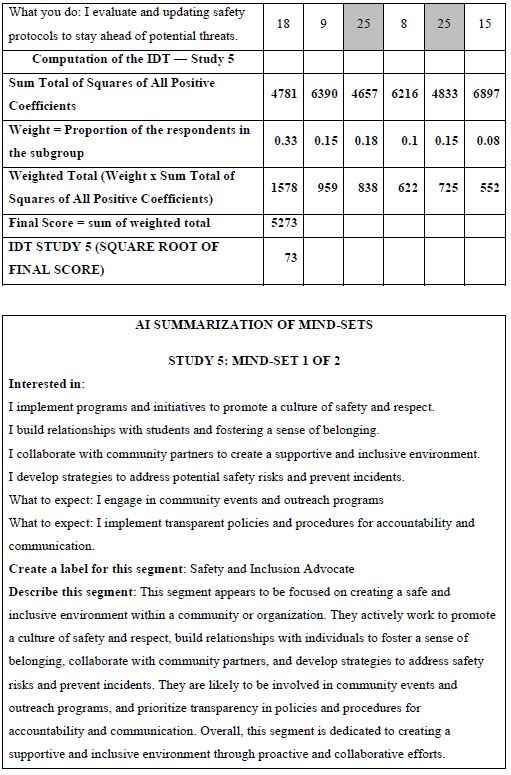
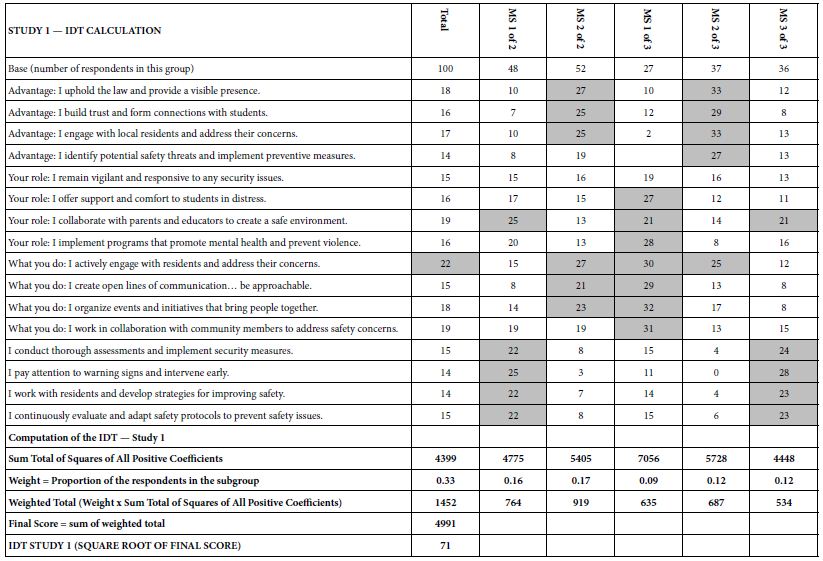
How do we know that the clustering produces real mind-sets? This is an important question. The goal in Mind Genomics is to discover truly different ways of thinking about the same topic. Two factors come into play. One fact is that the data should show elements which have high coefficients, with these elements “telling a story.” The other is that the data should show elements which have low coefficients. It is not sufficient to generate high coefficients everywhere. That would show better elements, but not show radically different mind-sets. In recent studies, the authors have introduced the index called IDT, Index of Divergent Thought. The IDT is a way to show the net effect of the two forces: high coefficients for some sets of interpretable elements, and low coefficients for the other elements. Table 4 shows the computations. Simulations of data sets showing high coefficients for elements relevant to the mind-set and low coefficients elsewhere suggest that an IDT around 70 is best. The data in Study 1 suggest an IDT of 71, almost perfect.
Table 4: The data for the IDT (Index of Divergent Thinking) and the calculations.
Using AI to Summarize the Results, Considering Only the Strong-Performing Elements
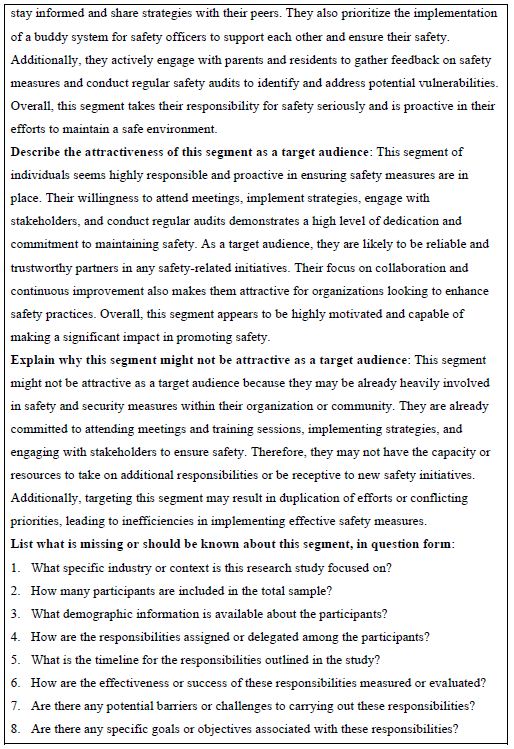
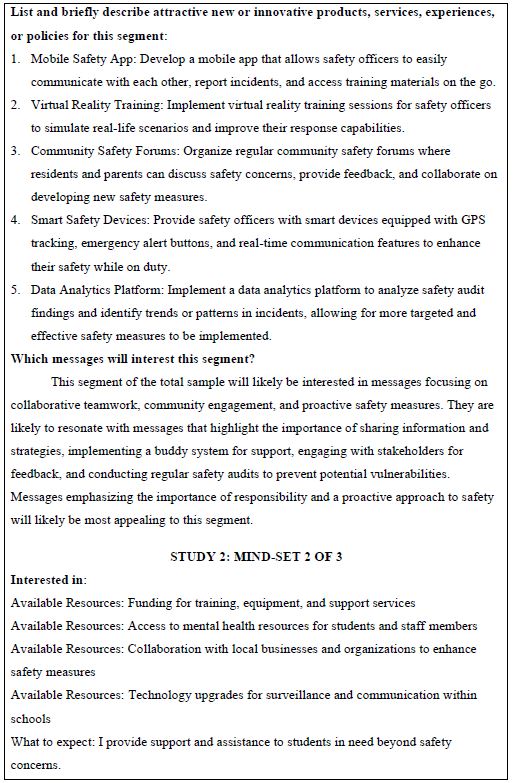
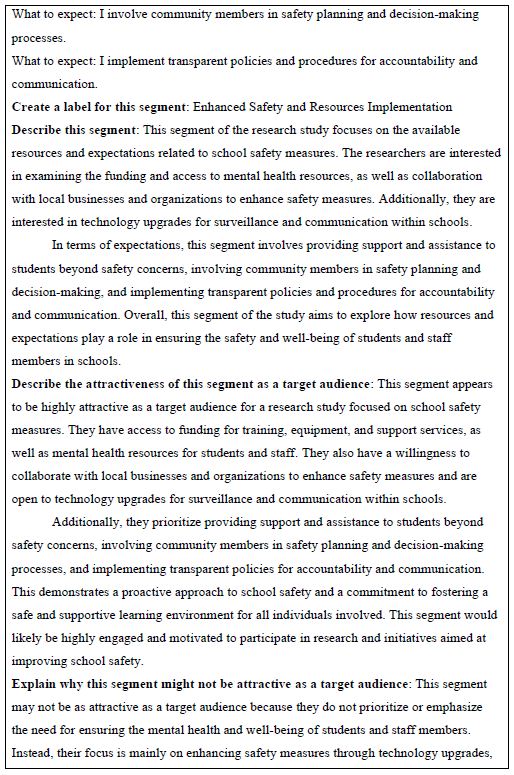
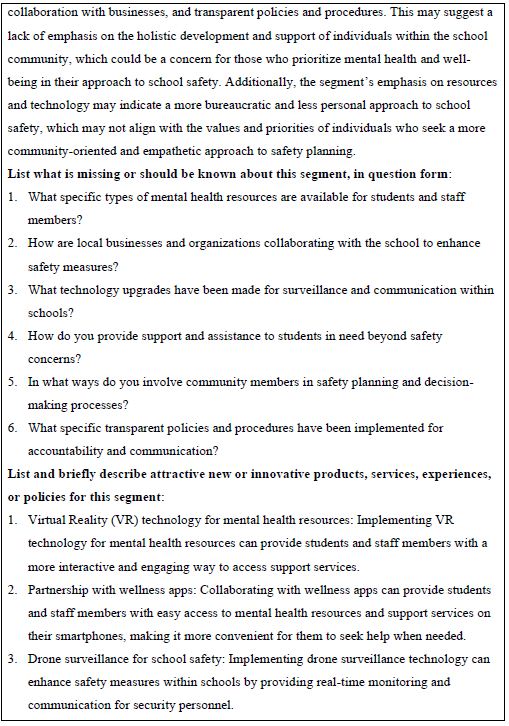
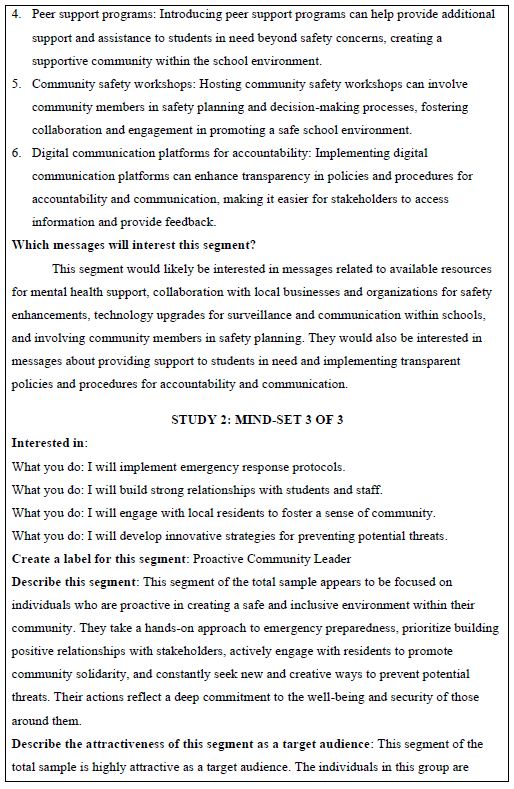
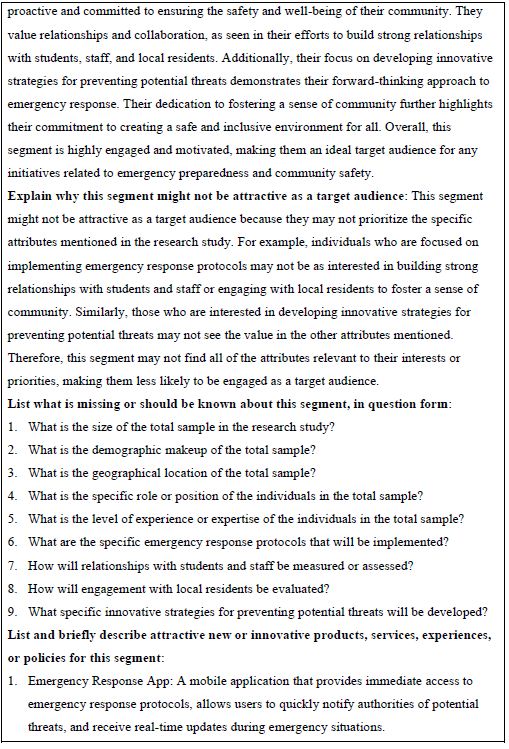
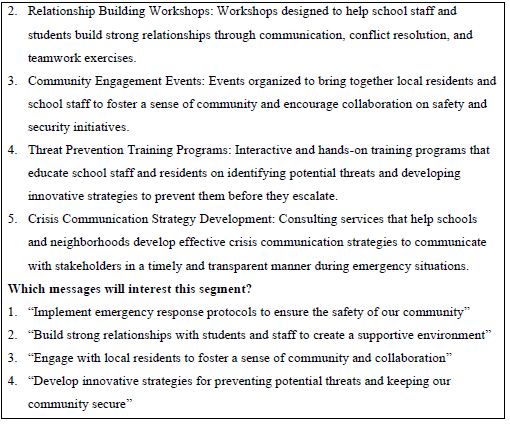
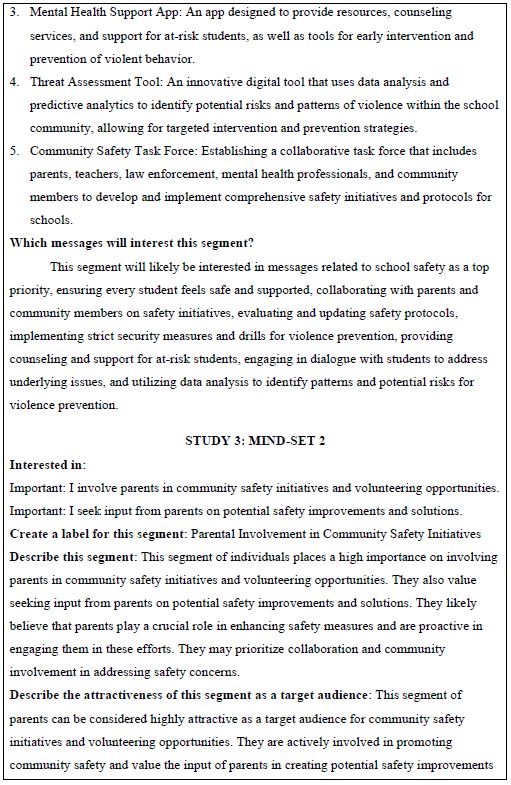
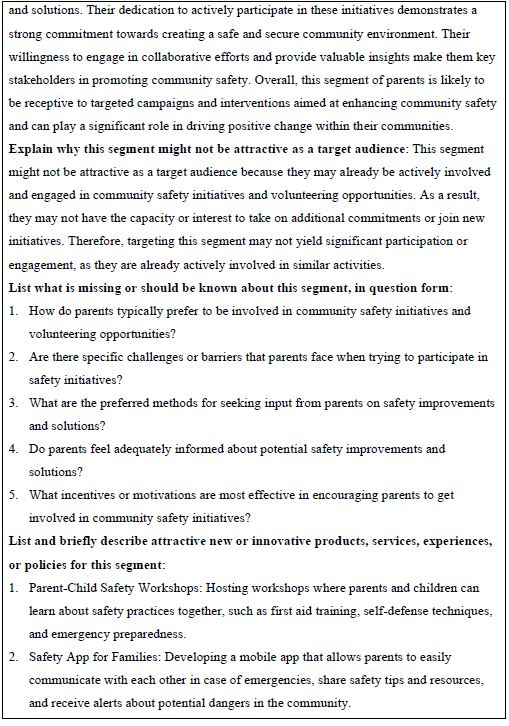
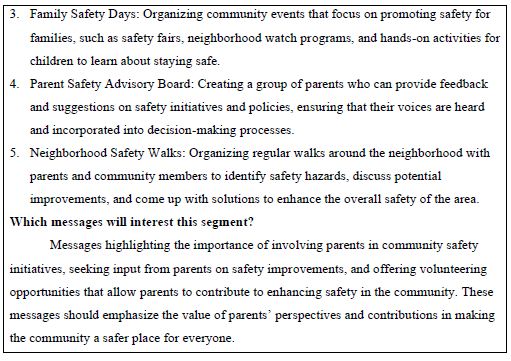
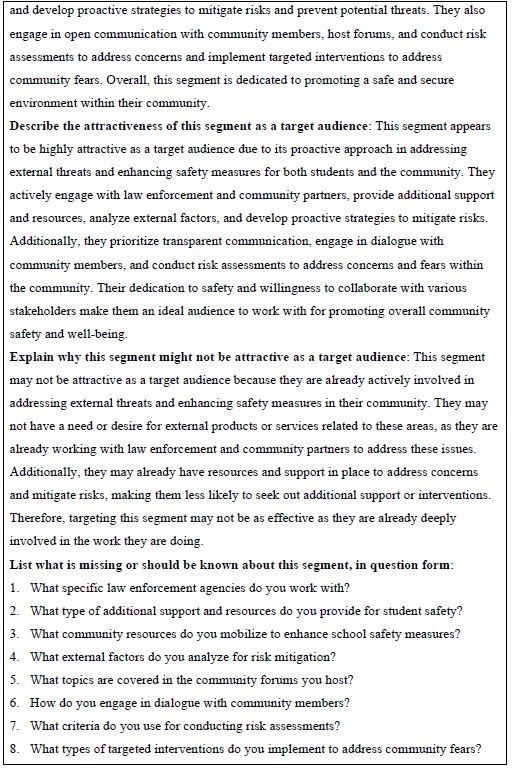
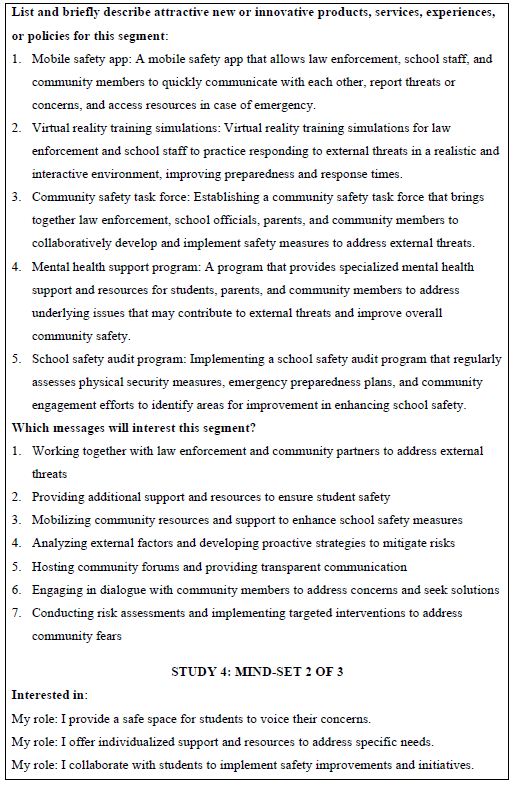
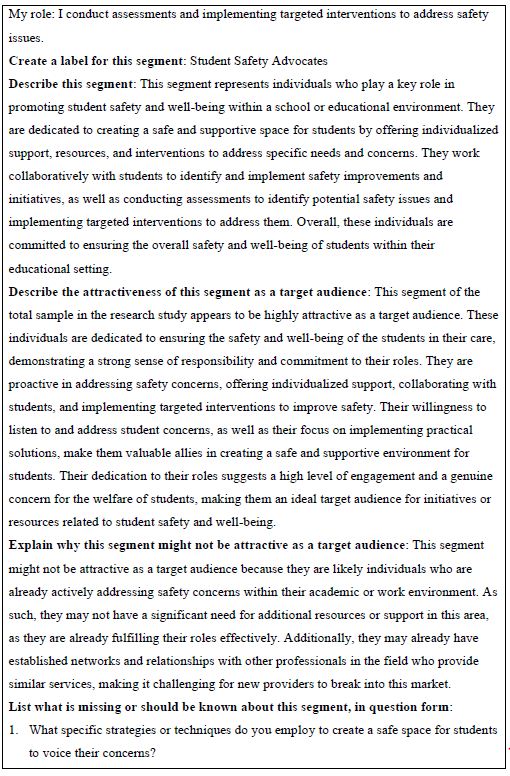
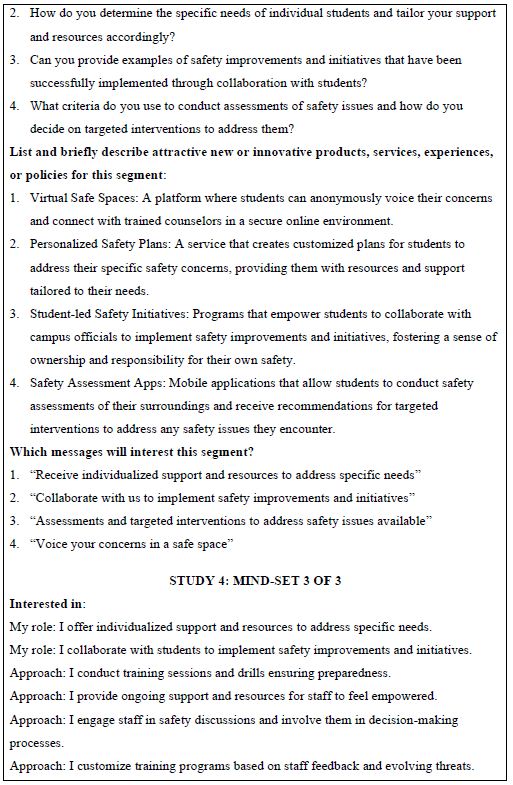
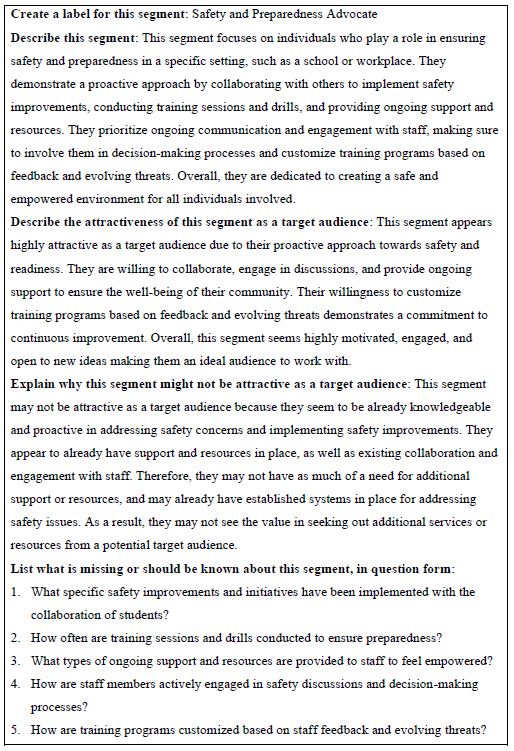
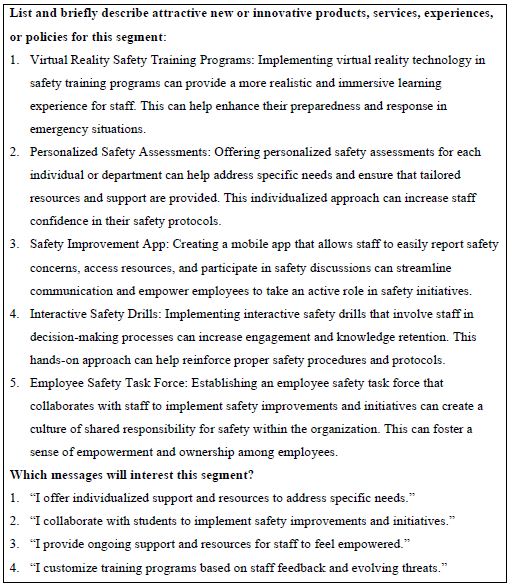
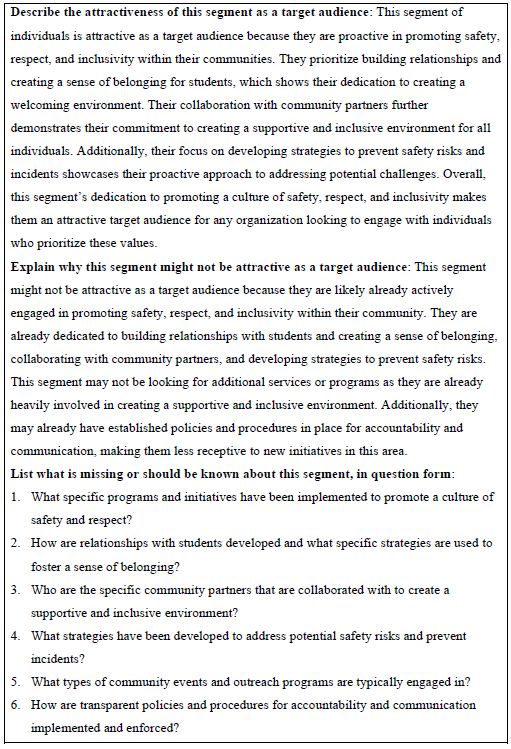
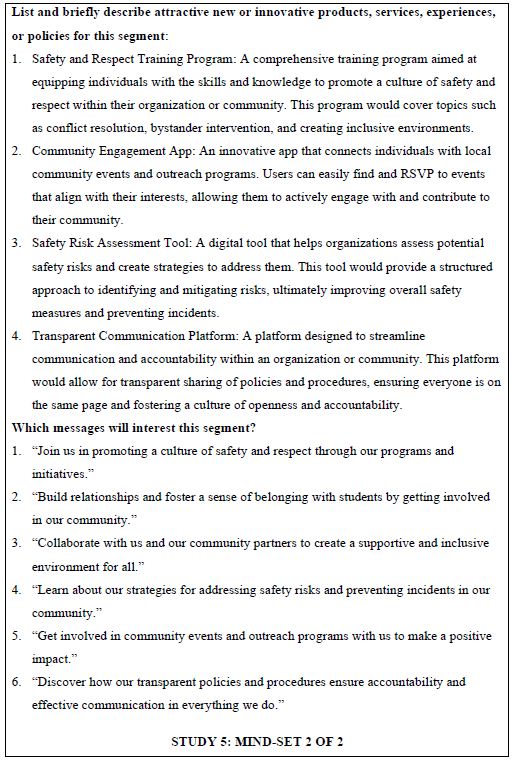
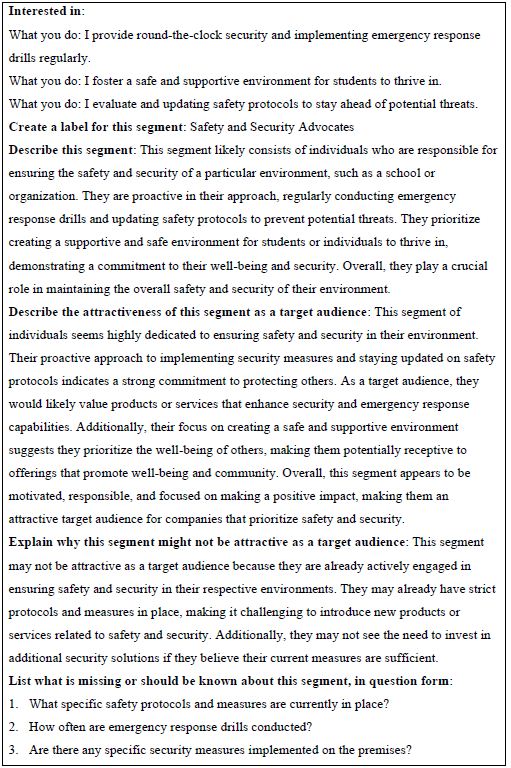
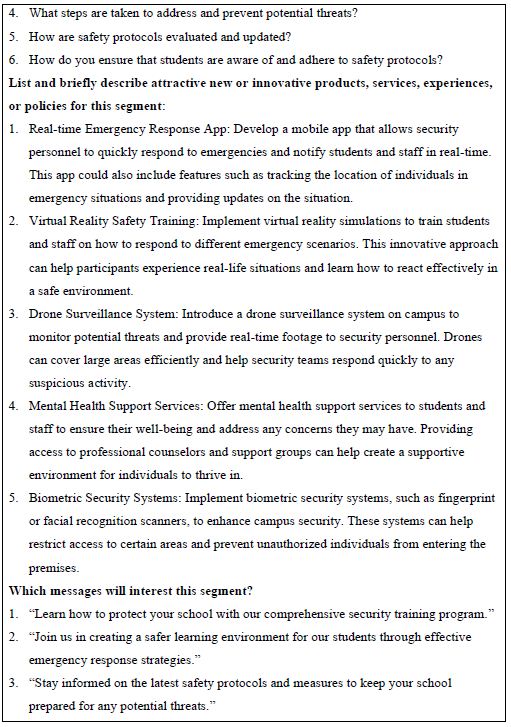
The final analysis in this study deals with how AI analyzes the results and the strong elements for each mind-set. These appear in Table 5. The notion here is that AI can act as a second pair of eyes, as a coach, as an interpreter of the results. The table is laid out in the form of a set of questions to be answered for each mind-set, based upon the pattern of elements scoring 21 or higher for that mind-set. The questions themselves range from a summarization of the mind-set, the elements which perform strongly, and then onto questions about innovations and messaging.
Table 5: AI summarization of the key findings and opportunities for each mind-set, based upon the patterns generated for strong performing elements for that mind-set.
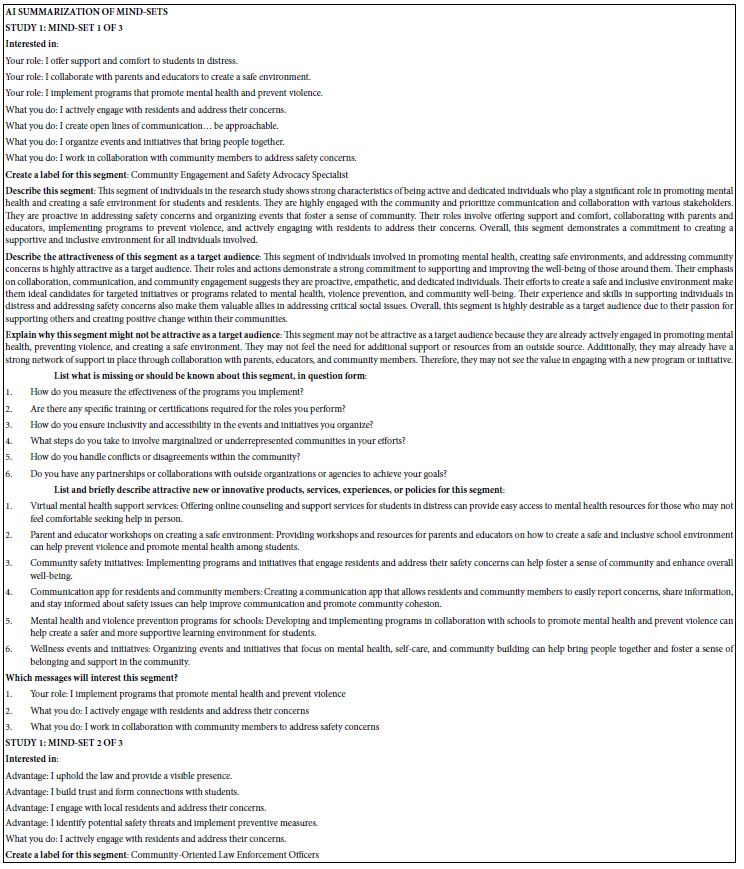
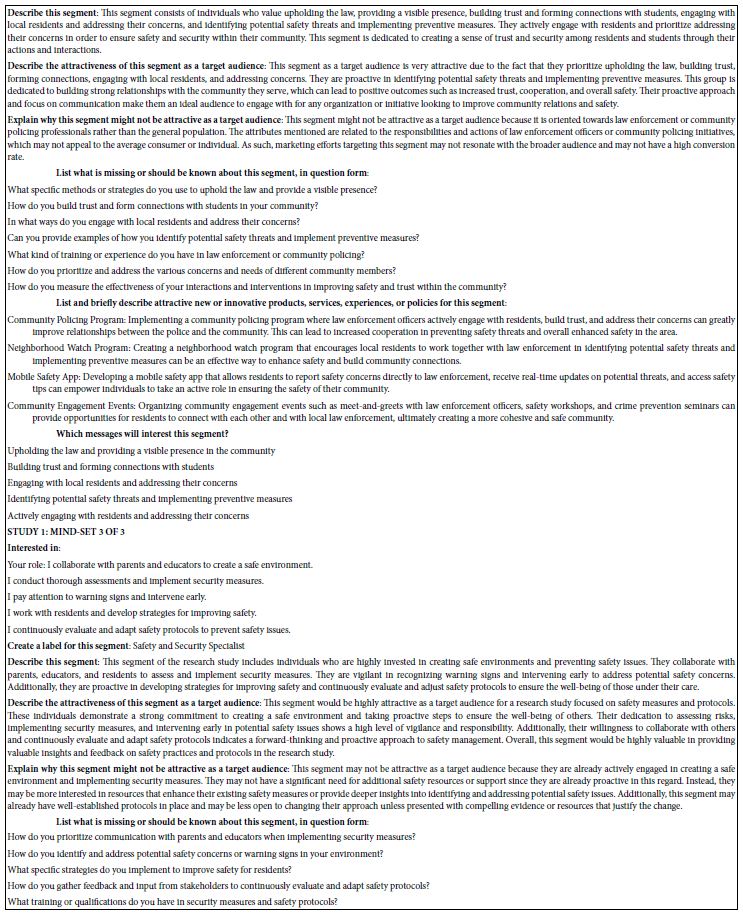
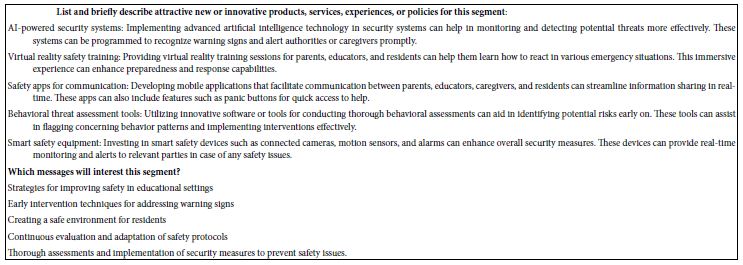
The questions are answered automatically, once the study is completed. The results here are done automatically, provided at the end of the study, within 30 minutes. In the interest of standardizing our understanding, the questions are fixed, answered in every Mind Genomics report, for key groups, including Total Panel, Self-Profiled Groups (e.g., gender), and mind-sets such as the three mind-sets reported here. Over time, it is straightforward to update the Mind Genomics platform, BimiLeap, so that the platform becomes even more complete, recognizing only that the updated platform will be used for every report and every key subgroup within the report.
Discussion and Conclusions
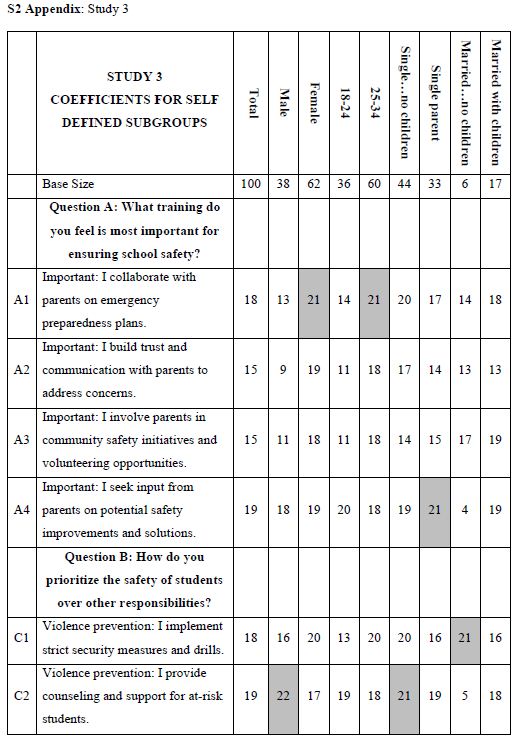
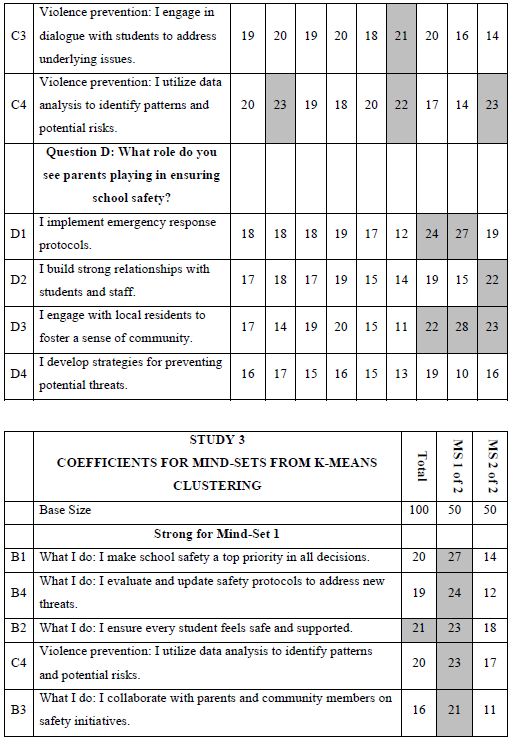
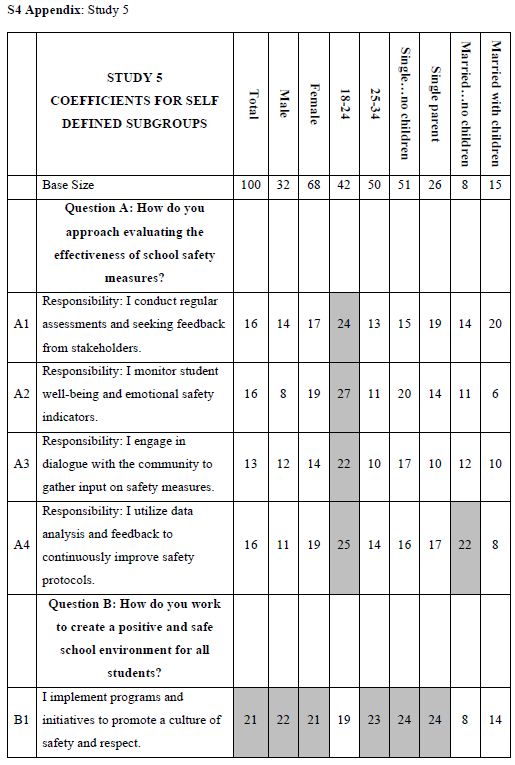
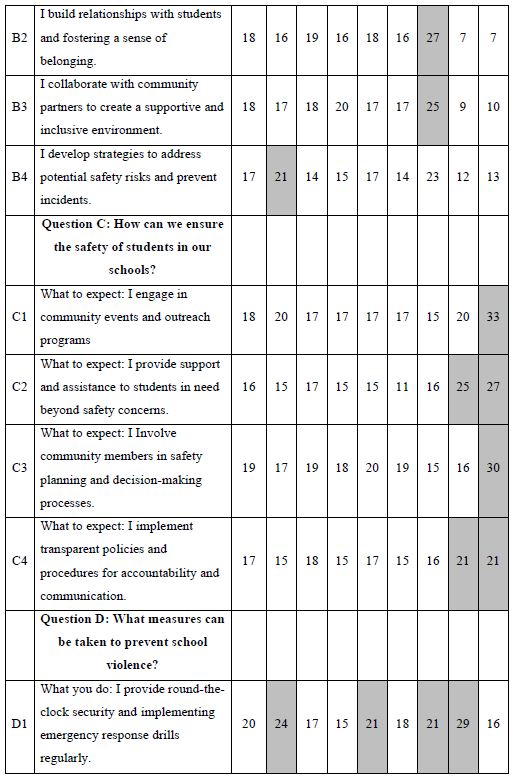
The data presented in this paper, in Study 1 above, and in Studies 2-5 in the appendices, suggest that we are only beginning to see the fruits of an AI which can help us to solve practical problems about recruitment and similar issues in a way never before possible. It is important to note that the study ran here, this first study, emerged from the questions and the answers generated by AI. Mind Genomics began to incorporate AI in 2023, typically to solve the problem of researchers “freezing” at the task of developing questions and then answers to those questions (so-called elements). The early work was so successful that it led to the incorporation of AI in the form of Idea Coach. It was with the exploration of AI beyond requesting questions and answers that the power of AI would emerge even more forcefully. The companion paper demonstrated the possibility of creating questions about a topic, and then different answers to the same question, those answers provided by AI-synthesized mind-sets. Everything, therefore, was under the control of AI, which moved from a coach to “unfreeze the researcher” into a true researcher, one almost independent of the human researcher. If we were to summarize the importance of this paper and of the companion paper, we would probably come out with the idea that we have now a tool, which in a very short period of time, hours and days, can produce information both in a deep way from generative AI and from actual people responding to the relevant stimuli as AI considers them to be. The consequence is the promise of increased expertise in the field for the professional, and an increased ability to learn how to think critically for younger students. We are sitting here on a cusp now, where learning through the computer can be made targeted, fun, quick, easy, and even gamified with the results from the Mind Genomics experiment. The simple fact that all of the material presented here was done in less than one week (really 5.5 days), starting from absolute zero is witness to the fact that we are on the cusp of an intellectual revolution, where information, validated information, about issues related to people can be dealt with quickly, both in terms of quote library type research through AI, and then human experiments.
Acknowledgment
The authors would like to thank Vanessa Marie B. Arcenas and Isabelle Porat for their help in producing this manuscript.
Abbreviations
AI: Artificial Intelligence, ChatGPT: Chat Generative Pre-Trained Transformer, IDT: Index of Divergent Thought, LLM: Large Language Model, OLS regression: Ordinary Least Squares regression
References
- Jahja E, Papajorgji P, Moskowitz H, Margioukla I, Nasto F, Dedej A, Pina P, Shella M, Collaku M, Kaziu E and Gjoni K (2024). Measuring the perceived wellbeing of hemodialysis patients: A Mind Genomics cartography. Plos One 19(5): e0302526. [crossref]
- Porretta S, Gere A, Radványi D and Moskowitz H (2019) Mind Genomics (Conjoint Analysis): The new concept research in the analysis of consumer behaviour and choice. Trends in Food Science & Technology 84: 29-33.
- Radványi D, Gere A and Moskowitz HR (2020) The mind of sustainability: a mind genomics cartography. International Journal of R&D Innovation Strategy (IJRDIS) 2(1): 22-43.
- Mendoza C, Deitel J, Braun M, Rappaport S and Moskowitz HR. (2023)(a) Empowering young researchers: Exploring and understanding responses to the jobs of home aide for a young child. Pediatric Studies and Care 3(1): 1-9.
- Mendoza C, Mendoza C, Deitel Y, Rappaport S, Moskowitz H (2023)(b) Empowering Young People to become Researchers: What Does It Take to become a Police Officer? Psychology Journal: Research Open 5(3): 1–12.
- Mendoza C, Mendoza C, Rappaport S, Deitel J, Moskowitz HR (2023)(c) Empowering young researchers to think critically: Exploring reactions to the ‘Inspirational Charge to the Newly-Minted Physician’. Psychology Journal: Research Open 5(2): 1-9.
- Mendoza C, Mendoza C, Rappaport S, Deitel Y, Moskowitz H (2023) Empowering Young Students to Become Researchers: Thinking of Today’s Gasoline Prices. Mind Genom Stud Psychol Exp 2(2): 1-14.
- Gofman A and Moskowitz H (2010) Isomorphic permuted experimental designs and their application in conjoint analysis. Journal of Sensory Studies, 25(1): 127-145.
- Messinger S, Cooper T, Cooper R, Moskowitz D, Gere A, et al. (2020) New Medical Technology: A Mind Genomics Cartography of How to Present Ideas to Consumers and to Investors. Psychol J Res Open 3(1): 1-13.
- Dubey A and Choubey A (2017) A systematic review on k-means clustering techniques. Int J Sci Res Eng Technol (IJSRET, ISSN 2278–0882) 6(6).


