Abstract
We introduce a novel approach to understand how people feel about new technologies, doing so in a short, easy-to-implement experiment. The objective is to understand public sentiment regarding current problems and current solutions to problems. The approach measures both the emotional appeal and the rational appeal of a situation and solutions, using a newly emerging science, Mind Genomics. Respondents evaluate combinations of messages (vignettes) about problems and technological solutions to these problems, rating the vignettes on a scale which intertwines emotional appeal (believe) with economic appraisal (invest). The analysis of the data sheds light on how a person feels about different aspects of the topic, without the person being able to ‘game the system.’ The approach contributes both to consumer research and to behavioral economics.
Introduction
The world of finance and now the off-shoot, behavioral economics, is filled with studies about why people invest; the information they use, the interplay of emotions and rational information [1]. One need go to any newsstand to find copies of the daily bible of Finance, the Wall Street Journal, the Financial Times, or the weekly Barron’s to read about investment motivations. There are many such publications, not to mention the myriad of financial publications devoted to a sector, the ongoing chatter about sectors and stocks to be found on the Internet. And, of course there are the studies regarding how decisions are made, for example, comparing genders, ages, experience, cultures, and so forth [2-5].
Given the plethora of information readily available, almost metaphorically like the water coming from a fire hydrant, what then is left? A scan of the different available sources shows very few methods for the average non-technical person to understand a category. This does not mean understand the category from a technical point of view, or predict growth based on a full assessment of the market. That information is hard to obtain and is usually provided as part of a compensation for service. Rather, we mean something simpler: how does one find out about the feelings towards the ‘common knowledge’ floating around in the blogosphere, the news outlets, and even casual conversation? Is there a way to learn about what people think regarding a topic, perhaps in preparation for investing?
Moving from Knowledge to Structured Measurement of Knowledge and Feeling
During the past two decades, author HRM has explored different ways to understand the mind of people. By ‘the mind’ we mean the way we make decisions when confronted with the problems of the everyday, the quotidian aspects of our existence. Furthermore, effort known as Mind Genomics has evolved from understanding how people value different messages about a product or service [6], and on to the value of messages about social issues. Finally, the efforts during the past 20 years since the start of the 21st Century have focused on making the Mind Genomics project into a simple-to-use, affordable, and time-efficient, resource-efficient approach. Examples including focusing on small sets of stimuli that can be generated in less than 20 minutes, creating individual-level models, producing new-to-the-world discoveries (mind-sets), and finally creating the entire effort in a single APP that can be used worldwide.
The history of Mind Genomics is relevant to our topic, which is creating a ‘cartographic map’ of the mind with respect to a topic. The idea underlying our effort is to produce tables which immediately show important facets of the data, tables which themselves can be associated with relevant statistics analyses, but which are also instructive in and of themselves.
Before launching into the actual study, it is helpful to look at the way science is done today [7]. There is an emerging literature talking about the way science works. While much is written about motivators in professional-commissioned science, especially academic-based science, coming from important of multi-disciplinary and cross-disciplinary work, in practice, there is a separate reward structure driving the choices. The reward structure is driven by grants (funding the science), academic job security (tenure), and the need to publish papers in discipline-based journals with a high ranking. The result is that it is ‘risky’ for a young and mid-career researcher to do small-scale studies, cartographies of a topic world of Mind Genomics. Interesting new ways of looking at data, ways that have not been accepted for years by the highly thought-of society journals, simply do not get published. It is in this spirit of exploration of a new topic, to see ‘what’s there,’ which motivated us to explore the issue of wind power in an empirical behaviorally relevant scheme (would you believe, would you invest), and then see what emerges. There is no building on basic theory, although the study could be narrowed down substantially, and a small part of the topic could be explored in the light of ‘theory,’ to plug a ‘hole in the literature,’ but that would defeat the purpose of the study.
This paper deals with the application of this cartographic mapping of the mind, to a specific topic, the benefit of wind power for energy [8]. We are interested in what is important to people and what is not important to people. Issues such as ‘importance’ can be addressed by various tools, such as questionnaires which become rating exercises, statistical methods such as Max-Dif which play the elements against each other, and so forth. Focus groups can be used to investigate at deeper, more qualitative level to understand ‘emotions,’ or a dyad could be created with the respondent and an interviewer, to engage in an in-depth interview. All of these methods are currently being used, with some results appearing in the public literature, but many more buried in the data banks of corporations sponsoring the research.
The rationale for the specific selection of the current topic is the interest of the authors in the topic of wind power, and especially new technologies involved with the turbine. The focus on wind power also accords with the increasing interest in climate and sustainable energy by world bodies such as the United Nation, by governments, by companies, and of course by investors [9-13].
There is a growing body of literature on wind power, but little in the way of understanding the minds of the consumer faced with information. Google can count the number of citations for wind power, in total, by year, with focus on specific aspects, but there is no sense of what messages work and convince, what messages do not work, and what messages try to alarm but are quickly passed over. The Mind Genomics effort in this paper addresses those issues, presenting a scalable way to include them.
The Need for Fast and Affordable Understanding
Today’s scientific enterprise is increasingly focused on studies with ‘star power,’ defined as getting attention and getting grants. The result of the reward system for science is the focus on speed, on impact (getting other people to cite one’s work), and on the inevitable change of behavior to produce papers that will pass the peer-review systems and get published in high-impact journals. The consequence is a decrease in the frequency of papers set up to ‘explore’ a topic. Those papers simply don’t have star power.
The emerging science of Mind Genomics offers an opportunity to return to a more naïve, but possibly more interesting science. Rather than formally stating a hypothesis, Mind Genomics searches for patterns in the way we make decisions. The process is simple, the structure of inquiry statistically rigorous, and the effort generally quite productive, revealing new to the world mind-sets, ways of thinking about a topic [6,14-16].
We present the application of Mind Genomics to an issue which arose in 2020, the opportunity to create a new wind turbine. Rather than looking at the science per se, we approached the topic as if we were interested in the types of messages that would be impactful to the ordinary person who ‘invests.’ The emerging issue was ‘what specific messages are believed, and what specific messages would lead a person to want to invest?’ The result was that very quickly (in hours), we gained new understandings about the minds of people in relation to wind-power investment and helped identify what effectively persuades people and what does not. The paper fits into the evolving science of behavioral economics, including topics related to finance and psychology, respectively [17-19].
The Process
The templated Mind Genomics process is set up to allow anyone to do the experiment. The important contribution here is that the focus becomes the quality of the thinking, and not the technical proficiency of the research.
The template, instantiated in a website (www.BimiLeap.com), follows a specific sequence, beginning with the ideas, then the inquiry, and finally an optional request for an open-ended answer. We follow the template in this paper, to show the input and then review the results
Step 1 – Test Stimuli
The study begins with the selection of a topic, the instruction to provide four questions which ‘tell a story,’ and then the instruction to provide four ‘answers’ for each question, or 16 answers in total. Table 1 shows the four questions and the four answers (elements). Figure 1 shows an example of the set-up slide.
Table 1: The four questions and the four answers (elements) to each question.
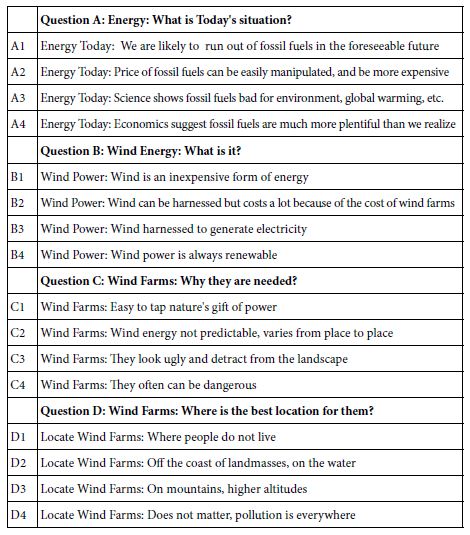
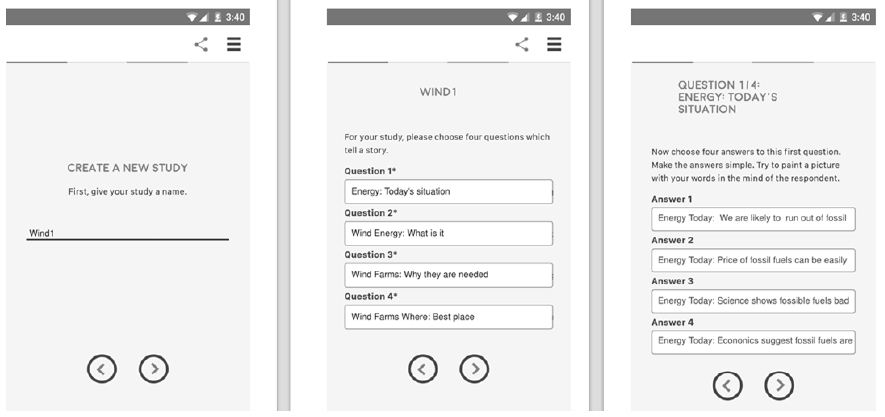
Figure 1: The Set-up screens for the study showing the portion devoted to the stimuli.
The hard part of the set up in Step 1 is to come up with four questions which tell a story. With practice, it becomes increasingly easy to frame the four questions, but the key word is ‘practice.’ People are not accustomed to telling stories. Note that we will use the term ‘element’ instead of answer. The respondent will never see the questions, only the ‘elements,’ and so has no idea that these originally were ‘answers to questions.’
From the authors’ experiences with Mind Genomics, the same patterns of thinking emerge when users begin to become experimenters. As noted above, the first few experiences as a Mind Genomics researcher force the novice to think about the topic in a different way. Novices usually are not forced to think in a structured manner, deconstructing the topic into different parts, and then focusing on each part (question), one at a time. Rather, it appears that the educational system has pushed people into coping with the entire topic, often times frustrating people who are trying to understand the topic, especially when the topic is new to them. Mind Genomics teaches the novice researcher a new way, akin to ‘divide and conquer,’ or ‘deconstruct and understand.’
Step 2 – Personal Information, Introduction to the Issue, and the Rating Scale
Step 2 allows the respondent to profile herself or himself, in terms of gender, age, and a third question. This self-profiling will occur at the very start of the experiment (or survey) right after the respondent agrees to participate. As yet, the respondent has no idea about the topic of the experiment. The respondent is asked to provide age, gender, and to answer a third question structured by the researcher.
Preliminary Question: How do You Feel About the Environment and Energy?
Possible answers: 1= Don’t think much about its 2=Concerned 3=Activist.
The orientation to the study follows immediately. The orientation to the study is kept short, deliberately, in order to ensure that the ratings assigned by the respondent are driven by the elements. The entire orientation is shown below. Note the simplicity. The topic is not even specified, just the relevant information. The actual topic motivating the effort was the creation of a new turbine. The study is not about that turbine, but rather about the deeper concerns about energy, and specifically wind power. At the same time, it was important to avoid emotional and politically correct answers. Based upon previous experience with these types of emotionally charged topics, the questioning framework was transformed from how one feels (homo emotionalis), to a how one would invest,—a more rational judgment, but still tinged by feeling (homo economics). Homo economicus tends to be more restrained, invoking both rational and emotional elements, akin to System 2 of judgment making posited by Nobel Laureate [18].
We are interested in whether you believe strongly in what you read and if it were available as part of an offering, would it make a good investment for people, (whether or not you personally believe it)
1=NO way,
2=BELIEVE-NO, INVEST-NO 3=BELIEVE-YES, INVEST-NO
4=BELIEVE-NO, INVEST-YES 5=BELIEVE-YES, INVEST-YES
Figure 2 shows the set of three screens used by the researcher to set up the interface with the respondent. The formatted approach is deliberately simplified, with no added ‘bells and whistles.’ This simple format allows the researcher to become comfortable with the template and perceive it as serious, even though it is easy to execute.
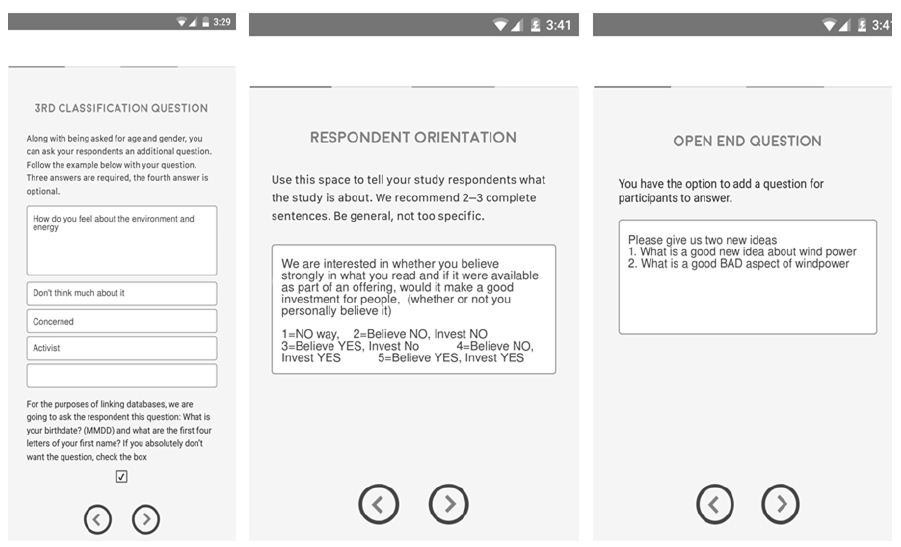
Figure 2: The template, showing the questions to be posed to the respondent. These are the classification question (at the start), the orientation and rating question for the vignettes, and the open-ended question.
Step 3 – Create the Test Combinations (Vignettes) by Experimental Design
The Mind Genomics strategy is to test combinations of elements (the aforementioned answers to questions), doing so in structured, simple-to-read vignettes. Experimental design allows the researcher to test combinations, rather than single elements (Lunstedt et al., 1998). The benefit is that the study provides more natural types of stimuli-combinations of messages or ideas—about which the respondent ends up maintaining the same decision criterion throughout. The system simply cannot be ‘gamed,’ because it is almost impossible to remember one’s answers later on, connect them with the questions (elements), and by so doing maintain the façade of consistency (getting a positive answer to the question ‘did I give the right answer?’).
The vignettes themselves appear as in Figure 3 (right-hand panel), comprising the question at the top, the elements in a combination, centered, and the rating scale at the bottom.
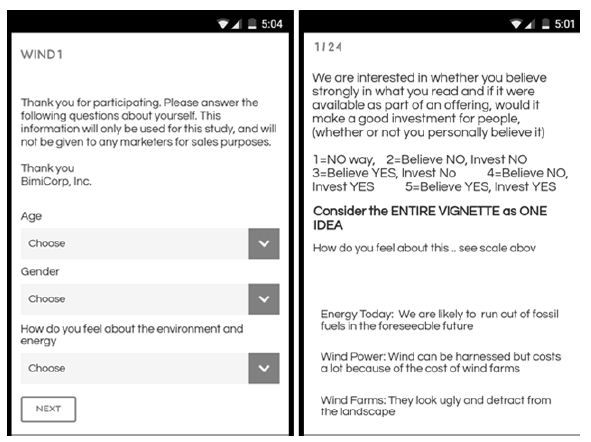
Figure 3: Example of two screens answered by respondent. The screen on the left shows the self-profiling classification, done at the start of the experiment. The screen on the right shows an example of a vignette as it appears to the respondent using a smart phone.
Each vignette comprises a specific, pre-defined combination of 2-4 elements, with at most one element appearing from a question, but often no element appearing from the question. The specific experimental design was constructed to comprise 24 combinations, each element appearing exactly five times in the 24 combinations, and absent from 19 of the combinations. Thus far we have a simple experimental design [20]. The design ensured that the 16 elements appeared in an uncorrelated manner, that the 16 elements were statistically independent of each other (orthogonal). In this way, one could present the combination to a respondent or to many respondents, tally the ratings, and use OLS (ordinary least squares) regression to relate the presence/absence of the elements to the response.
The typical research approach following the creation of this one design is to present the combinations to many people, so that the same experimental design would be used for dozens, or even hundreds of people. By averaging the data, one could reduce the variability. Averaging is appropriate for doing so. The Mind Genomics ‘way’ is dramatically different, motivated by the design to cover a lot of the design space, testing many combinations, not just 24 combinations many times. The analogy of Mind Genomics is to an MRI (magnetic resonance imaging), which takes many pictures of the underlying substance, from different angles, and then combines the different pictures afterwards, by computer, to come up with a 3-dimensional image of the underlying substance. It is only from the different angles that a more valid, representational picture, emerges. The same thinking underlies Mind Genomics. The permutation strategy [21] ensures a more valid picture of the mind, because many more combinations are judged, even if each is judged with more ‘variability.’ It is the scope of what is tested, not the reduction in noise, which makes all the difference.
Step 4 – Field Execution
The respondents were recruited to participate by an email invitation. The respondents were panel volunteers. An important thing to keep in mind is that the entire project, from inception to end of field, took less than three hours. The design portion, coming up with the topic, the questions, and the answers, as well as the orientation, and the rating scale, required 60 minutes. The actual ‘field,’ with 119 respondents participating, was completed about 90-100 minutes later, with the data analyzed by standard methods and the results presented in Excel and PowerPoint formats. This speed and affordability of the study makes it possible to create large-scale, integrated databases, for many topics of interest worldwide, virtually an empirical ‘Wikipedia of the mind.’ We present only some surface issues for a small-scale project, but one which in other methods would be large-scale, slow, ponderous, and ultimately not cost-effective.
Step 5 – Acquiring the Ratings, Transforming the Ratings, and Creating a Database
The Mind Genomics program controlled the registration of the respondent, the distribution of the test stimuli, the measurement of the response time, the acquisition of the ratings, and afterwards the transformation of the ratings, and subsequent analyses. In other words, as much as possible was made automatic, allowing the researcher to focus on the process. This automation makes the Mind Genomics process especially exciting for the novice researcher, with no experience or the professional with a little bit of experience.
The first step was to create a database of the form shown in Table 2. The left side of Table 2 shows the variables as they are encoded into the data base. On the left side of Table 2 are two columns of data, one for a 73-year-old female (panelist #69) and the other for a 53-year-old male (panelist 70). On the right are the same data but this time decoded into descriptors.
As we descend through the database, we see the standard information appearing first: information provided by the computer program when setting up the database (specifically the panelist number). Following that information are two variables (TWO MS, THREE MS). The Mind Genomics program (www.BimiLeap.com) uses the top two scale points (4 and 5) to create a new variable (Top2 to cluster the respondents into two mind-sets, and into three mind-sets, respectively. The analysis is automatic and useful for most projects. For projects where there are different possible variables on which to cluster, we will discard the automatic clustering provided by Mind Genomics and do our own.
Table 2 (right side) shows new binary variables created manually after the analysis has been completed, and the database return to the researcher. These variables are shaded. The actual analyses will be done using the four binary variables, BELIEVE-NO, BELIEVE-YES, INVEST-NO, INVEST-YES.
Table 2: Example of the data emerging from the Mind Genomics study. The left part of Table 2 shows the original variables as provided by the Mind Genomics program. The right part of Table 2 shows the table augmented manually to create new, specific binary variables which take into account the four answers, BELIEVE-NO, BELIEVE-YES, INVEST-NO, INVEST-YES.
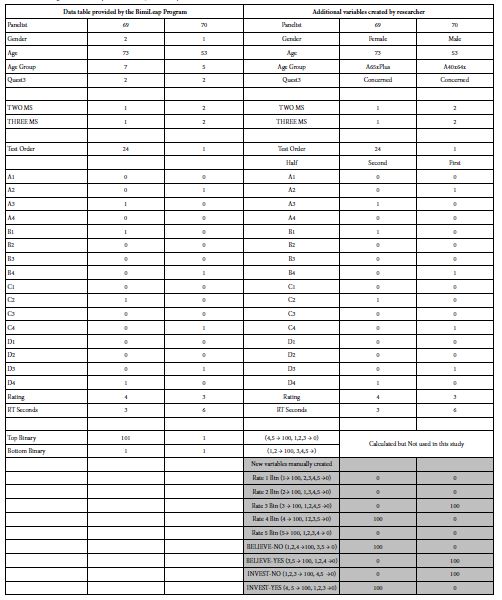
The creation of the new binary variables makes it possible to understand the relationships among the 16 elements, and both belief (or no belief), and investing (or no investing). As a prophylactic measure before OLS (ordinary least squares) regression, it is necessary that each dependent variable have some vanishingly small but actual variation. A small random number was added to each newly created binary variable, to insure vanishing but actual variation in the binary variable. Sometimes, the magnitude of the random variable was sufficient to force a 100 to become 101, or a 0 to become 1. The change does not affect the modeling, and certainly not the coefficients which emerge, calculated over hundreds of newly created binary variables.
Preliminary Analysis – Do People Lose Interest in the Topic as the Study Moves Along?
One of the variables measured by the Mind Genomics program (www.BimiLeap.com) is the response time. Good research practice dictates that we have respondents who pay some degree of attention to the topic, rather than ‘tuning out’ and answering randomly. The ability to measure the response time means that we can measure the amount of time taken by the respondent to evaluate a vignette. If the respondent does not lose attention during the course of the evaluation, we expect the respondent to spend about the same time, on average, evaluating the vignettes at the start of evaluating the 24 vignettes, as the time spent evaluating the vignettes presented at the of the study. This is, of course just a hypothesis. If the respondent loses interest in the task, we expect the respondent to assign answers at random, without reading the vignette. We expect that the response time would grow shorter.
As a respondent goes through the study, it is natural for the respondent’s attention and focus to wax and wane. It is impossible to control the respondent’s attention in a short, 2–4-minute interview. We can, however, plot the ‘raw’ response measures for each position in the set of 24 positions (the response times for the vignettes tested in position 1 vs. those tested in position 19, etc.). If the respondents stop paying attention, and simply press the button, we expect to see a faster response time at the end. Figure 4 shows that the average response time is reasonably similar from start to finish. When we consider all the vignettes, not just those vignettes with response times of 8 seconds or less, we end up with an average response time around 3.2 seconds per vignette. When we eliminate all vignettes with response times of 8 seconds or more as well as vignettes assigned the rating ‘3’ (I don’t know), we end up with a flat line corresponding to an average around 2.6 seconds per vignette.
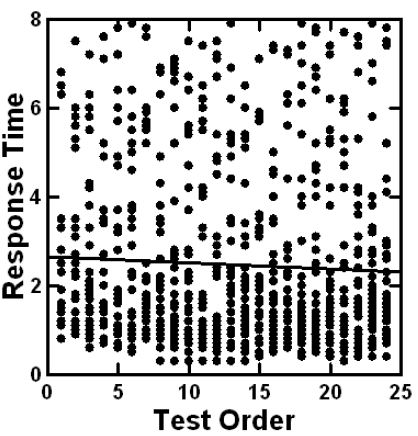
Figure 4: Distribution of response times for the evaluation of single vignettes. The graph shows the data from all 119 respondents for all vignettes evaluated faster than 8 seconds per vignette. The graph is without any vignettes which required 8 seconds or longer to evaluate the average response time is about 2.6-2.7. When all data are considered including vignettes rated 3, and/or showing a response time of 8 seconds or higher, the mean becomes 3.2.
There are other interesting calculations to be made with response time, one of the aspects of the efficiency of the Mind Genomics process. Consider the fact that for the total panel, and taking into account all vignettes, the average time for a person is 3.2 seconds per vignette. Since each respondent evaluated 24 vignettes, on average the actual evaluations occupied 76.8 seconds of the respondent’s time, as measured by the Mind Genomics program (24 vignettes x 3.2 seconds/vignette = 76.8 seconds). During that time the respondent ‘read’ or at least scanned 80 elements, since each respondent evaluated 16 elements 5x times in the 24 vignettes. The ratio of 76.8 seconds to read 80 elements comes to 0.96 seconds per element. That approach is far more efficient, and less bias-prone that the typical one-at-a time process which is the case for standard questionnaires.
Preliminary Analysis – What Do We Learn from the Average Rating?
The conventional starting analysis looks at measures of central tendency to get a sense of the magnitude of effects. Table 3 shows the average ratings for five dependent variables. The first is response time, directly measured. The second to the fifth are newly created dependent variables, defined above, and taking on the value of either 0 (however that is defined), or 100 (however that is defined). The four dependent variables can, by definition, take only two values for a vignette, 0 or 100, depending upon what rating was assigned.
It is clear from Table 3 that there are some important patterns, although we really do not have a sense of the mind of the respondent. We are, in effect, looking from the outside in, not knowing the criteria used by the respondent, but knowing clearly that the response times for the younger respondents (ages 26-39) are certainly shorter than the response times for the older respondents (40 and above).
Table 3: Averages for the five variables by total and key subgroups.
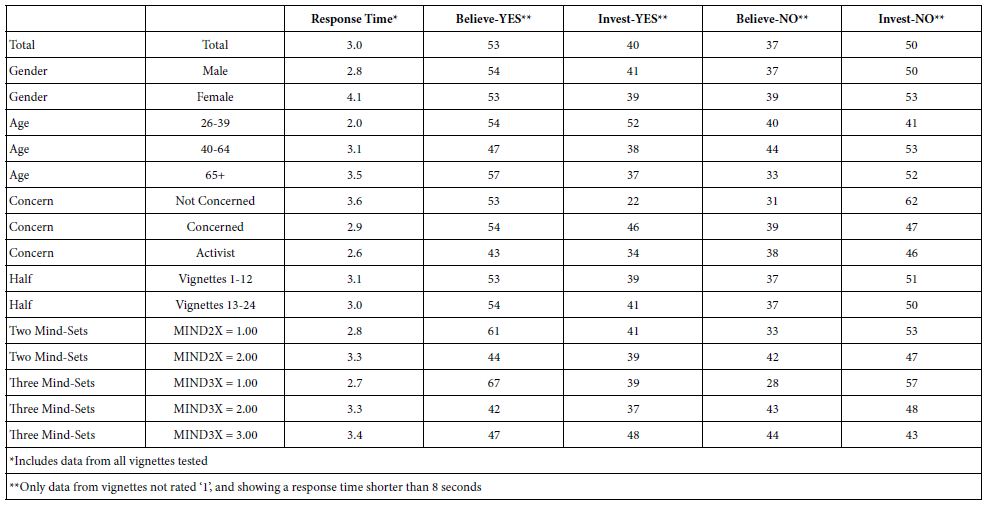
We can search through the table to discover potentially interesting patterns. For example, the younger respondents on average say that they will invest, whereas the older respondents say that they will not invest. These patterns can be labelled ‘interesting’ and ‘worthy of further investigation.’ The reality, however, is that we do not have a deep see of what it means for males to show a lower average response time vs. those of females (2.8 vs. 4.1). One might do statistical analyses to confirm this finding and compare it to the same type of difference, only more pronounced, with the youngest group of respondents showing the fastest response time (average 20 seconds) versus the response times of the two old groups (3.1 seconds and 3.5 seconds, respectively). The same types of differences between groups emerge as we scan Table 3. The problem is that we are measuring differences in reactions but cannot trace the differences to specific stimuli having ‘interpretability’ or ‘cognitive richness.’ We can hypothesize what might be happening, but we have a better way—trace the differences in groups back to the actual stimuli and the ‘meaning’ of those stimuli.
Relating Response Time (RT) and the Four Newly Created Binary Variables to the 16 Elements
As much as we learn from averages, we miss a great deal about the ‘inner workings’ of the data. By the term ‘inner workings,’ we mean a sense of understanding what’s going on. When the scientist deals with stimuli which are physical measures, purely numbers, and from the array of points discovers patterns, we say that the scientist ‘understands’ what is or what may be going on and not simply measures. The scientist’s talent is not simply to measure with exceeding care and precision. That is being done already by automatic machines. Rather, it is the job of science to ‘connect the dots and tell the story.’
A strong contribution of Mind Genomics is to work with cognitively meaningful stimuli, allowing the pattern of measurements to tell a story. In other words, much of the difficulty in discerning the pattern goes away because the points being measured are themselves meaningful. Each element, each point, has a meaning. Thus, a pattern of performance of different ‘meanings’ may immediately suggest higher order patterns, patterns that in other sciences would take much more experience and many more studies to uncover.
Armed with this point of view, let us proceed to the next step, which is to create a mathematical model relating the presence/absence of the 16 elements to a response. The elements are the ‘independent variables’, systematically combined by design. The response time is the dependent variable, defined as the number of seconds elapsing between the presentation of the stimulus on the screen, and the response offered by the respondent.
We can now proceed to create the equations or models. The equations are created by a very simple mathematical process known as OLS (ordinary least-squares) regression. The database shown in part in Table 2 gives us the necessary structure. There are 16 independent variables, corresponding to the 16 elements. For each vignette, the underlying experimental design specifies exactly which element appears. The experimental designs differ from each other through a systematic approach called permutation. That does not concern us here. What we should keep in mind is that we will put all the RELEVANT data together to create the model.
For purposes of analysis, we will exclude all vignettes assigned the rating ‘1,’ because they are assumed to be irrelevant to the respondent. For purposes of analysis of response time only, we will exclude all vignettes with a response time of 8 seconds or longer, under the assumption that the respondent was multi-tasking.
We will run the models for 14 subgroups, as shown in Table 4. Each column corresponds to a different subgroup. These subgroups are total, gender, age, self-stated level of concern, test order across the 24 vignettes (first 12 vs. last 12), and finally three mind-sets extracted from the data and discussed below in terms of their meaning.
For each of our 14 subgroups, the OLS regression requires one pass through the data to create an equation with all the relevant data. The equation is quite simple:
Response Time = k1(A1) + k2(A2)+ k3(A3) + ….k16(D4)
The foregoing equation differs slightly from the previous equations estimated for Mind Genomics. The difference is that there is no additive constant. The pattern of coefficients will be the same, but it will be easier to visually compare the patterns of coefficients when there is no additive constant. The actual magnitudes of the coefficients will be higher, but the correlation with coefficients estimated with an additive constant in the model will be high (R>0.95). The choice to estimate without an additive constant is simply pragmatic to make the comparisons easier, allowing patterns to emerge.
Table 4 shows the pattern of coefficients for response time vs. the elements. The OLS regression with the proper subgroup of respondents ensured 16 coefficients for each group, one coefficient for each element. We interpret the coefficient as the estimated relative number of seconds that the respondent allocated to reading the information and making a decision. We use the term ‘relative’ because included in the coefficients is some ‘overhead’ devoted to assigning the rating. We don’t know how much of the approximately 2.6 seconds (per vignette) can be allocated to the act of assigning the rating, so we allocated this unknown time equally across all 16 elements.
Table 4: Pattern of response times for the different elements, by total panel and key subgroups. The elements which are defined as ‘engaging’ are those with response times of 1.1 seconds. These are highlighted in bold shading.
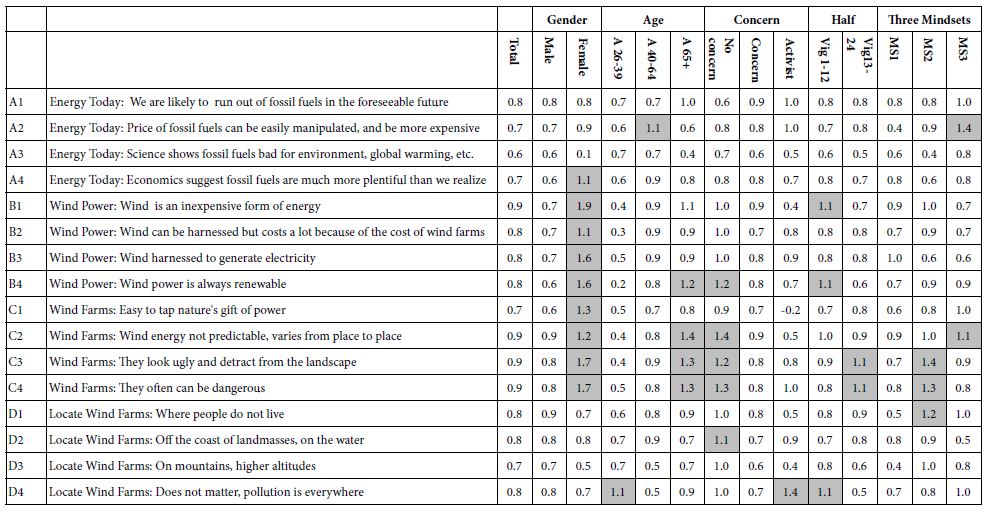
The pattern of coefficients can be discovered from top to bottom, showing for a single subgroup which elements take longer to read (viz. show larger response times). The pattern of coefficients can also be searched for by looking across a row, to show how the same element engages people of different subgroups. To make the pattern discovery easier, we have darkened the cells for all elements showing long response times, defined as 1.1 seconds or longer.
Before pointing out some of the obvious patterns, it is important to stress that there is no necessary relation between the magnitude of the coefficient and the importance of the element as a driver of decisions. Often those in consumer research want to use response time as a measure of good vs. bad. It is not. Response time is simply a measure of attribute ‘attention time’ of the respondent to the element in this task. Even with that caveat, some interesting patterns emerge.
Our strategy to extract insights from Table 4 on response time and the remaining tables of coefficients will be simply to inspect the table and look at the patterns of strong performing elements. For Table 4, these strong performing elements are the ones shown in dark shade.
- Total, no element from the set of 16 strongly engages the respondent. We typically see this type of ‘weak’ performance for the total panel. Other researchers feel that they somehow have ‘missed’ the strong elements, which would likely engage the respondent, and opt for further research. From this experiment on wind power, and from many others, the failure to discover that magically strong performing set of elements is a signal that there are probably competing patterns of response to the elements. The flatness of the data could be the result of the mutual cancellation of the patterns.
- Gender: Women respond more slowly, appearing to be engaged by elements in group B (Wind Power) and group C (Wind Farms). The pattern of response times is striking, with the response time for women essentially twice that of men. Wind Power and Wind Farms constitute elements which define the topic more than prescribe the solution. This pattern opens up the possibility that women and men process the information differently. It is important, however, to note that the differences in response time (engagement with the material) do not suggest differences between the genders in attitude.
- Age: Table 3 showed that the older respondents, on average, take longer to respond to the vignettes. When we deconstruct the response times, we find that the big differences emerge once again for group C (Wind Farm). Once again, the pattern of differences across ages is striking for this group of elements. The Wind Farms provide new information for the reader. The very youngest respondents (ages 26-39) show the shortest response times, except for D4, an element which speaks to a sense of emotional resignation (Locate Wind Farms: Does not matter, pollution is everywhere)
- Concern: The only noteworthy pattern emerge from self-defined concern occurs with those who say that have no concern. Again the group of elements dealing with wind farms are those which engage the respondents, and specifically those who are otherwise not engaged.
- Half: This refers to models created from vignettes 1-12 vs. models created from vignettes 13-24. All respondents evaluated 24 vignettes. The issue is whether there are noticeable and systematic differences between response times to elements tested during the first half of the experiment versus response times to elements tested during the second half of the experiment. Again, the only elements which show a change when tested early versus tested late in the sequence are the two elements dealing with wind farms (Wind Farms: They look ugly and detract from the landscape, Wind Farms: They often can be dangerous). These two elements show much longer response times when tested in the first part of the Mind Genomics experiment, suggesting that they engage at first, but then having engaged, become more typical, and show shorter response times like the other elements.
- Mind-Sets. As discussed below, the respondents will be divided by the pattern of their coefficients across all four binary variables (BELIEVE-NO, BELIEVE-YES, INVEST-NO, INVEST-YES). The analysis allows us to extract three groups of respondents showing different patterns of coefficients. The mind-sets different in the response time.
Mind Set 1 – Nothing Strongly Engages
Mind Set 2
C3: Wind Farms: They look ugly and detract from the landscape
C4: Wind Farms: They often can be dangerous
D1: Locate Wind Farms: Where people do not live
Mind Set 3
A2: Energy Today: Price of fossil fuels can be easily manipulated, and be more expensive
C2: Wind Farms: Wind energy not predictable, varies from place to place
If we were to summarize the learning from response time, we would conclude that response time gives us a sense of the engagement power of elements. We do not know WHY these elements engage although we can conjecture that they provide new and interesting information. We also get a sense that once the information is processed, it is no longer as engaging. Thus the engaging may be correlated with learning, and not with stopping one’s attention because an emotional appeal.
Creating Models for Attitudinal Responses (Believe, Invest)
The next four tables (Tables 5-8) show models for the individual elements, based this time on the response of believe (or not believe), and invest (or not invest). These models generate a great deal of data, with 16 coefficients for each subgroup. For the mind-sets, only the three-mind-set solution is shown.
Table 5: Group models showing the relation between elements and the binary variable Believe-Yes. The coefficients were computed without any vignettes rated ‘1’.
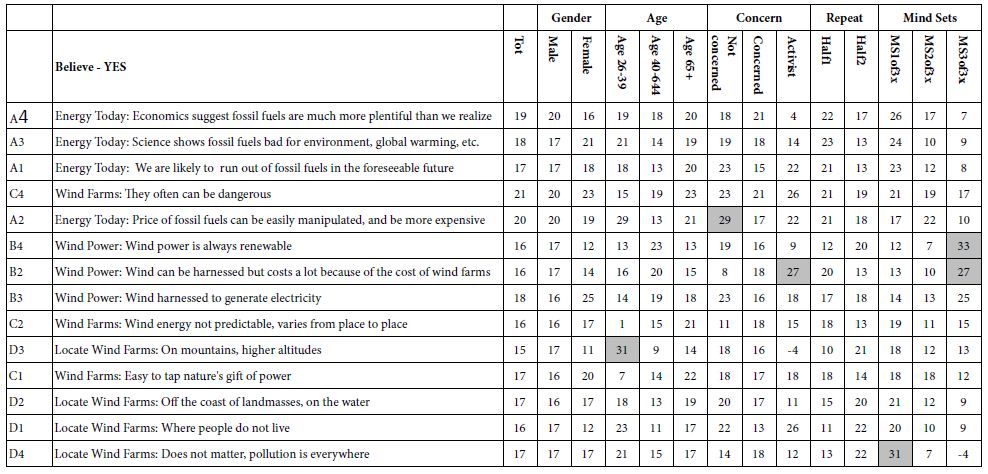
Table 6: Group models showing the relation between elements and the binary variable INVEST-YES. The coefficients were computed without any vignettes rated ‘1’.
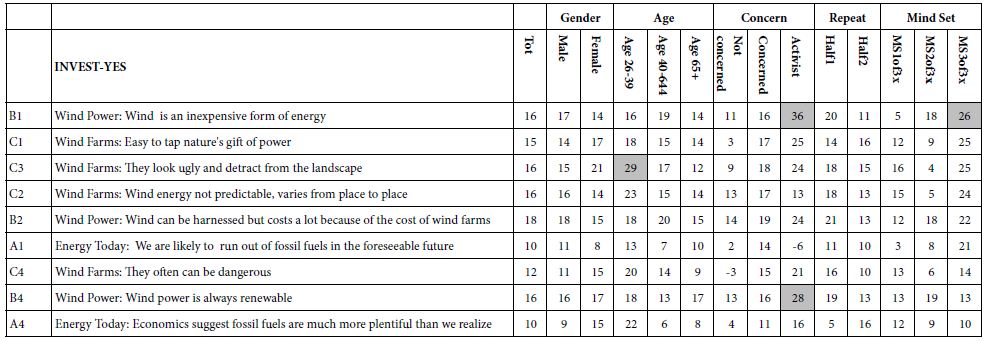
Table 7: Group models showing the relation between elements and the binary variable BELIEVE-NO. The coefficients were computed without any vignettes rated ‘1’.
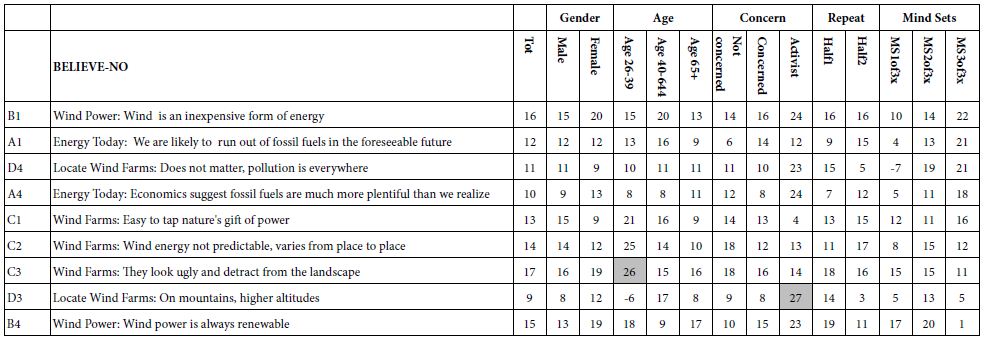
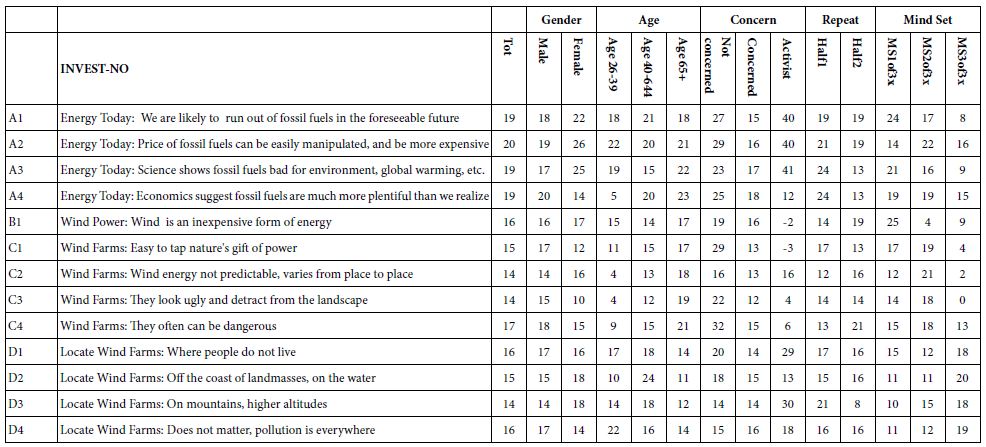
Table 8: Group models showing the relation between elements and the binary variable INVEST-NO. The coefficients were computed without any vignettes rated ‘1’.
To make it easier for patterns to emerge, the Tables are absent any coefficients of 20 or lower, corresponding to a coefficient of 8-10 for the equivalent model with an additive constant. The coefficient of 8-10 with the latter models is taken as the qualitative cut-point separating important versus unimportant elements. Furthermore, an element lacking a strong performing element in all subgroups is eliminated from the table. Finally, all coefficients of 26 or higher are shown in shaded form and represent very strong elements driving the response.
Creating Models for ‘Believability’ (BELIEVE-YES) – Table 5
Two scale points allowed the respondent to express believability, one with no intent to invest (rating 3),and one with intent to invest (rating 5). The transformation of ratings discussed above generated the new derived variable ‘BELIEVE-YES’. The models for believability were constructed on a group-by-group basis, using only the vignettes not rated as ‘1’ (no way).
The most believable elements are the ones which provide information, but do not appear to dictate action, nor do they appear overly alarmist.
C4 Wind Farms: They often can be dangerous
A2 Energy Today: Price of fossil fuels can be easily manipulated, and be more expensive
A3 Energy Today: Science shows fossil fuels bad for environment, global warming, etc.
A1 Energy Today: We are likely to run out of fossil fuels in the foreseeable future
A4 Energy Today: Economics suggest fossil fuels are much more plentiful than we realize
It is in the performance of the elements where the extraction of mind-sets brings us a new clarity.
Mind-Set 1 of 3 believes the alarming new
Mind-Set 2 of 3 believes little other than the venality of economics, in the manipulation of prices
Mind-Set 3 of 3 is optimistic, believing in the renewability of energy afforded by wind power
Creating Models for ‘Investing’ (INVEST-YES) – Table 6
Two scale points allowed the respondent to express interest in investing, invest but with no belief (rating 4), and invest with belief (rating 5). The transformation of ratings discussed above generated the new derived variable ‘INVEST-YES’. The models for INVEST-YES were constructed on a group-by-group basis, using only the vignettes not rated as ‘1’ (no way.)
There are substantially fewer elements which drive ‘INVEST’ compared to which drive ‘BELIEVE.’ Furthermore, the pattern of strong performers is not as clear. The elements driving investment are mainly wind power, but only with a few subgroups.
C3: Wind Farms: They look ugly and detract from the landscape
B1: Wind Power: Wind is an inexpensive form of energy
B2: Wind Power: Wind can be harnessed but costs a lot because of the cost of wind farms
B4: Wind Power: Wind power is always renewable
It is in the performance of the elements where the extraction of mind-sets brings us a new clarity. Only Mind-Set 3 shows any interest in investing. These are the significant elements for Mind-Set 3. The remaining mind-sets show little interest in investing,
B1: Wind Power: Wind is an inexpensive form of energy
C1: Wind Farms: Easy to tap nature’s gift of power
C3: Wind Farms: They look ugly and detract from the landscape
C2: Wind Farms: Wind energy not predictable, varies from place to place
B2: Wind Power: Wind can be harnessed but costs a lot because of the cost of wind farms
A1: Energy Today: We are likely to run out of fossil fuels in the foreseeable future
Creating Models for ‘Not Believing’ (BELIEVE-NO) – Table 7
Two scale points allowed the respondent to express NO BELIEF one with no intent to invest (rating 2),and one with intent to invest (rating 4). The transformation of ratings discussed above generated the new derived variable ‘BELIEVE-YES’. The models for BELIVE-NO were constructed on a group-by-group basis, using only the vignettes not rated as ‘1’ (no way.)
There are substantially fewer elements which drive ‘BELIEVE NO’ compared to elements which drive ‘BELIEVE yes. Furthermore, the pattern of strong performers is not as clear. There are no elements strongly disbelieved by various groups at the same time. Rather, there are three groups which are responsible for the disbelief, for BELIEVE-NO
Self-Defined Activist
D3: Locate Wind Farms: On mountains, higher altitudes
B4: Wind Power: Wind power is always renewable
Age 26-39
C1: Wind Farms: Easy to tap nature’s gift of power
C2: Wind Farms: Wind energy not predictable, varies from place to place
C3: Wind Farms: They look ugly and detract from the landscape
Mind-Set 3 (which seems to share points of view with the activist)
B1: Wind Power: Wind is an inexpensive form of energy
A1: Energy Today: We are likely to run out of fossil fuels in the foreseeable future
D4: Locate Wind Farms: Does not matter, pollution is everywhere
Creating Models for ‘Not Investing’ (INVEST NO) – Table 8
Two scale points allowed the respondent to express NOT INVEST, one with no belief (rating 2) and one with belief (rating 3). The transformation of ratings discussed above generated the new derived variable ‘INVEST-NO’. The models for INVEST-NO were constructed on a group-by-group basis, using only the vignettes not rated as ‘1’ (no way.)
There are three elements which appear to drive ‘INVEST NO’. These are
A1: Energy Today: We are likely to run out of fossil fuels in the foreseeable future
A2: Energy Today: Price of fossil fuels can be easily manipulated, and be more expensive
A3: Energy Today: Science shows fossil fuels bad for environment, global warming, etc.
There is one element which appears to drive ‘INVEST-NO’ but with fewer subgroups
A4: Energy Today: Economics suggest fossil fuels are much more plentiful than we realize
The groups which say they won’t invest are those not concerned, those who proclaim themselves activists, those who are 65+ and those who are female.
Not concerned:
A1: Energy Today: We are likely to run out of fossil fuels in the foreseeable future
A2: Energy Today: Price of fossil fuels can be easily manipulated, and be more expensive
A3: Energy Today: Science shows fossil fuels bad for environment, global warming, etc.
A4: Energy Today: Economics suggest fossil fuels are much more plentiful than we realize
Self-proclaimed activists
A2: Energy Today: Price of fossil fuels can be easily manipulated, and be more expensive
A3: Energy Today: Science shows fossil fuels bad for environment, global warming, etc.
A4: Energy Today: Economics suggest fossil fuels are much more plentiful than we realize
C4: Wind Farms: They often can be dangerous
Age 65+
A2: Energy Today: Price of fossil fuels can be easily manipulated, and be more expensive
A3: Energy Today: Science shows fossil fuels bad for environment, global warming, etc.
A4: Energy Today: Economics suggest fossil fuels are much more plentiful than we realize
C4: Wind Farms: They often can be dangerous
Females
A1: Energy Today: We are likely to run out of fossil fuels in the foreseeable future
A2: Energy Today: Price of fossil fuels can be easily manipulated, and be more expensive
A3: Energy Today: Science shows fossil fuels bad for environment, global warming, etc.
Among the three mind-sets, is Mind-Set 1 which is most likely not to invest, but only with three elements
A1: Energy Today: We are likely to run out of fossil fuels in the foreseeable future
A3: Energy Today: Science shows fossil fuels bad for environment, global warming, etc.
B1: Wind Power: Wind is an inexpensive form of energy
Mind-Set 2
A2: Energy Today: Price of fossil fuels can be easily manipulated, and be more expensive
B1: Wind Power: Wind is an inexpensive form of energy
Discussion and Conclusion
Today’s world is awash with information, ideas, opportunities. When confronted with an opportunity, how can one evaluate the importance of the part of the idea? We don’t know the actual ‘truth’ of the idea, from a scientific point of view. That must be left to experts, individuals who ‘know’ the topic, either because of specialized education or experience. Rather, we mean the ideas people use in common communication to tell a story, to report with the idea of changing someone’s thinking, and even drive desired behaviors.
Mind Genomics appears to be able to allow information to be systematically evaluated for its believability and motivating power. As such, it can be used as a tool by entrepreneurs who must develop messages driving both believability and investment worthiness. It is important to note that Mind Genomics is a powerful research method to understand the mind of the prospective investor.
At a more systematic level we can imagine the approach presented here as a way to understand the response of people to issues. The combination of homo emotionalis (believability or some similar rating anchor), and homo economics (likely to invest or similar type of anchor) provides a unique opportunity to understand two dimensions of a topic. One can then repeat this same study over time, in order to understand the change of the consumer mind, do the same study across countries to uncover basic, world-wide mind-sets transcending countries, or change the introduction to present different set-ups. Instead of a bland introduction, we can imagine a set of studies with systematically varied introductions, ranging from presenting the opportunity in light of the economics of the wind power, in light of news about changes in the earth’s environment portending troubles, and so forth. The Mind Genomics study becomes a way of probing the mind of the respondents who have been introduced to systematic variations in the set-up phase. The approach espoused by Mind Genomics might be likened to a structured ‘wisdom of crowds’ [22-25]. It may be impossible for a single individual to understand the topic, and to provide unbiased information. When one presents the results from a group of respondents, one is better off; the individual variations cancel so the central tendency can emerge.
Technical Appendix – Creating New to the World Mind-sets from Multiple Dependent Variables
In previous studies using Mind Genomics, the approach was to create a single dependent variable (e.g.. INVEST-YES), whether that dependent variable original from one rating scale point, from two, or some other combination. That newly created dependent variable was then slightly modified by the additional of a small random number, around 10-3 or less. The data allowed the estimation of individual level models, one model or equation per respondent. The individual-level statistics were ensured by having the specific 24 vignettes created by an experimental design, of the same mathematical structure, but permuted to create different combinations for each respondent.
With the increasing use of Mind Genomics, it became obvious that one could have the respondent evaluate the same vignette on a number of dependent measures, and indeed have at least two dependent measures combined into scale. Each scale point was defined as having two defining characteristics, one from each dependent measure. For this study, the measures were, respectively, believe vs. not-believe, and invest vs. not-invest.
Faced with the multiplicity of aspects on which a vignette could be judged, the researcher who wants to divide the respondents into different mind-sets faces a quandary. It is perfectly arguable to divide the respondents by what the researcher feels to be important, belief on the one hand, invest on the other. The question arises as how to combine these separable aspects so create a holistic picture of the mind of the respondent. For this study, specifically, that question becomes how to incorporate both invest and believe, or even invest, believe, not invest, not believe) into a set of numbers to be used for clustering.
The approach to answer the question follows these simple steps:
- Create an individual level model for each of the 119 respondents, for each of the four dependent variables (believe yes, invest yes, believe no, invest no). This is allowable because of the individual level experimental design [21].
- The equation created in Step 1 is absent the additive constant. A quick comparison of models for the same data, equations with vs. without additive constants, suggest a high correlation.
- Merge the four database, one database created for each dependent variable. The columns are the four sets of 16 coefficients, for a total of 64 columns of data. The rows correspond to the 119 respondents.
- Perform a principal components factor analysis, using the 64 columns (coefficients) as variables, and the 119 rows as respondents. Create a matrix extracting all factors with eigenvalues > 1.0, and rotate the matrix by Quartimax to make the data matrix simpler, albeit not necessarily interpretable. The objective here is to reduce the redundancy. The 64 coefficients reduce to 19 coefficients for each respondent, the factor scores of that respondent on the rotated set of newly created variables.
- Finally, cluster the 119 respondents into two or three groups, using standard k-means clustering. The clustering is done on the factor scores (19 variables), rather than on the original coefficients (64 variables). The measure of distance is D, defined as the quantity (1 – Pearson R). R takes on the value of 2 when the correlation of factor scores between two people is -1. R takes on the value of 0 when the correlation of factor scores between two people is +1 [22].
- The k-means clustering generates an estimated cluster (mind-set) membership for each respondent. This becomes a new variable describing ‘who a person IS’.
- We then run the regressions on three newly-defined subgroups. We run five regression, each without the additive constant. These regression relate the presence/absence of the 16 elements to response time, to believe, to invest, to not-believe, and to not-invest, respectively.
References
- Camerer CF, Loewenstein G, Rabin M (2004) Advances in behavioral economics. Princeton university press.
- Korniotis GM, Kumar A (2011) Do older investors make better investment decisions?. The Review of Economics and Statistics 93: 244-265.
- Tan HT, Wang EY, Yoo GS (2019) Who likes jargon? The joint effect of jargon type and industry knowledge on investors’ judgments. Journal of Accounting and Economics 67: 416-437.
- Uslu Divanoğlu S, BAĞCI D (2018) Determining the factors affecting individual investors’ behaviours. International Journal of Organizational Leadership 7: 284-299.
- Wang A (2009) Interplay of investors’ financial knowledge and risk taking. The journal of behavioral finance 10: 204-213.
- Porretta S, Gere A, Radványi D, Moskowitz H (2019) Mind Genomics (Conjoint Analysis): The new concept research in the analysis of consumer behaviour and choice. Trends in Food Science & Technology 84: 29-33.
- Ravetz JR (2020) Scientific knowledge and its social problems. Routledge.
- Welch JB, Venkateswaran A (2009) The dual sustainability of wind energy. Renewable and Sustainable Energy Reviews 13: 1121-1126.
- Alsaad MA (2013) Wind energy potential in selected areas in Jordan. Energy Conversion and Management 65: 704-708.
- Ghori U (2012) Risky winds: investing in wind energy projects in Pakistan. Journal of Energy & Natural Resources Law 30: 129-158.
- Kwon SD (2010) Uncertainty analysis of wind energy potential assessment. Applied Energy 87: 856-865.
- Li CB, Lu GS, Wu S (2013) The investment risk analysis of wind power project in China. Renewable Energy 50: 481-487.
- Lohmann L (2009) Climate as investment. Development and change 40: 1063-1083.
- Moskowitz HR (2012) ‘Mind genomics’: The experimental, inductive science of the ordinary, and its application to aspects of food and feeding. Physiology & behavior 107: 606-613. [crossref]
- Moskowitz MR, Ashman H, Minkus-McKenna D, Rabino S, Beckley JH (2006) Databasing the shopper’s mind: Approaches to a ‘mind genomics’. Journal of Database Marketing & Customer Strategy Management 13: 144-155.
- Moskowitz H, Prendi V, Gere A, Harizi A, Papajorgji P (2021) Mind-sets of worried citizens and the’real-world experiment’of Covid-19: A mind genomics cartography. Edelweiss Applied Science and Technology 41-49.
- Døskeland T, Pedersen LJT (2016) Investing with brain or heart? A field experiment on responsible investment. Management Science 62: 1632-1644.
- Kahneman D (2011) Thinking, fast and slow.
- Mishra SK, Kumar M (2011) How mutual fund investors’ objective and subjective knowledge impacts their information search and processing behaviour. Journal of Financial Services Marketing 16: 27-41.
- Brook RJ, Arnold GC (2018) Applied regression analysis and experimental design. CRC Press.
- Gofman A, Moskowitz H (2010) Isomorphic permuted experimental designs and their application in conjoint analysis. Journal of sensory studies 25: 127-145.
- Verma M, Srivastava M, Chack N, Diswar AK, Gupta N (2012) A comparative study of various clustering algorithms in data mining. International Journal of Engineering Research and Applications (IJERA) 2: 1379-1384.
- Lundstedt T, Seifert E, Abramo L, Thelin B, Nyström Å, et al. (1998) Experimental design and optimization. Chemometrics and intelligent laboratory systems 42: 3-40.
- Montier J (2010) The little book of behavioral investing: how not to be your own worst enemy 35: John Wiley & Sons.
- Surowiecki J (2005) The wisdom of crowds. Anchor.