Abstract
We present a novel approach to arts marketing, using Mind Genomics, demonstrating the use with a study conducted for the Arizona Opera. Respondents evaluated different messages about opera, rating combinations of these messages, the combinations created according to experimental design. The deconstruction of the responses revealed the part-worth contribution of each element to interesting the respondent in opera. The deconstruction of the response time showed the elements which engaged the respondent’s attention. Two mind-sets emerged, those interested in the educational aspects of opera, and those interested in the entertainment value of the experience. We introduce the PVI, the personal viewpoint identifier, a tool to assign new individuals to one of the two mind-sets, and suggest how the PVI may contribute to a more effective digital marketing campaign.
Introduction
Patrons of the arts, especially opera but also of the other arts, are well aware of the need of those who both fund and stage the artistic efforts to understand the mind of their audiences. When it comes to the more conventional things that are marketed, the objective is stated in economic terms, such as maximizing share, or maximizing profit. The economic aspects are paramount. When it comes to certain other aspects of human effort, such as culture, and specifically in our case, opera, the introduction of the ‘marketing concept’ is fraught with more equivocation, more tension. Some of this may come from the nature of the topic, and the realization that the marketing concept is a crude, unfeeling alternative to the higher order efforts of that which is being marketed, namely ‘culture.’
When we move to marketing for non-profits, and especially those dealing with the arts, we move from working with products and services delivering concrete benefits to products and services existing because they deliver aesthetic experiences to their audiences. How does one deal with these experiences? Is the marketing effort to be geared to the experience as an economic construct, or as an experience construct? Is there a measure of pleasure?
The literature of marketing and the arts is quite rich, perhaps because those in the arts realize how important it is to gain the patronage of those who enjoy the arts. Arts marketing is not necessarily as rich in academic studies, but arts marketing has its array of practical work, and books. Thus, we have titles such as Diggles’ 1986 book on ‘Guide to Arts Marketing: The Principles and Practice of Marketing as They Apply to Arts’ (Diggles, 1986), going in hand in with books about non-profit organizations such as Rados’ 1996 book ‘Marketing for Non-Profit Organizations’ (Rados, 1996).
When it comes to arts and marketing in the academic literature, there are few studies reported in the spirit of what we would call an experiment. The studies tend to deal with the topic of marketing from the point of view of sociology (e.g., Butler, 2007; Colbert, 2003; Ventakatesh & Meamber, 2006). That is, the studies report about what is being done in society at large. The spirit of the research focuses on the common patterns of behavior used by those trying to raise money from subscribers or patrons.
One possible reason for the lack of literature featuring ‘experiment’ is the nature of art. Art is an expression of the nobler characteristics of the human spirit. Hirschman (1983) put it this way:
It is proposed that the marketing concept, as a normative framework, is not applicable to two broad classes of producers because of the personal values and social norms that characterize the production process. These two classes of producers are artists and ideologists. Artists are those who create primarily to express their subjective conceptions of beauty, emotion or some other aesthetic ideal. Ideologists are those who put forward an integrated set of positive and normative statements that describe what the world is and what it should be.
Steps in the Mind Genomics Process
The study reported here focuses on what can be said specifically about the Arizona opera to drive positive behaviors, either in terms of attitude or in terms of action. The study can be best described as an experiment, to understand how the specific communications drive responses. The study follows the tenets of Mind Genomics, an emerging science which deals with the way we respond to the specifics of ordinary, daily life, such as the opera. Mind Genomics focuses on the responses to messages about the different topics of daily life, not to show the rationality or irrationality of people, but rather to discover the aspects of daily life to which people pay attention when asked to make a decision (Moskowitz & Gofman, 2007; Moskowitz et. al., 2006).
Mind Genomics is evolving to a set of defined steps in order to understand the everyday ‘mind’ of an individual faced with information about the ordinary information that must be used to make a decision. The steps are not ‘fixed in stone.’ Rather, the steps reflect a work in progress, a system to develop a deeper understanding of how a person weighs specific ‘pieces of information’ to make a decision (Moskowitz, 2012; Moskowitz et. al., 2006; Moskowitz & Gofman, 2007.)
Step 1: Define the Topic
The topic is ‘What to say to prospective opera attendee to make that individual want to subscribe to the Arizona Opera’. It is clear that the topic is limited and specific. Often, the depth of information to be gained ends up far greater and more useful when the researcher focuses on specifics, and limits the topic. With the limitation, it becomes possible to probe deeply, testing many different specific messages relevant only to the subscription to the Arizona Opera. If the topic were more general, such as ‘what makes a good opera experience,’ we might have many elements as well, but we would lack the specifics which make the idea real in the mind of the reader. We might end up testing generalities which lack the cognitive richness of the particular.
Step 2: Create a Set of Four Questions, and for Each Question, Provide Four Answers
The questions should ‘tell a story,’ and be answered by a phrase, not just yes/no nor just a single word. The rationale for requiring a phrase for the answer is that later, during the actual Mind Genomics experiment, the answers, now elements, will be mixed and matched to create vignettes. It is easier when the pieces of information can be read as phrases, the combination of which ‘tells a story.’
Table 1 presents the four questions, and the four answers. The selection of questions, and then the four answers for each question, is done with the full understanding that this specific set of questions and answers is only a small fraction of the possible questions and answers. The terms ‘answers’, ‘messages’, and ‘elements’ will be used interchangeably in the rest of this paper.
Table 1: The four questions about attending opera, and the four answers to each question.
| Question A: What is it? | |
| A1 | AZ Opera … Bold, Brave, Brilliant |
| A2 | Presenting artists of both international stature and emerging talent |
| A3 | Elevates the transformative power of storytelling through music |
| A4 | One of the only Operas in the country that regularly performs in two cities |
| Question B: Why do I like it? | |
| B1 | a special place where I can get really dressed up and be glamorous |
| B2 | Shouting “BRAVO!” during the show and at the final curtain call |
| B3 | Dinner plus the show … a total night out on the town |
| B4 | AZ Opera performances I can listen to on public radio |
| Question C: How do I do it? | |
| C1 | An Opera season where I can choose my own subscription |
| C2 | AZ Opera … I can mix and match the performances |
| C3 | English translations of the lyrics are projected on a screen above the stage as they are sung |
| C4 | Arrive an hour before curtain to learn about the show you are about to see! |
| Question D: Why does it matter to the community? | |
| D1 | Free music and lecture series examine each opera in detail |
| D2 | Free brown bag operas on Fridays before the big event |
| D3 | A traveling troupe brings opera to schools |
| D4 | Arizona Opera’s book club … a great way to meet fellow audience members and discuss, learn, and connect |
Step 3: Create Vignettes
The vignettes comprise combinations of elements (viz., answers), arranged one on top of the other, centered. A vignette comprises at most one element or answer from each of the four questions. The vignette comprises 2-4 elements but often, and by design, no answer from one or two questions. The vignettes are created according to an experimental design, with each design comprising 24 different vignettes. The mathematical structure underlying the experimental design ensures that the 16 elements or answers are statistically independent of each other (Heller, 1986). In the actual experiment, each respondent will be presented with a permutation of the basic design, a permutation which maintains the same statistical benefits (independence of elements, individual-level experimental design). In actuality, the permutation simply creates different sets of combinations from respondents, allowing the researcher to explore a many possible combinations, and build up knowledge by exploring the topic broadly, rather than build up knowledge by exploring one little region of the topic with precision by replicating the same set of 24 vignettes across many respondents. The permuted experimental design ensures that one can analyze the data from as few as one respondent to obtain clear information. The permuted experimental design is a key feature of Mind Genomics (Gofman & Moskowitz, 2010), and metaphorically can be likened to understanding the topic using an MRI (magnetic resonance). The MRI takes pictures of the tissue from many angles, and puts the data together to create a single, coherent picture.
Step 4: Invite Respondents to Participate
Mind Genomics experiments typically require about five minutes of a respondent’s time. Although it seems a good idea to invite respondents from among one’s friends and associates, the reality is the abysmally low response rate, usually around 10% or lower. People simply do not want to volunteer their time in a world where many factors compete for a person’s attention. The solution to this conundrum is to work with a panel company, which specializes recruiting and compensating individuals for these studies. The Mind Genomics study was executed among respondents provided by Luc.id, Inc. a company specializing in these studies. The respondents were invited to participate by email.
Step 5: The Test Stimuli and the Respondent Instructions
The Mind Genomics experiment comprises the evaluation of 24 different vignettes, rating each vignette as a single ‘message’ or single ‘idea.’ As noted above, the vignettes are combinations, comprising 2-4 elements, so it is impossible for a respondent to ‘game’ the system by rating the single vignette in the way that the respondent believes the researcher wants to hear. The vignettes are compounds of different messages, each message pulling in its own direction. The respondent may begin by trying to be consistent and ‘politically correct,’ but ends up disinterested, responding to the vignette in an indifferent, almost automatic fashion. That condition of ‘disinterest’ ends up ensuring that the data represent what the respondent truly feels.
The Mind Genomics experiment prefaces each vignette with the same simple instructions about what to do:
You will be presented with a series of statements. Please respond to the statements with your initial reaction. Use the number scale where 1 means I don’t like it at all and 9 means I love it.
Step 6 – Transform the Data
The Mind Genomics study generates ratings on a 9-point scale. Best practices in the world of applied consumer research suggest that it is easier to understand data when the data presented in binary form, no/yes, 0/100. For this study using the 9-point rating scale as the dependent variable, the typical transformation is ratings of 1-6 transformed to 0, and ratings of 7-9 transformed to 100. This is called TOP3. A second transformation changed ratings of 1-3 to 100, and ratings of 4-9 to 0. This is called BOT3 to reflect the elements which drive people away from opera. Finally, the Mind Genomics program also measures the Consideration Time (aka Response Time), defined as the time in seconds between the appearance of the vignette and the respondent’s rating. The Consideration Time is measured to the nearest tenth of a second.
Step 7 – Create Individual Level Models Relating the Transformed Rating (Binary) to the Presence/Absence of the 16 Elements, and then Cluster the Respondents on the Basis of the 16 Coefficients, k1 – k16
The experimental design used to create the 24 vignettes for each respondent ensures that the 16 elements are statistically independent of each other. The first statistical analysis uses OLS (ordinary least-squares) regression to create an equation describing how each of the 16 elements contributes to the binary transformed rating. The equation is expressed as: Rating = k1(A1) + k2(A2) … k16(D4). There is NO additive constant used in the modeling. The individual level modeling generates a matrix, in which each row is a respondent and each column is an element. The numbers in the body of the matrix are the coefficients for the 16 elements, on a respondent by respondent basis. The additive constant is not retained for this first analysis.
The second statistical analysis uses clustering to divide the respondents into two, and then three complementary groups, based upon the pattern of the 16 coefficients. The coefficients for TOP3 are used in the clustering. The clustering program computes a distance between respondents (D=(1-Pearson R)). Pairs of respondents with similar patterns of coefficients show a high Pearson R (Pearson correlation coefficient), and assigned to the same cluster. Pairs of respondents with different patterns of coefficients show a low Pearson R and are assigned to different clusters (Jain & Dubes, 1988).
Step 7 is done completely automatically, without any interpretation about what the cluster might actually be called. Everything in Step 7 is done under strictly mathematical rules.
Step 8: Define the Key Subgroups
These subgroups may be the standard ones of age and gender, obtained by a short classification questionnaire which is part of the Mind Genomics experiment. The subgroups may also correspond to the clusters determined from Step 7. The latter subgroups, emerging from clustering the TOP3 coefficients, are renamed ‘Mind-Sets’ to reflect the fact that they represent groups of individuals who view the topic in different ways. For this study on marketing the Arizona Opera, we end up with the Total panel and six key subgroups. The subgroups are:
From self-classification: Gender Male vs Female
From self-classification: Age 19-29 years old vs 30 years and older
Emergent from clustering coefficients: Mind-Set MS1 (Learning) vs MS2 (Entertainment).
Step 9: Relate the Elements to the Dependent Variables, Using Regression
For all the respondents in either the Total Panel or key subgroup, combine the data into one file, and use OLS regression to relate the presence/absence of the 16 elements to three dependent variables: TOP3 (Interested), BOT3 (NOT Interested), and CT (consideration time). The OLS regression estimates the model using all of the data for the key group, rather than estimating individual level models.
The model is written without an additive constant, in order to allow comparisons across groups, and across dependent variables.
The equation is expressed as: Dependent Variable = k1(A1) + k2(A2) … k16(D4)
Step 10: Extract the ‘Story’ from the Coefficients
The data emerging from Mind Genomics comprise elements and their coefficients, the latter estimated by regression. The data is doubly rich. First there are the elements and their respective coefficients. Each element stands by itself. Simply knowing the element and its coefficient for a specific dependent variable, tells the researcher either how important the element is in terms of attitude (TOP3 = Like; BOT3 = Dislike), or in terms of engaging attention (Consideration Time). Second, the pattern linking together the strongest performing elements also tells a story, this time a more general one. There may or may not be a coherent story linking together the strongest performing elements. The absence of a story does not weaken the data, but simply prevents the discovery of the general pattern.
The data are shown in tabular form. For the binary dependent variables (Like, TOP3; Dislike, BOT3), coefficients appear in shaded cells when the coefficient is 15 or higher. For the Consideration Time (CT), coefficients appear in shaded cells when the consideration time or engagement time is 1.5 seconds or higher for the element. The selection of a coefficient of 15 or higher is based upon independent analysis which related the coefficients of the 16 elements estimated in the absence of an additive constant to the coefficients of the same 16 elements estimated with the equation containing an additive constant. A coefficient of 7.5 for the latter (with additive constant) is statistically significant (p<0.05), and corresponds to an additive constant of approximately 16 for the former (without an additive constant). The selection of the Consideration Time of 1.5 seconds is based on judgment, and the search for a meaningful, easy-to-understand pattern.
Results – Total Panel
What to say (TOP3) – set of easy to customize social occasions where one learns and enjoys (Table 2)
Table 2: Performance of the 16 elements across the total panel.
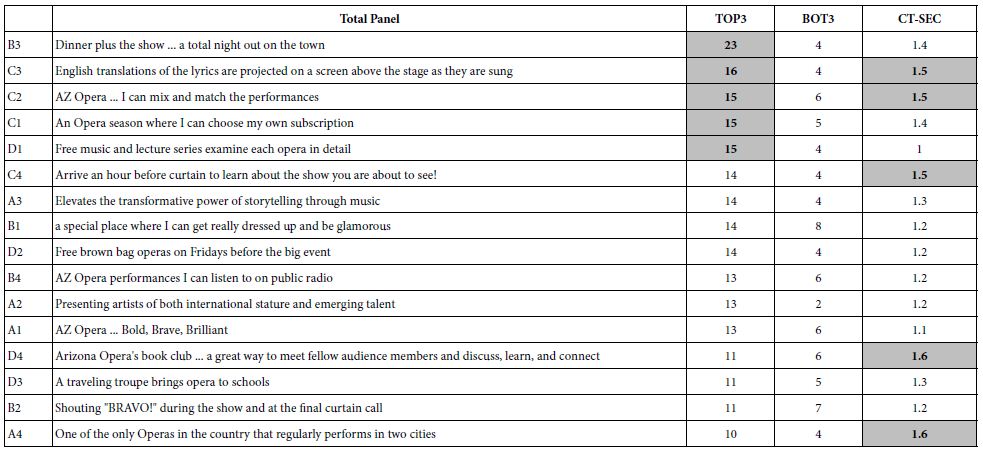
B3 Dinner plus the show … a total night out on the town
C3 English translations of the lyrics are projected on a screen above the stage as they are sung
C2 AZ Opera … I can mix and match the performances
D1 Free music and lecture series examines each opera in detail
C1 An Opera season where I can choose my own subscription
What not to say (BOT3) – don’t overdo the ‘kitschy’ aspect
B1 a special place where I can get really dressed up and be glamorous
B2 Shouting “BRAVO!” during the show and at the final curtain call
What engages (CT) – talk about the learning and knowing opportunities
D4 Arizona Opera’s book club … a great way to meet fellow audience members and discuss, learn and connect
A4 One of the only Operas in the country that regularly performs in two cities
C2 AZ Opera … I can mix and match the performances
C3 English translations of the lyrics are projected on a screen above the stage as they are sung
C4 Arrive an hour before curtain to learn about the show you are about to see!
By Gender and Age
The analysis for total panel can be repeated for four key subgroups, one group at a time. The same criteria were used, namely a coefficient > 15 for TOP3 and BOT3, and a Consideration Time of 1.5 or longer. Table 3 shows the messaging which increase attendance (TOP3), and a suggestion of the common theme.
Table 3: Performance of the elements as drivers of interested (TOP3). Data from key geo-demographic subgroups. Only elements strongly interesting at least one subgroup are shown.
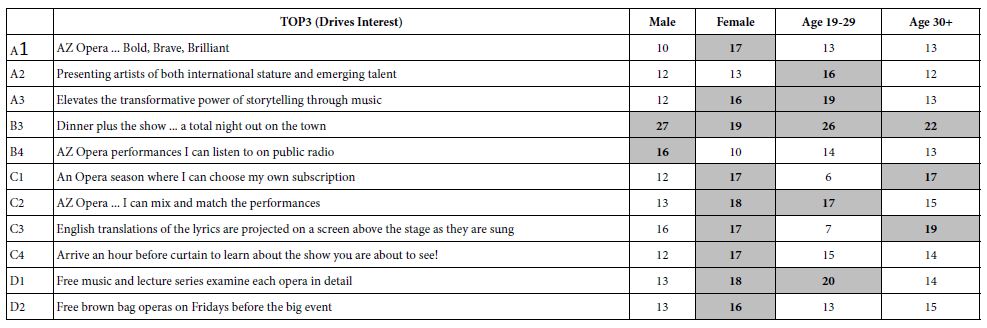
Males – Entertainment and Other Occasions for Listening
B3 Dinner plus the show … a total night out on the town
B4 AZ Opera performances I can listen to on public radio
Females – Many Elements, Especially Entertainment and Learning
B3 Dinner plus the show … a total night out on the town
C2 AZ Opera … I can mix and match the performances
D1 Free music and lecture series examines each opera in detail
C3 English translations of the lyrics are projected on a screen above the stage as they are sung
C1 An Opera season where I can choose my own subscription
C4 Arrive an hour before curtain to learn about the show you are about to see!
A1 AZ Opera … Bold, Brave, Brilliant
D2 Free brown bag operas on Fridays before the big event
A3 Elevates the transformative power of storytelling through music.
Age 19-29 – Entertainment and Learning
B3 Dinner plus the show … a total night out on the town
D1 Free music and lecture series examines each opera in detail
A3 Elevates the transformative power of storytelling through music
C2 AZ Opera … I can mix and match the performances
A2 Presenting artists of both international stature and emerging talent
Age 30+ Entertainment
B3 Dinner plus the show … a total night out on the town
C3 English translations of the lyrics are projected on a screen above the stage as they are sung
C1 An Opera season where I can choose my own subscription
Table 4 shows what not to say. There are no strong elements. When we lower the criteria to a value of 10 or higher, rather than 15 or higher, we end up with two elements, B1 and C2, which tell no story.
Table 4: Performance of the two strong performing elements driving not-interested (BOT3). Data from key geo-demographic subgroups.

Table 5 shows what engages, operationally defined as elements which have Consideration Times of 1.5 seconds or longer.
Table 5: Performance of the elements which engage the respondent. Data from key geo-demographic subgroups.
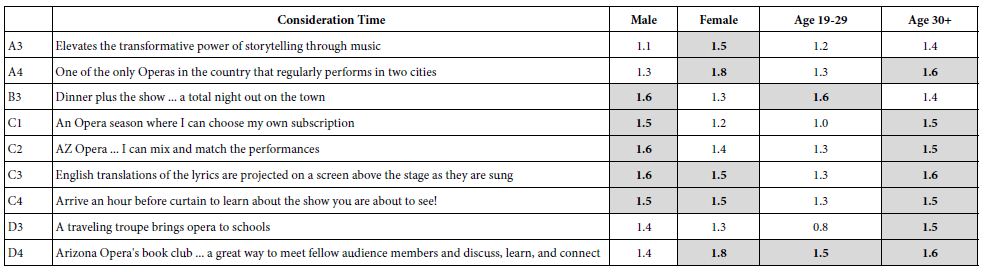
Males – engaged strongly by five of the elements, with the most engaging elements dealing with what the person can do. That is, males are engaged by elements which get the reader to think about what to do.
Females – engaged strongly by five elements, with the most engaging elements dealing with learning and discussing.
Age 19-29 – engaged strong by two elements, both focusing on socializing.
Age 30+ – engaged strongly by seven elements, combining both the act of creating one’s series, and the act of learning and seeing others learn.
The Two Emergent Mind Sets Based on Interest
The clustering program generated two mind sets, based upon ‘interest’ (TOP3). Table 6 shows that many of the elements are strong performers, albeit in only one of the two mind-sets. Mind-Set1 can be labelled those who are interested in the educational aspects of the opera. Mind-Set 2 can be labelled those who focus on the entertainment experience.
Table 6: Performance of the 16 elements across the two mind-sets. MS = Education Focused, MS2 = Entertainment Focused.
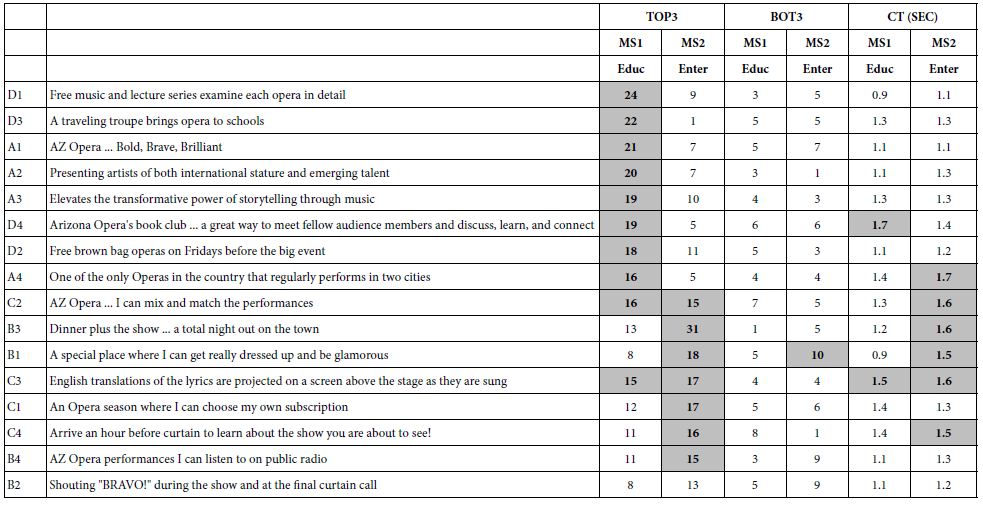
It is clear from Table 6 (columns labelled TOP3) that what strongly appeals to one mind-set (e.g., education) tends not to appeal to the other mind-set (viz., entertainment). Furthermore, the strong and rather polar nature of the elements, in terms of how they drive the response of the mind-sets, suggests that there are at least two clear groups in the world of respondents to whom one must appeal. What appeals to one mind-set will not generally appear to the other mind-set.
When we turn to what does not appeal to the two mind-sets (BOT3) we see no pattern.
When we turn to what engages (Consideration Time we see that Mind-Set 2 (Entertainment) seems more likely to be engaged by what interests them, and that Mind-Set 1 (Education) seems to be less engaged by what interests them. This pattern emerges when we compare strong performing elements (high TOP3) to the level of Engagement (CT). The correlation between TOP3 coefficient and CT coefficient across the 16 elements is +0.04 for Mind-Set 1 (Education) and +0.39 for Mind-Set 2 (Entertainment). The difference in the magnitude of the correlation suggests radically different strategies to engage the respective attentions of individuals in the two mind-sets.
Finding Mind-sets in the Population
In today’s world of abundant data, a world filled with questionnaires, where interviews abound, and where it seems one can hardly do anything without a follow-up request to rate the product or rate service, one might think that we can find these mind-sets easily. The answer is that we cannot. The mind-sets uncovered above, the education vs experience mind-sets, are particular to the experience of opera. The two mind-sets may be reflections of different ways of enjoying public performances of the arts, but it would take massive efforts and monetary expenditure to establish that, and then use the findings to guide marketing. In the meanwhile, the Mind Genomics study reported here was set up, executed, and completely reported in less than three hours. The paradox is that it becomes almost a ‘trivial’ effort to establish valuable information for science and for marketing, but a very difficult, labor-intensive, resource-intensive effort to apply the findings. Simply said, databases do not have fields for ‘the way the person enjoys the performing arts.’
Table 7 shows the distribution of respondents by mind-set, as well as by gender, age, and self-profiling of interest in opera. It is extremely difficult to predict the messages to give to a respondent, knowing gender, age, and even general behavior with respect to attending opera. The messages themselves are straightforward, emerging from the Mind Genomics effort. It is the assignment of an individual to a mind-set which is difficult. Knowing who a person “IS” does not predict how a person “THINKS.”
Table 7: Cross tabulation showing the distribution of respondents into age, gender, and responses to the up-front classification question about opera attendance. The classification information was collected at the start of the Mind Genomics experiment.
| Total | MS1 Education | MS 2 Entertainment | |
| Total | 100 | 45 | 55 |
| Gender: Male | 52 | 23 | 29 |
| Gender: Female | 48 | 22 | 26 |
| Age: 18-29 | 22 | 11 | 11 |
| Age: 30+ | 78 | 34 | 44 |
| Opera – Season subscriber | 3 | 2 | 1 |
| Opera – A few shows a year | 28 | 15 | 13 |
| Opera – Not subscriber but would like to be | 36 | 14 | 22 |
| Opera – Not subscriber, not interested | 29 | 14 | 15 |
Recently, authors Gere and Moskowitz have developed an implemented a rapid technique to assign new people to one of two (or three) mind-sets. The approach uses the basic sets of coefficients for the two mind-sets, shown in Table 6 (columns marked Top 3). The approach adds ‘noise’ to the set of coefficients, and identifies the pattern of response ‘under noise’ which best differentiates the mind-sets and reproduces the original results. This Monte-Carlo simulation is followed by the creation of a simple 6-question matrix, shown in Figure 1. The matrix requires the respondent to answer using a two-point scale, the anchors of which are chosen by the researcher. The pattern of responses of responses determines the mind-set to which the new person is assigned. The respondent begins by providing classification information, information that can be suppressed and not required if so desired. The respondent then answers the six questions in different orders to reduce order bias, as well as answering other, optional questions about the topic. Finally, the respondent submits the completed form, and immediately receives feedback regarding the mind-set to which the respondent belongs. The information is stored in a database for subsequent personalized marketing. The PVI opens up new opportunities for marketing, especially for digital marketing, which can change the content of an advertising piece as soon as the PVI assigns the new person to one of the two mind-sets.
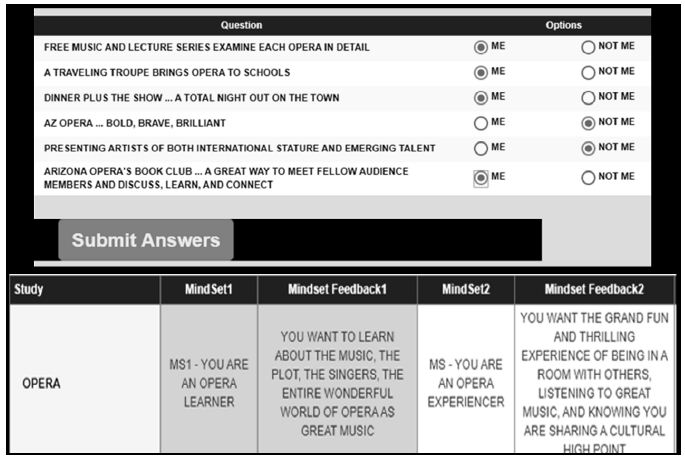
Figure 1: The PVI (personal viewpoint identifier), and the feedback to the participant.
Applying Mind Genomics Knowledge to Create an Effective Digital Media Strategy
A key benefit of the Mind Genomics science is its immersion in the world of the everyday, and the opportunity therefore to use the results in practical application. The principles emerging from Mind Genomics teach us about the mind-sets of people, in this paper the mind-sets related to opera. The elements are phrases having meaning to the average person, and thus to the potential opera fan, or at least the potential opera attendee. Unlike other types of studies to understand the person, studies which use artificial stimuli of little cognitive richness, Mind Genomics attempts to work within the structure that has every day meaning.
One consequence of the everyday meaningfulness of Mind Genomics cartographies is the potential application of the findings for opera companies in social media, the application being called ‘digital media strategy.’ Digital media strategy divides into two areas, paid advertising where the goal is to directly broadcast to convince the audience, and organic digital strategy with content placed on websites and other media, which convince by the nature of the facts conveyed, and their efforts to inform.
Let us first look at the ‘Organic Digital Strategy,’ namely websites and social media other than paid advertising. This organic digital strategy typically constitutes the foundation of an organization’s ONLINE presence. It is difficult, if not impossible, to segment individuals on social media platforms, at least in terms of the specifics for the opera. The optimal strategy for the Arizona Opera would thus be to use the most persuasive language across the Total Panel. It is here, at the stage of messaging, that the granularity of Mind Genomics does best. The four strongest performing elements promise the greatest positive response, in the absence of any additional information. These are the specific messages:
A3: Elevates the transformative power of storytelling through music
B3: Dinner plus the show… a total night out on the town
C3: English translations of the lyrics are projected on a screen above the stage as they are sung
D1: Free music and lecture series examine each opera in detail.
Using this language ensures the highest probability of converting website visitors and social media followers to Arizona Opera attendees and subscribers. The elements which strongly resonate across all viewers can enhance the “About” section of the Arizona Opera’s social media channels and website, executed through the captions of the content (e.g. images, videos, and GIFs), as well as within the content itself.
Paid Digital Strategy synergizes with the organic digital efforts but produces benefits regardless of the organic strategy. For the Arizona Opera, the likelihood of high returns may be accomplished by focusing the advertising budget on Facebook Ads, especially when the ads can be targeted to specific demographics of age and gender, with the proper messages. The messages below show elements with coefficients around 20 or higher for each group. These messages are expected to perform best. Note that the four demographic subgroups show different numbers of strongly appealing messages. Other elements may be substituted, but may be expected to perform less impactfully (Table 3). The key benefit here of Mind Genomics is the ability to provide a reservoir of possible messages, each pre-tested, at least in the Mind Genomics experiment.
Males
B3 Dinner plus the show … a total night out on the town
Females
B3 Dinner plus the show … a total night out on the town
C2 AZ Opera … I can mix and match the performances
D1 Free music and lecture series examine each opera in detail
Age 19-29
B3 Dinner plus the show … a total night out on the town
D1 Free music and lecture series examine each opera in detail
Age 30+
B3 Dinner plus the show … a total night out on the town
The data presented here provide the opportunity to create a potentially powerful, and more individualized campaign. One example is a campaign working with Facebook. Within Facebook Ads, marketers who create conversion campaigns can track the path of user behavior. Using the example of Arizona Opera ad, it is first seen on a social media platform. The ideal end of the path is the purchase of a ticket. By launching a campaign, Facebook’s ‘internal learning processes’ discover the commonalities (known to Facebook) among those individuals who purchase the tickets to the Arizona Opera. The operating assumption is that ‘birds of a feather behave similarly,’ i.e., people who are like each other will act similarly. The belief is that by finding out what is similar among those who purchased tickets for the Arizona Opera, one can fine-tune the advertising, selecting only people with similar profiles, at least profiles known to Facebook.
The PVI, personal viewpoint identifier, makes a contribution to digital marketing campaigns, albeit in a different way. By knowing the mind-set of an individual, either ahead of time from a previous campaign, or during the current campaign, the marketer for the Arizona Opera need not invoke the learning algorithm. One already knows far more about the opera-relevant messages for the individual, and need only pull out the appropriate messages, either for Mind-Set 1 or Mind-Set 2. Thus, the combination of topic, speed and ease of Mind Genomics knowledge development, and the deployment of the PVI, produce a new vista for digital marketing.
Discussion and Conclusions
The combination of arts marketing and Mind Genomics opens up a new opportunity to understand people, as well as to enhance the cultural offerings of a region. The literature of arts marketing provides a sense of the ‘touch points’ of a relatively ambiguous topic, the topic being an entity which is both a business and a social good. Arts marketing is vital for the culture to maintain its soul and vitality, but at the same time arts marketing is a business, feeding people and organizations.
The introduction of Mind Genomics to the issues involved in arts marketing, typified by the study of the messaging for the Arizona Opera, suggest that it may be possible to move arts marketing to a new level of effectiveness by understanding the mind of the prospective opera-goer. Mind Genomics provides solid, concrete, and specific knowledge about a person’s response to messages about opera. The academic foundations of Mind Genomics, especially those studying trade-offs and choice (Green & Srinivasan, 1991) are enhanced by focus on everyday decision making using our ‘fast thinking’, viz., System 1, in the words of Nobel Laureate psychologist, Daniel Kahneman (Kahneman, 2011). The two emergent benefits are, respectively, a deep understanding of the topic for science and arts, as well as a practical database to drive a person’s behavior by the proper messaging.
As the present study shows, such information can move from question to study to results, and even to the PVI, in a matter of a day or even a few hours. The output of one of these studies can help the opera, as well as provide deep information about the mind of the opera-goer, or prospective opera-goer. The output of a set of these studies provides a fuller profile of the mind of the typical person with respect to the performing areas, and, in turn, what effective messages should be communicated. Finally, putting the data about mind-set into the digital marketing effort, as customer-volunteered information, means that the marketing efforts are directed at people with similar mind-sets, not similar demographics.
References
- Butler P (2000) By popular demand: marketing the arts. Journal of Marketing Management 16: 343-364.
- Colbert F (2003) Entrepreneurship and leadership in marketing the arts. International Jouqrnal of Arts Management 6: 30-39.
- Diggles K (1986) Guide to Arts Marketing: The principles and practice of marketing as they apply to arts. London: Rhinegold Pub. Limited.
- Gofman A, Moskowitz H (2010) Isomorphic permuted experimental designs and their application in conjoint analysis. Journal of Sensory Studies 25: 127-145.
- Green PE, Srinivasan V (1990) Conjoint analysis in marketing: new developments with implications for research and practice. Journal of Marketing 54: 3-19.
- Heller B (1986) Statistics for experimenters, an introduction to design, data analysis, and model building: GEP Box, WG Hunter and JS Hunter, John Wiley and Sons, New York, NY. 1978.
- Hirschman EC (1983) Aesthetics, ideologies and the limits of the marketing concept. Journal of Marketing 47: 45-55.
- Jain AK, Dubes RC (1988) Algorithms for Clustering Data. Prentice-Hall, Inc.
- Kahneman D (2011) Thinking, Fast and Slow. Macmillan.
- Moskowitz HR, Gofman A (2007) Selling blue elephants: How to make great products that people want before they even know they want them. Pearson Education.
- Moskowitz HR, Gofman A, Beckley J, Ashman H (2006) Founding a new science: Mind genomics. Journal of Sensory Studies 21: 266-307.
- Moskowitz HR (2012) ‘Mind genomics’: The experimental, inductive science of the ordinary, and its application to aspects of food and feeding. Physiology & Behavior 107: 606-613. [crossref]
- Rados DL (1996) Marketing for Nonprofit Organizations. Praeger Pub Text.
- Venkatesh A, Meamber LA (2006) Arts and aesthetics: Marketing and cultural production. Marketing Theory 6: 11-39.