Abstract
A total of 377 respondents from three countries (France, Germany, UK), selected pizza as a product of interest from a set of 30 different food products, and immediately participated in an approximately 15 minute experiment executed on the internet, the study one in the either French, German or UK English, depending upon the country.. Each respondent evaluated an individualized set of 60 different vignettes about pizza, the vignettes constructed according to a single basic experimental design, that design ‘permuted’ to create different combinations. The elements or messages within the vignette came from answers to four questions, each question addressing a different topic (Question A = product feature; Question B = consumption features; Question C = emotion benefits; Question D = tag lines and sales/restaurants appropriate for each country). Each respondent rated each vignette on a 9-point rating (1=does not crave. 9=craves the product as described). The initial analysis generated an additive model for each respondent, showing the contribution of each element to overall craveability. The three countries showed differences but without a clear underlying pattern. Clustering the respondents by the pattern of their individual coefficients generated clearer differences. Clustering the respondents first into two segments, then three segments, then four segments, five segments, and finally six segments revealed two general behaviors. The first behavior, emerging from Question B (venue) and Question C (emotion) can be labelled ORDERLY. No major surprises occurred for four, five and six segments. Most of the learning occurred for two or three segments. The second behavior emerged from Question A (food feature) can be labelled as DISORDERLY. For two or three segments, certain elements were important, other elements were not. When 4-6 segments were extracted, previously unimportant elements now became important. The disruptive emergence of elements with more segments of respondents (mind-sets) based on product features confirm the fact that in most countries, products like pizza will most easily be differentiated on the basis of flavor, allowing the marketer to identify new, promising products to introduce. Using venue and emotion will be less successful because it is likely that no previously poor-performer is likely to become a strong performer when more segments are uncovered.
Introduction – Mind Genomics and the Experimental Analysis of Preferences
Mind Genomics is a newly emerging branch of psychology focusing on the decision-making process for the world of the everyday. Mind Genomics works with the situations facing people every day. The goal of Mind Genomics is to explore, the everyday, how we make decisions, and how people differ from each other in the way they make the decision. Mind Genomics does not alter the world of the respondent to identify key factors driving decisions, although it could. Rather, Mind Genomics works with statements about issues and situations of everyday life, looking for the patterns without disturbing the situation. In contrast, experimental psychologists often put people into artificial situations, seeking to isolate phenomena of interest, and manipulate those phenomena as permitted by the artificial situation.
Mind Genomics traces its heritage to three different disciplines:
- Psychophysics, an early branch of experimental psychology, with the goal to understand how we perceive the outside world and how that physical world is transformed into of perception [1]. A typical psychophysical study of the traditional type concerns the sweetness of a soda versus how much sugar is in the soda. Psychophysics looks for the relation between physical ‘intensities’ and subjective ‘intensities’.
- Consumer research and opinion polling, which focus on what people do in their daily, relevant world [2]. Mind Genomics also focuses on the presumably more serious worlds of society, education, the law, medicine, and so forth, aspects dealing with society.
- The world of statistics, especially experimental design [3]. Mind Genomics sets ups simple-to-execute experiments, with either real stimuli, or with stimuli described as terms. These stimuli comprise systematically combined variables, often simply messages on a variety of topics.
In the actual implementation of Mind Genomics, the approach becomes a template. The researcher identifies the topic, creates a set of questions which ‘tell a story’, creates answers to the questions in the form of short, declarative statements, and then combines these answers into vignettes according to an underlying plan, the aforementioned experimental design. The researcher presents the respondent with these vignettes in a randomized order, and obtains a rating from the respondent. Each respondent evaluates a different, and unique set of vignettes, rather than re-evaluating the vignettes presented to another respondent.
The respondent, confronted with the systematic variation, cannot simply select a strategy and remain with it because the vignettes, the combinations keep changing. By presenting the respondent with these systematically created combinations of messages as the test stimuli, and by instructing the respondent to rate the combination, the researcher forces the respondent into the type of situation the respondent typically faces, viz., a set of compound stimuli of varying composition, where the respondent must abstract the relevant information without any hint of what is expected, what is ‘correct’, and so forth. In other words, the test situation mirrors everyday life.
This approach, combining the test stimuli, presenting them to a respondent, measuring the response, and deducing how the different features of the stimuli drive the response, constitutes the ‘secret sauce’ to Mind Genomics. The experimental design enables the researcher to pinpoint the drivers of response to the vignettes, and the magnitude of those drivers, using statistics appropriate for experimental design.
The Mind Genomics approach has been templated, and made available to the public for one specific, easy to use experimental design, the so-called 4 x 4 (Topic, four questions, answers to each question). The website is www.BimiLeap.com
Mind-sets as a Key Output from Mind Genomics
Beyond the experimentation, which allows the researcher to understand everyday behavior, albeit in controlled conditions through messages, emerges the second key output of Mind Genomics, namely different ways of looking at the same test stimulus. We are accustomed to the compound and complex nature of the external world. We also recognize at an intuitive level that people respondent to different parts of the world to which they are exposed. The power of Mind Genomics is that it specifies these different ways of looking at the world (mind-sets), finding out what is important to various groups (mind-sets), and the nature of these mind-sets (viz., WHO has the mind-sets, do the mind-sets change, etc.).
From many studies published using Mind Genomics in a variety of topics, ranging from health to law to food, to stores, to beauty, and so forth, clearly different groups of mind-sets emerge. The mind-sets emerge based upon the statistical method of clustering [4]. Clustering is an easy-to-implement approach for data emerging from Mind Genomics. Each respondent generates a model, an equation. The equation is expressed as: Rating = k0 + k1 (A1) + k2 (A2)…kn (An). The number of coefficients is a function of the number of elements or messages tested. Often the rating is transformed to a binary value (0/100) because managers understand binary (no/yes) more easily than actual rating values on a 9-point scale. The equation, whose parameters are estimated for each respondent, thus becomes the foundation for a database.
The statistical analysis underlying the discovery of the mind-sets is primarily ‘objective,’ viz., without reference to the content. Only the selection of the number of mind-sets and the naming of the mind-sets require the researcher to offer an input. The goal is to extract as few clusters or mind-sets from the data (parsimony), while at the same time ensuring that the mind-sets make sense.
In virtually every topic explored with Mind Genomics, with one exception (murder from the legal point of view) [5]; the abovementioned approach generates often, two or three, occasionally four different clusters (viz., mind-sets of respondents). These clusters appear to be meaningful, viz., they ‘tell a story’, and the stories are usually coherent, although not necessary ‘crisp.’ They ability to generate different groups of respondents is remarkable because 2-3 different groups emerge again and again. The effort does not product perfect clusters, a production which that requires an artist ‘sculpting the data’. The clusters are certainly not perfect, however, often incorporating elements or messages which seem not to belong.
Mind Genomics, specifically the search for mind-sets to understand the experience of the everyday, has started to address other issues such as how to uncover small groups of individuals in the populations, rather than large basic groups. In one of these studies, conducted in 2010, the focus was to discover a group of respondents who would be positive to the then-novel idea of health insurance for animals. The Trupanion Corporation approached the author with the request to investigate the world of pet owners, seeking a group that would be positive to animal health insurance. The analytic approach was kept simple. The strategy was to work with a large group of pet owners as respondents, and carry out the clustering beyond three and four clusters, to six clusters. That that point, database would be increasingly segmented, until a clear group of respondents emerged whose coefficients suggest strong interest in and acceptance animal insurance. The validity of the approach was demonstrated by the significantly growth of sales (100%), call center conversion rate (40%), web sales (25%, field sales (50%) [6].
A similar type of issue emerged two years later, in 2012, with the issue of what makes a product ‘taste great’. The focus of this second issue was to discover, if possible, a group of respondents to whom ‘texture’ rather than taste/flavor, was the most important. Once again the strategy was to extract an increasing number of clusters or mind-sets until a cluster emerged which showed the highest coefficients for the elements describing texture. The high coefficients, specifically much higher than those for appearance, aroma, and test, was assumed to represent texture-oriented respondents [7].
Applying Mind Genomics to Study Pizza
The importance of pizza to the world of eating cannot be overestimated. Every town, village, and of course every city can boast of at least one, often two and sometimes more outlets which sell pizza to consumers whether selling complete pizzas, selling slices (e.g. along with a beverage), or simply sell pizza as one of their products. The academic literature on pizza is large, because it is so popular, providing a substrate which can accommodate different ingredients as ‘toppings,’ these ingredients often driven by cultural norms [8-11].
Pizza provides an idea topic to study food preferences using Mind Genomics. The product is simple, easy to describe, has evolved in a number of directions, ranging from the cheese to the non-cheese ingredients. The changes in the product can be described in words, making it possible to study pizza through the text-based description of the product.
In light of the increasing competitiveness in the food world, a competition in 2003-2004 which now seems slow, the McCormick Company of Hunt Valley, Maryland, USA invested in a set of studies about the response to products, with the information about the product (features, venue, emotion, outlets and tag lines) embedded in short, easy-to-read vignettes, assembled according to an underlying experiment design [12]. Each respondent evaluated a unique set of 60 vignettes, comprising 2-4 elements, one from each type of information about the product (e.g. one product feature, one outline, one emotion, etc.). This strategy produced a great deal of information about the reactions of respondents to the different vignettes (viz. combination of elements).
The approach was called the It! study, which has been extensively discussed in previous papers [13,14]. The It! approach allowed the respondent to select a topic of interest from a ‘wall of products’, so that respondent was interested in the product to begin with the studies that we will address here come from the second-generation of the Crave It! studies, which we called Eurocrave. The studies were done with the same products, and mostly but not all the same elements across three countries (France, Germany, UK).
The data reported here come from the set of It! studies called Eurocrave, run in 2002 in France, Germany and the UK. The Eurocrave studies comprised 30 studies, the same 30 studies in each of the three countries, with the same raw material (elements), except for store outlet. Store outlet was particularized to the country.
The respondent was invited by a local field service. There were 30 studies available for the respondent, who could only choose one. As soon as 130 respondents selected a study, and completed that study, the study temporary ‘disappeared’ from the of available studies from which one could choose. Figure 1 thus shows the 19 available studies in Germany, 11 studies having been completed for Germany. The respondent was sent to the study chosen. The study had to be complete in order to count against the quote of 120 respondent [15].
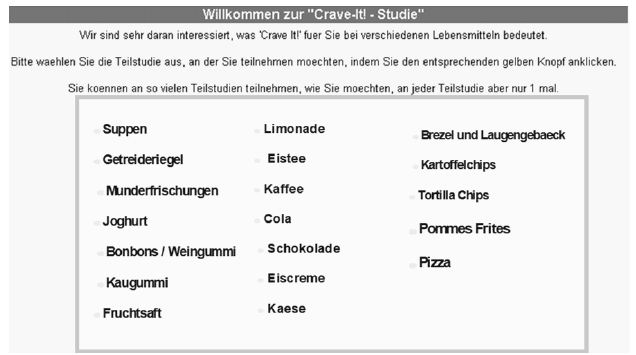
Figure 1: The ‘wall’ of available studies for the German Eurocrave project
Moving to specifics, Table 1 shows the four questions for pizza, and the nine answers or elements for each question. Combinations of these text elements will become the stimuli that will be evaluated by the respondents. These combinations are known as vignettes. A hallmark of Mind Genomics is the effort made to have the elements present word pictures, not just simple phrases. That is, the elements or answers should paint an evocative picture involving pizza. The four questions provide a narrative of one’s experience with pizza.
Table 1: The 36 elements for pizza, shown in four groups. The respondent only saw the text, not the group, viz., not the organizing principle
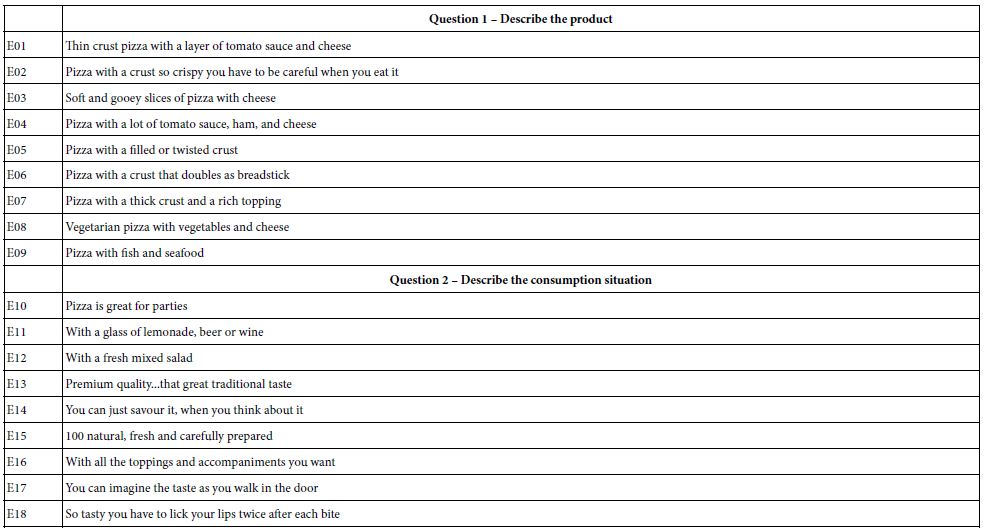
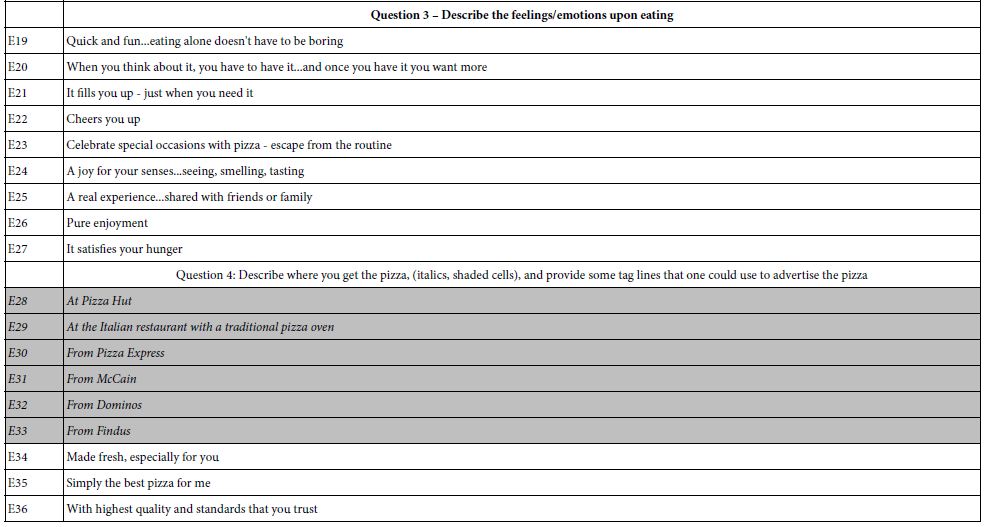
The Mind Genomics process executed in the early years of Mind Genomics (1996-2006), used a large experimental design, known as the 4 x 9, four questions or aspects, each with nine different elements. The 4 x 9 design involves 36 different elements, shown for pizza, in English. Table 1 shows these elements. As noted above, the elements present the outlets (Elements E28-E33) were particularized for each country, comprising the relevant outlets for those countries. The data from Question (E27-E36) will be used in the preliminary analysis in this study, but not discussed in the results, because of the difficulty of comparing across countries.
It is important to note that the Mind Genomics effort is not a single, final study which proposes to quantify the way people think about a product, in this case pizza. Rather, the Mind Genomics effort is simply an experiment, one experiment in a series when so desired, with the experiment showing concretely the importance of the element as a driver of attitude.
Once the elements have been chosen and polished, the next step is to combine these elements into small combinations, as noted above, the so-called vignettes. The rationale for vignettes are that we typically don’t see sequences of single ideas, one after another, to which we must react. Rather, we see combinations of pieces of information, often combinations which appear to be haphazard, or at least we fail in the short time allotted to uncover the pattern below the combinations. Yet, again and again we emerge unscathed from what seems to be hard to discuss, namely haphazard combinations. We react, and often don’t even realized the nature of our thinking.
The Mind Genomics was designed eliminate two biases. The first bias is that one-at-a-time presentation of messages is simply not the way we work. We are gluttons for information, of all types, mixed in ways.
The second bias is that we unconsciously adjust our thinking to accommodate the nature of the stimulus. We do not judge all stimuli the same way. For example, brand names are judged differently than product performance. The criteria we used to judge brand names versus product performance are different. The rationale, perceptive individual will adjust her or his criteria depending upon what particularly is being evaluated. For example, were we to read only the individual elements in Table 1, rating one element at a time, it might be easy to adopt different criteria, depending upon the specific element. If the respondent were answer elements from the set of E1-E9, the respondent might adopt the criterion of ‘do i like the flavor’. In contrast when it comes to the third set of elements (E19-E27), the criterion would not be ‘liking’, but rather fun to eat in a situation. The change in criterion might be quick, virtually unconscious, but sufficient to create a situation where the assessments might not be commensurate because the respondent uses different criteria, such criteria a function of the specific nature of the single message presented. What we measure, as a result, may seem like it should be valid because the respondent does the operation, but the validity might be a chimera, a false result.
Each respondent in the study is exposed to these elements, but in the form of vignettes. The vignettes are combinations of elements, as specified by an underlying experimental design. The design specifies combinations of 2-4 elements. Each vignette, the aforementioned combination, comprises at most one element from each group, but often the vignette is lacking one or two elements.
The specific structure of the vignettes, defined as the underlying experimental design, comes to 60 different combinations. Each respondent tests a different permutation of the basic design. That is, the mathematical structure of the 60 vignettes remains the same, but what changes is the specific set of 60 combinations. This strategy, working with a fixed design that is permuted, ends up having three key benefits:
1. Ability to Work with the Rating Scale, to Simplify it for the Manager
As noted above, the ratings, assigned on a 9-point scale (1=do not crave at all…. 9=crave extremely) are converted to a simpler binary scale (ratings 1=6 converted to 0, ratings 7-9 converted to 100). It will be these binary transformed ratings that will be used as the dependent variables in the individual-level and group models. After the transformation, a vanishingly small random number added to each transformed value (value < 10-5), in order to ensure that the binary transformed rating always shows some variation across the 60 vignettes evaluated by a single respondent.
2. Create a Model (viz., Equation) for Each Individual Showing How the Elements ‘Drive’ the Rating
Each respondent tests just the correct combinations to allow statisticians to estimate the contribution of each of the 36 elements to the rating. This is called a permuted design [12]. The ability to do the statistical modeling down to the level of a single respondent is very important. One does not need to balance the sample, and go through other ‘gyrations’ to ensure that the study is balanced The typical equation is expressed as: The typical equation is written as: (Binary Transformed) Rating = k0 + k1 (E01) + k2 (E02)…kn(E36).
3. No Requirement that the Researcher ‘Know’ the Correct Region to Test
The typical experiment covers so little ground that the typical experiments ends up validating the ingoing hypothesis of the researcher, rather than exploring and learning. In effect, the research focuses on a microscopically small volume of the possible design space. In contrast, with Mind Genomics, each respondent provides unique data, not provided by the other respondents. Each respondent provides a separately oriented snapshot of the mind of the respondent. The result is coverage of a lot of the possible combinations, albeit a coverage achieved with the aid of the many respondents. A good metaphor for the approach is the MRI used in medicine, which takes snapshots of the same tissue from different angles, and then reconstitutes a single snapshot of the tissue through computer analysis.
Coefficients for Product Elements (Total vs. Countries vs. Mind-sets)
Our first focus will be on the coefficients achieved by E01-E09, the nine elements presenting information about the actual product itself, viz., the ingredients and the form. To summarize the analytic strategy, All data presented in Table 2 come from abstracting the coefficients for the individual models, these models having been created from the data for one respondent across the 60 vignettes, the 36 elements, and the rating scale transformed to a binary scale (0/100; ratings of 1-6 → 0; ratings 7-9 → 100).
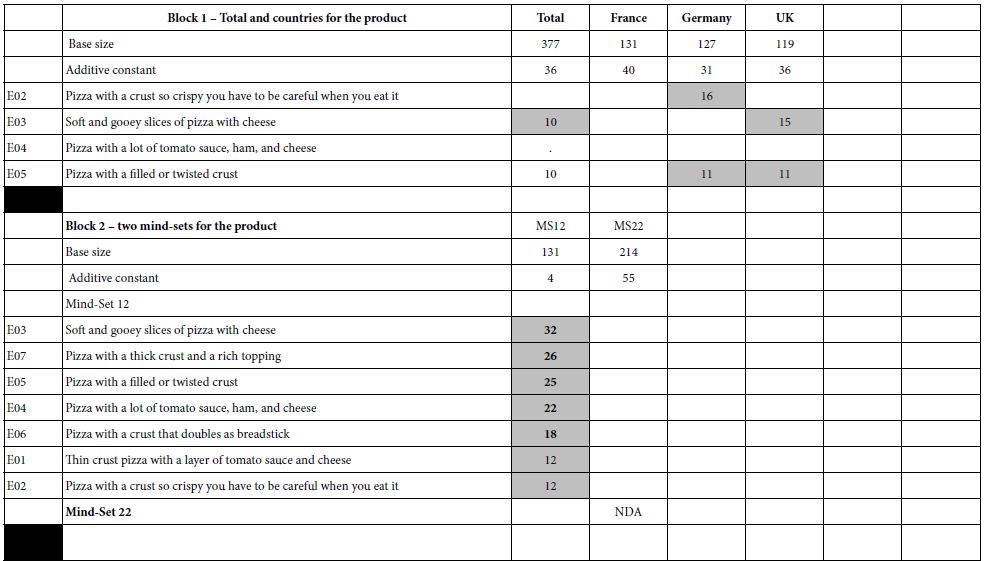
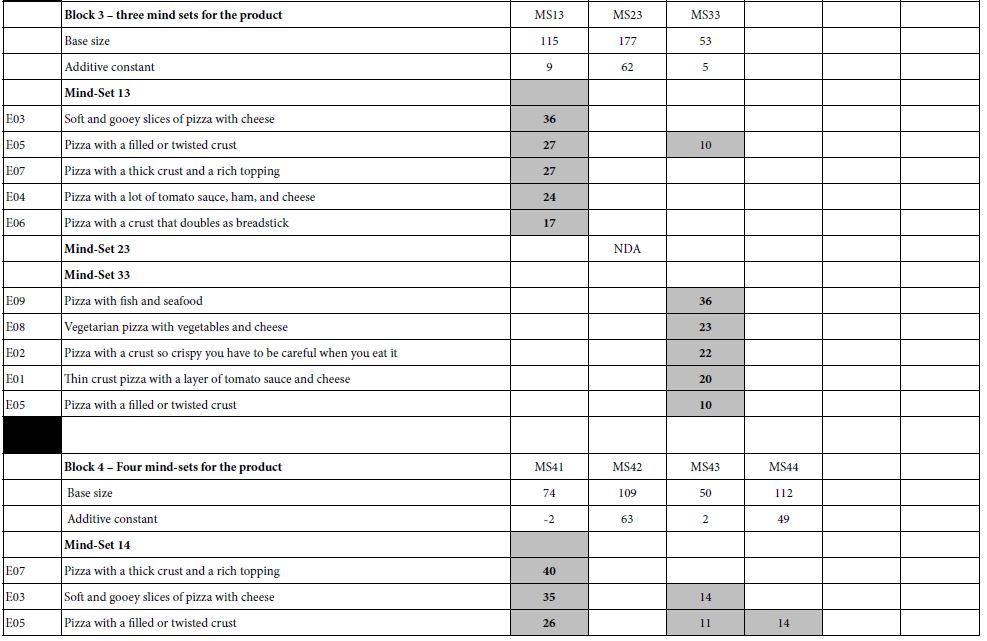
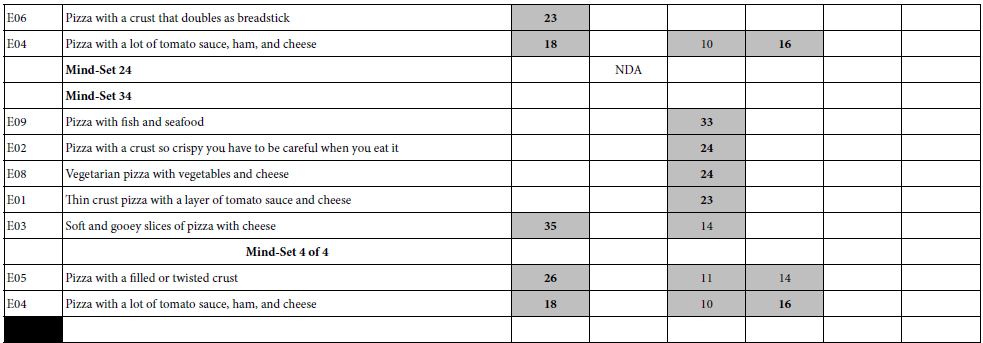
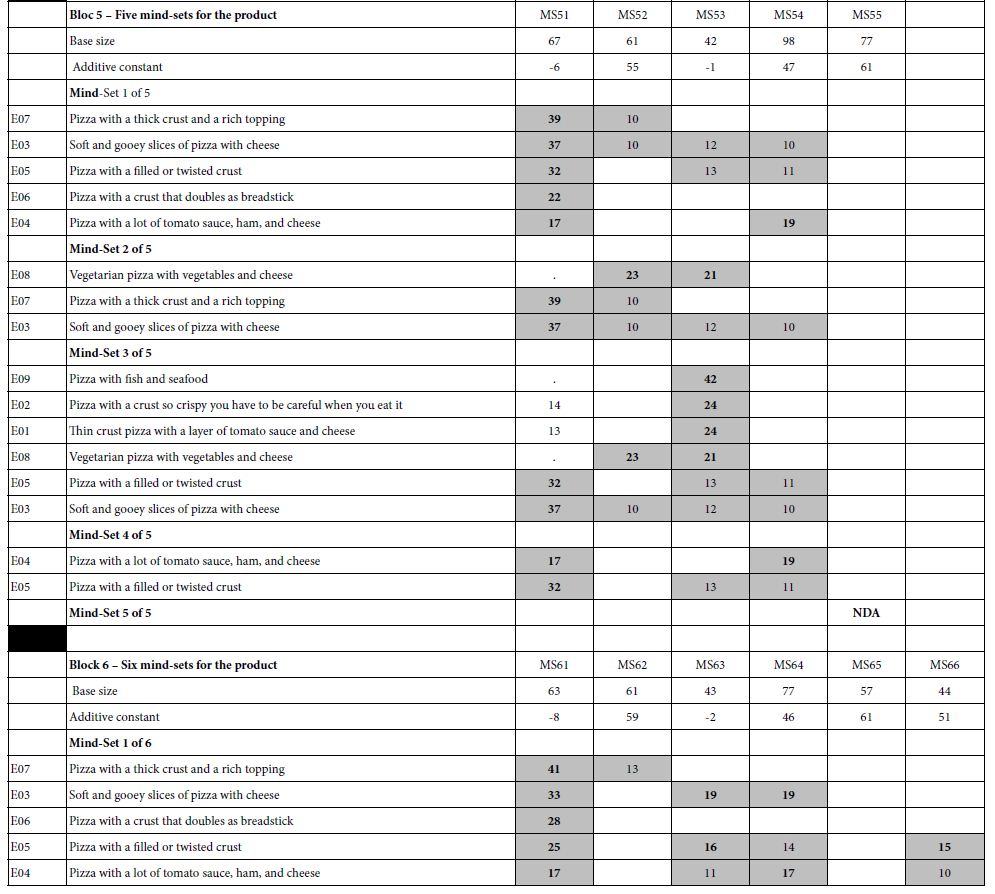
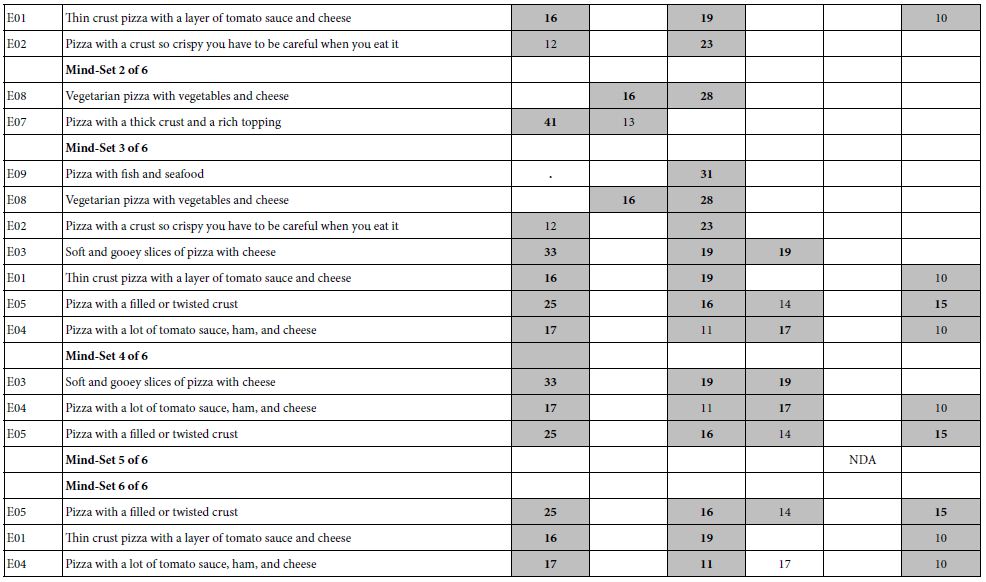
Table 2: The coefficients for the nine description-based elements for pizza (E01-E09), and the additive constant. The numbers in the body of the table are the coefficients from the OLS (ordinary least-squares) models or equations relating the presence/absence of the elements to the transformed overall rating. The table only shows element coefficients of +10 or higher.
Mind Genomics studies ‘throw off’ a great deal of data. For most studies, it has become increasingly clear that the best way to discern patterns is to estimate all the coefficients, but then only focus on the coefficients which are strong. The large positive coefficients are the key elements which ‘drive’ the response. The small positive and many negative coefficients are harder to interpret, often adding noisy to what would otherwise be an easy naming.
Table 2 shows the coefficients for E01-E09, for six blocks of results. Recall that elements E01-E09 are features of the pizza. For the individual models, only coefficients of +10 or higher are shown. These coefficients are statistically significant, approaching a t-statistic of 2.0. The additive constant is shown for every key subgroup, however,
Block 1 = Total panel, France, Germany, United Kingdom
The data in Block 1 come from the coefficients for the total panel, without any further processing. The acceptance of pizza ranges from a low of 31 (Germany) to a high of 40 (France). What emerges is the modest acceptance of pizza without any elements, as shown by the modest-sized additive constant. It will be the elements which generate the acceptable.
It should not come as a surprise that when we deal with foods, the strong performing elements are those which present information about the product itself, the constituents, viz., and the ingredients. These elements are ‘concrete’, painting a word picture. For most food and beverage products, these are the elements which excite the consumer, even when the elements are embedded in a vignette with other information.
For the total panel, only two elements even reach the coefficient value 10: Soft and gooey slices of pizza with cheese and Pizza with a filled or twisted crust. It is important to keep in mind that these two elements deal with form, and do not invoke unusual flavors.
Blocks 2-6 (Clustering to Generate Mind-sets, viz., Segments of Respondents with Similar Patterns of Coefficients for Elements E01-E09
The initial analysis to generate the coefficients was done on the complete data-set for each respondent, viz., all 60 vignettes for the data base, and all 36 elements as independent variables. Thus each respondent generated a totally separate model, made possible by the previously discussed individual-level design. For the analyses in Blocks 2-6 m only the coefficients for E01-E09 were used in order to create the clusters, viz., and the mind-set. The method used was k-means clustering [16], with the measure of distance between pairs of respondents computed on the basis of the expression (Distance = 1-Pearson Correlation). It is important to emphasize that the clustering is done without any preconceived bias. The clustering algorithm is strictly an algorithm with no need to know the ‘meaning’ of the variables that it is using in its mathematical computations.
Block 2 (Two Mind-sets)
The simplest clustering using k-means clustering, ended up dividing the respondents into two groups, the basic likers (Mind-Set 22), and the feature likers (Mind-Set 21). Mind-Set 22 is larger, likes but does not love pizza (additive constant 55), and is indifferent to the features of the pizza. That is, no element emerge with coefficients over +10. In contrast, the smaller group Mind-Set 21), constituting approximately 1/3 of the respondents, shows a no general desire for pizza in the absence of elements (additive constant 5), but with a strong desire for the features of traditional pizza, Four examples of the exaggerated response by Mind-Set 21 to features (coefficient > 20) are:,
Soft and gooey slices of pizza with cheese
Pizza with a thick crust and a rich topping
Pizza with a filled or twisted crust
Pizza with a lot of tomato sauce, ham, and cheese
Block 3 (Three Mind-sets)
Mind-Set 32 is interested in pizza in general (additive constant 62), but does not find any of the product features very interest. In contrast, Mind-Sets 31 and 33 show low basic interest in pizza (additive constant 9 and 5), but strong interest in specific features of the product. Mind-Set 31 appears to want the more traditional features of pizza, whereas Mind-Set 33 appears to want to more ‘unusual features.’ It is important to keep in mind that these differences are not imposed on the data, but emerge from the patterns across people and countries.
Block 4 (Four Mind-sets), Block 5 (Five Mind-sets), and Block 6 (Six Mind-sets)
These three additional clusters, again based only on the coefficients for E01-E9, show similar patterns.
a. One of the mind-set clusters shows a high additive constant, meaning that the respondents like all of the pizza ideas. This cluster, however, shows no elements describing the pizza which score very well. This cluster with the high additive constant is the non-discriminating, acceptor, abbreviated NDA.
b. The remaining mind-sets show different, unpredictable patterns, with low additive constant, but with some specific product elements presenting a very high coefficient.
c. An element can perform poorly with total panel, and with two or three mind-sets, viz., demonstrate a low positive coefficient, or a negative coefficient, but with more mind-sets extracted this poorly performing element, one that might be overlooked, might suddenly become promising. An example is: Pizza with fish and seafood.
d. Table 2 suggests that the dynamics of the system are complicated. An element may be irrelevant until a sufficient number of mind-sets or clusters are allowed, at which point the element shows its strength, and for one mind-set the element generates a high coefficient, whereas for the other mind-sets this previously ‘minor’ element remains minor.
e. The key word here is unpredictability. The lesson is the possibility of identifying mind-sets, albeit as an exercise in data analysis, and the practical use of the clusters for formulating marketing strategy. What is disappointing is the lack of specific, repeated patterns emerging from the clustering, patterns that could for the basis of a culinary psychology of pizza.
The Deeper Dynamics of Elements as Drivers of Mind-sets
It may well be that a different way is needed to understand the way elements perform. Rather than looking at the coefficient of the element in different arrays of mind-sets (viz., 2 vs. 3 vs. 4 vs. 5 vs. 6), an alternative way looks at the variability generated by the element vs. error, and seeing how much real variability the generates with increasing number of mind-sets. This second way computes the F ratio for each element, with the F ratio being a measure of signal to noise. Higher F ratios mean that the element really ‘drives’ the segmentation. Lower F ratios mean that the element does not ‘drive’ the segmentation.
For this analysis, we look at the three sets of elements (Question A – product features; Question B – Consumption Occasions; Question C – Emotional benefits and outcomes.). We do not look at Question D because the elements for the ‘purchase location’ (E28 – E33) changed by country.
The analyses are done separately question, following the approach below. We describe the approach for one of the three sets of elements. The same approach is applied separately to the other two sets of elements.
- For each question, collect all the sets of nine coefficients across all the respondents. Each respondent generates a row of nine numbers, one cell for each element. This step generated three data sets, based on elements E01-E09; E10-E18, and E19-E27, respectively,
- For each question separately, cluster the respondents, using the appropriate set of elements and their coefficients., Use k-means clustering as one before, with the distance between pairs of respondents defined as (1-Pearson R computed on the nine corresponding elements for the two respondents). Do the clustering five times, extracting first two clusters, then separately three clusters, then separately four clusters, then separately five clusters, and finally separately six clusters. The term ‘separately’ is repeated to emphasize the fact that the clustering starts anew each time.
- Estimate the F ratio for each of the nine elements. The magnitude of the F ratios is a measure of the degree to which the element ‘drives the segmentation.
- Keep in mind that the data set is balanced in terms of respondents. Thus, we have removed the subject effect, and dealing only with the degree to which the element drives the segmentation.
When we follow this protocol, computing the F ratio for each element when the clustering goes sequentially from two to six mind-sets, we uncover the deeper structure, viz. a structure which may truly underlie the different groups. Table 3 shows the F ratios for each of the 27 elements, computed for the five sequential clustering. Each clustering generates a set of 27 F ratios.
Table 3: F ratios for elements emerging from the clustering. High F ratios mean that the element is a strong driver of the classification. All F ratios of 10 or higher are shown in in a shaded ell
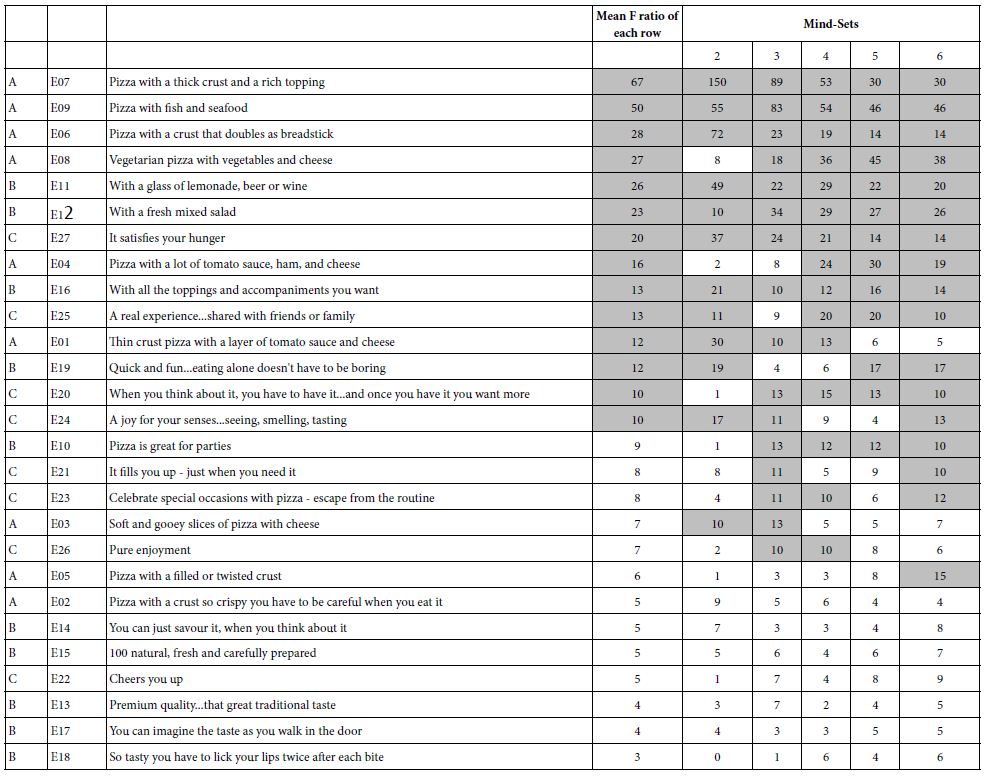
Keeping in mind that the F ratio is a measure of signal to noise, we can sort Table 3 five times, each time identifying the two (or more) strongest performers. The structure below begins to emerge, suggesting that there are two strong groups; traditional pizza and pizza with fish and seafood. There may be more, but these are the repeating themes.
Two mind-sets
Pizza with a thick crust and a rich topping
Pizza with a crust that doubles as breadstick
Three mind-sets
Pizza with a thick crust and a rich topping
Pizza with fish and seafood
Four mind-sets
Pizza with fish and seafood
Pizza with a thick crust and a rich topping
Five mind-sets
Pizza with fish and seafood
Vegetarian pizza with vegetables and cheese
Six mind-sets
Pizza with fish and seafood
Vegetarian pizza with vegetables and cheese
The dynamics of segmentation suggest that it is both the nature of the topic whose representatives are being segmented and the number of available segments which make a difference. An element may be less important than another when there are two or three segments, and so the less important element simply ‘goes along’. When it comes to more segment, e.g. four or five or six, this hitherto minor, unimportant element becomes important, and becomes the center of a new mindset. This finding may seem a bit awkward, but it is testimony to the fact that it is not only people differences in which are working, but the channels in which those differences are allowed to emerge. Reduce the opportunity and the segmentation waiting to flower is simply suppressed, not allowed to show itself.
The variability in preferences underlying the segmentation is clear greater for product (Question A), and then for emotion/benefit (Question C), and finally for consumption situation (Question B). One possible conclusion is that the potential segmentation is greatest for the actual product, something which manifests itself in the market today, where companies offering pizza offer different variations of them. The other groups offer the possibility of segmentation, but the F ratios are smaller. There are differences across mind-sets for a specific element, but there are few surprising re-emergences of elements as driers of segmentation when new mind-sets are opened up. The practical implication is that for marketing, most of the efforts, where possible, will be attempts to present new features of the pizza product itself.
Discussion and Conclusion
The world of foodservice is forever seeking to discover both what people like, and what they will like. There is the notion of habituation, that a stimulus which is presented again and again will lose its ability to excite [17,18]. People get bored with the same food, although the dynamics of such boredom, and habituation are yet to be worked out. One can see food trends come and go, with trend spotters looking for the latest and greatest, the cuisines, and of course the star items that will excite everyone. At the same time, observations in restaurants, especially diners with their massive choice of foods, suggest that people often stick with the same foods, no matter how big the choice. Indeed, the notion of paradox of choice has been raised to describe the observation that the larger the choice, the more conservative people become, often reverting to their favorite [19].
When we narrow our focus from the world of foods to the world of pizza we turn from a world of products people may or may not like to a world of product variations of what we might be to be a basically acceptable product. Indeed, for the most part people assume that pizza is a universally loved product, perhaps one of the most beloved in the world.
The data from this study suggest that the world of pizza comprises a universe until itself. The data suggest that there is strong differentiation among the different aspects of pizza, the strong differentiation appearing in issues involving the ingredients and flavors, less so in issues involving emotion and consumption situation.
The Pizza Study in the Context of Mind Genomics and the It! Studies
When the study was run two decades, in 2002, the ingoing assumption was that we would naturally uncover country to country differences in what people liked in pizza, especially the flavors of the pizza. It was intuitively obvious that we would not find a simple linkage between country and preference for pizza flavor. That would be too easy, too deceptive, even though one of thinks of countries in terms of ‘general preferences’, based upon the cuisines they offer. With pizza, the ingoing assumption was that we would find groups of respondents with clearly different mind-sets, different tastes as reflected in their responses to the different elements describing pizza [20], and then use these patterns of preferences to create new foods.
The structure of the worked-up data, after an interval of two decades, presents a working model of how thinking underlying Mind Genomics has evolved. The original efforts in Mind Genomics, represented most faithfully in the parallel studies known as the It! research, appeared to stop at the remarkable discovery that across products and countries, three different ‘canonical’ mind-sets would emerge, especially for foods and beverages. These mind-sets were the Traditionalists who wanted things the way they had always been; the Experientials ls who responded strongly to the description of emotions and situations; and finally the Elaborates who respondent most strongly the fancified description of the product features [13]. At the time of the initial analyses, the recurring pattern across foods sufficed excite. The patterns seemed repetitive, and worthy of report.
Over the years, however, as the data from the It! studies led to practical applications, the applications themselves opened up new issues, such as discovering relevant but numerically small groups of what would be important respondent groups. The solutions, clustering the data to smaller and smaller groups, began to provide business answers, such as the discovery of key groups. At the same, the dynamics suggested that such groups might be found in flavor, but not necessarily in packaging, and so forth. It was the demand for understanding the data in a deeper fashion which has led to the reanalysis of data, a reanalysis eminently possible because of the tight, comprehensive, balanced structure of the underlying permuted experimental design. This paper may be seen as a continuation of the early effort, using the same data, but with the experience and insight of two decades, along with the realization that these It! studies were stepping forth onto a new continent, with new horizons. This paper is a progress report, appearing two decades later.
Acknowledgment
The author acknowledges the efforts and inputs of his colleagues of two decades ago, Pieter Aarts of Belgium, and Klaus Paulus of Germany and the contribution of the late Hollis Ashman of the Understanding and Insight Group. The studies reported here were done under the aegis of It! Ventures, Inc., and are published with permission of It! Ventures, Inc.
References
- Luce RD, Krumhansl CL (1988) Measurement, scaling, and psychophysics. Stevens’ handbook of experimental psychology 1: 3-74.
- Peter JP, Olson JC, Grunert KG (1999) Consumer behaviour and marketing strategy (pp. 329-348). London, UK, McGraw-hill.
- Mead R (1990) The design of Experiments: Statistical Principles for Practical Applications. Cambridge University Press.
- Rokach L, Maimon O (2005) Clustering methods. In Data Mining and Knowledge Discovery Handbook (pp. 321-352). Springer, Boston, MA.
- Moskowitz HR, Papajorgji P, Wren J (2020) Mind Genomics and the Law, Chapter 5, Arson & Murder. Lambert Publications, Germany.
- Rubin H, Craig Wallace, Darry Rawlings (Trupanion senior management) Personal communication to Howard Moskowitz and Stephen Onufrey, June 2010).
- Moskowitz HR (2014) Mind Genomics and Texture: The experimental science of everyday life. In: Food Texture design and optimization (ed.Dar, Y.L. and Light, J.M) Helstosky C (2008) Pizza: a global history. Reaktion books.
- Jaitly M (2004) Symposium 4: Food Flavors: Ethnic and International Taste Preferences: Current Trends in the Foodservice Sector in the Indian Subcontinent. Journal of Food science 69: SNQ191-SNQ192.
- Kumar R (2015) A comparative study between Pizza Hut and Domino’s Pizza. International Journal of Marketing and Technology 5: 89-123.
- Lestari AD, Baktiono A, Wulandari A (2020) The effect of market segmentation strategy on purchasing decisions of pizza in Surabaya. Quantitative Economics and Management Studies 1: 1-8.
- Gofman A, Moskowitz H (2010) Isomorphic permuted experimental designs and their application in conjoint analysis. Journal of sensory studies 25: 127-145.
- Moskowitz MR., Ashman H, Minkus-McKenna D, Rabino S, Beckley JH (2006) Data basing the shopper’s mind: approaches to a ‘Mind Genomics’. Journal of Database Marketing & Customer Strategy Management 13: 144-155.
- Moskowitz HR, Gofman A (2007) Selling Blue Elephants: How to Make Great Products that People Want before They Even Know They Want them. Pearson Education.
- Aarts P, Paulus K, Beckley J, Moskowitz HR (2002) September. Food craveability and business implications: The 2002 EuroCrave™ database. In ESOMAR Congress, Barcelona, Spain.
- Likas A, Vlassis N, Verbeek JJ 2(003) The global k-means clustering algorithm. Pattern Recognition 36: 451-461.
- Fishbach A, Ratner RK, & Zhang Y (2011) Inherently loyal or easily bored?: Nonconscious activation of consistency versus variety seeking behavior. Journal of Consumer Psychology 21: 38-48.
- Zeithammer R, Thomadsen R (2013) Vertical differentiation with variety-seeking consumers. Management Science 59: 390-401.
- Schwartz B (2004) January. The Paradox of Choice: Why More is Less. New York: Ecco.
- Gere A, Moskowitz H (2021) Assigning people to empirically uncovered mind-sets: a new horizon to understand the minds and behaviors of people. Consumer‑based new product development for the food industry. Royal Society of Chemistry 132-149.