Abstract
The studies reported here extended the range of Mind Genomics beyond considering how people feel about a situation (homo emotionalis) to what type of economic impact would be occasioned by that situation (homo economicus). The topic here is the familiar experience of observing the behavior of the staff with each other, and with the customer, in a restaurant. Respondents rated the expected price of the check using a relative scale (25% less vs. 25% more). Shifting the focus to economic consideration revealed fewer strong performing messages, and fewer, and less clear mind-sets, based upon the pattern of individual respondents. Confirming previous unpublished observations, the data from the three studies suggest that shifting the attention of the respondent to economics rather than emotions forces the respondent into a conservative stance. Studies on pricing must take this emergent conservatism into account when attempting to understand how people actually ‘feel’ about a situation.
Introduction – From The Outside Looking In
Today’s social sciences for the most part deal with normative behavior, behavior that is typical in situations. A term for this behavior is nomothetic, from the Greek word nomos, meaning general rule or normative rule. The focus on the nomothetic can be seen from studies of how patrons think of restaurants in a general sort of way, and from the unbelievable omnipresence of customer satisfaction surveys focusing on the food, the service, the décor, and so forth [1-4]. Customer satisfaction is a growing business. The hospitality industry is one of the biggest users, in order to understand the experience, from what happens, to how it happens. For the most part, researchers use a set number of questions about the experience, breaking down the questions into responses about the décor, the server’s attitudes, the food, and so forth. In a typical survey the objective is to obtain a quick measure of the subjective impression of the restaurant, an impression which is tallied with many others to generate a profile of performance, or a set of composite scores [1]. The end result is knowledge about what is important to the customer, information relevant for journals and the science, as well as how did a specific establishment perform on a certain day, information important for business. The typical questions focus on the person’s feelings, attempting to link feelings to economic implications, such as the increase or decrease of the business.
When researchers try to understand a situation, they can avail themselves of a variety of techniques. Anthropological observation, depth interviews, focus groups, and surveys are the major tools. Most of these tools are used within the context of understanding the business as a social entity (anthropology, sociology), or as a money-making enterprise that can be analyzed and fine-tuned to increase the revenues and the profitability, as well as increase both employee satisfaction and customer satisfaction. The world of the restaurant is of continuing interest to researchers. The restaurant is a microcosm, of interest to businesspeople, organization psychologists, those in the world of food service, and so forth. There are no lack of papers and journals devoted to the world of restaurants in general, and to the world of food service in particular. Most of the papers look at the restaurant from the ‘outside,’ observing either the behavior, or asking the customer to evaluate the experience. There have been some papers looking at the mind of the restaurant consumer in some depth, moving beyond the standard surface questions [5,6]. Most of these deeper-focused papers deal with the topic from the point of view of the profession hospitality, and not from the point of view of psychology.
The Contribution of Mind Genomics to Understanding the Perception of the Restaurant Experience
Mind Genomics is a newly developing science, dealing with the nature of how we make decisions in our daily lives. Rather than focusing on unusual and artificial situations to propose or disprove a hypothesis, Mind Genomics can be better considered to be a cartography, a study of the landscape, with the goal to uncover patterns in everyday life, specifically patterns involved in the way people take in information, and make decisions. Mind Genomics differs from social psychology which observes behavior and hypothesizes inner structures of the mind and differs from experimental psychology which sets up artificial situations, measures responses, and develops hypotheses about mental processes. In contrast, Mind Genomics creates mixture of communication elements about the specifics of a topic, measures the responses to meaningful combinations of messages created according to an experimental design, and deduces the ‘algebra’ of the mind regarding how the person weights the information. Mind Genomics thus combines the methods of market research (concept evaluation), statistical design (systematic variations of combinations of messages), and experimental psychology (evaluating and deconstructing the patterns of response of respondents, viz., ‘subjects’ who participate in an experiment disguised as a simple survey).
In previous studies using the methods of Mind Genomics, the focus has been on the emotional or affective response to the test messages. These responses may either be ratings (e.g., dislike/like, not buy/buy; not believe/believer), the selection of a usage occasion or even the selection of an emotion [7]. The approach of instructing a respondent to give an opinion may be described as investigating ‘homo emotionalis,’ emotional man. In recent years, researcher have begun to consider economic aspects. In concept testing and in conjoint measurement, for example, researchers have mixed price with other features, and instructed the respondent to select the preferred combination of price + features (pairwise trade-off) or rate interest in a selling proposition about a product or a service, with price being one of the features in the proposition (concept testing). During the past two decades, author Moskowitz has occasionally explored the potential of using price as a dependent variable. The respondent is instructed to read a test concept, and instead of (or in addition to) rating the product on liking, the respondent is instructed to select a price. The analysis re-codes the rating, replacing each rating by the price attached to it. The price may be presented in irregular order so that the respondent has to search for the price in a set of price. That approach ensures that the price is not simply used as a Likert scale of magnitude [8].
The integrated set of three studies here, dealing with the response to customers observing the behavior of managers and servers in a restaurant extends the use of Mind Genomics and economics. Author Rappaport has coined the term ‘cognitive economics’ for the extension, where economic considerations, rather than ratings of emotions, serve as the dependent variable [9].
Attribution Instead of Rating
The new direction in Mind Genomics, Attribution, will follow the approach pioneered with the direct estimation of price. In the latter studies, where price was the rating variable, the respondent evaluated different combinations of product features and benefits, selecting a price that might be appropriate for a product or service described by the concept or test vignette. The terms vignette, concept and test combination are used interchangeably. The analysis by OLS (ordinary least-squares) regression revealed the part-worth value of each benefit or feature, or even brand name and tag line. Since the rating was expressed in terms of dollars and cents, the equation uncovered the dollar value of each element. The OLS equation was expressed as: Dollar Value = k1(A1) + k2(A2) … k16(D16), as an example. The equation shows the dollar value selected by the respondent deconstructed into 16 smaller dollar values, k1 – k16, for 16 elements (features, benefits, brand names, tag lines, etc.). Attribution in Mind Genomics moves the focus from the evaluation of price for a specific item whose components are known to the estimated price that would be paid for a situation to be described, where there are no features, but rather actions. One might call this the ‘dollar value of a smile.’ The undergirding hypothesis is that one can present vignettes about situations, such as staff behavior in a restaurant, and ask respondents to judge the relative magnitude of the check for a meal, the relative magnitude from more expensive to the same to less expensive.
The notion of attribution is new, without any exploratory data to be found. There is a well-developed science for the dollar value of product and service features, but the dollar value pertains to what is being purchased. There is an expectation that the dollar value will change with the different features. We are accustomed to paying more or less for certain benefits, features, and even brands. The act of judging is straightforward, at least at a subjective level. Whether the judgments are correct or not can be determined through experiment. In contrast, attribution explores a potentially tenuous relation, if any, between money and the perception of behavior, in a world where the two may not be linked at all. The process of measuring this variable we call ‘attribution’ will become clear as we move through three studies dealing with the estimated size of the ‘check’ for a meal, based upon a description of the behavior of the server and the manager. Each experiment begins with four questions about the situation, and four answers to each question. The role of the question is to set up the structure of information, and to create a structure for the answer. The respondent never sees the question but rather sees only a set of combinations of answers. The respondent 24 different combinations of answers, viz., 24 ‘vignettes’ or test concepts, and rates each vignette on the expected size of the check that the meal would cost. The study does not ask the respondent what she or he would pay for the meal, but rather instructs the respondent to guess about the size of the check to be given by the server. There is no direct cue about price, since the source of the size of the check is unknown, and the respondent is being told that the check is simply delivered.
The origin of these studies emerges from ongoing discussions about the lack of knowledge about the mind of the customer, other than the sociological and market research studies of the type cited above. That is, there is little known about the everyday formation of impressions about the restaurant by customers who walk into a restaurant, are seated, and observe what is going on. The information of interest to most people is the restaurant itself, and the criteria for judgment as to whether one wants to return to the restaurant. The standard knowledge emerging from the experiments is surface. It should be noted that this set of three exploratory studies is both novel and routine. The novelty is the use of pricing as a dependent measure to assess a subjective impression. The dollar value of an experience is not new [9,10], just as the dollar value of product quality is not new [11]. What is new is the use of a seemingly unrelated measure, the dollar value of the check or bill for the meal. There is no clear or necessary or ‘right’ relationship between the dollar value of the check and the description of the restaurant.
The Three Experiments – Mind Genomics Applied to Cognitive Economic Attribution
Mind Genomics works according to a systematized process, following a user-friend path. The software makes the set up straightforward. The set-up system is simple, shown by Figure 1, which represents the different steps that the researcher follows, and at each point types in the relevant information onto a computerized form. Figure 1 is meant to be schematic, showing an actual sequence of completed forms, in the sequence presented to the user. The user is led through a series of forms to complete. The process is virtually self-explanatory but is absent bells and whistles. The format is simple, to the point, and guides the researcher through the process, step by step, beginning with the selection of the topic, the requirement to create four questions, the requirement to create four answers for each question, and finishing with the introduction to the experiment, the rating scale, and the anchor points for the rating scale (highest and lowest).
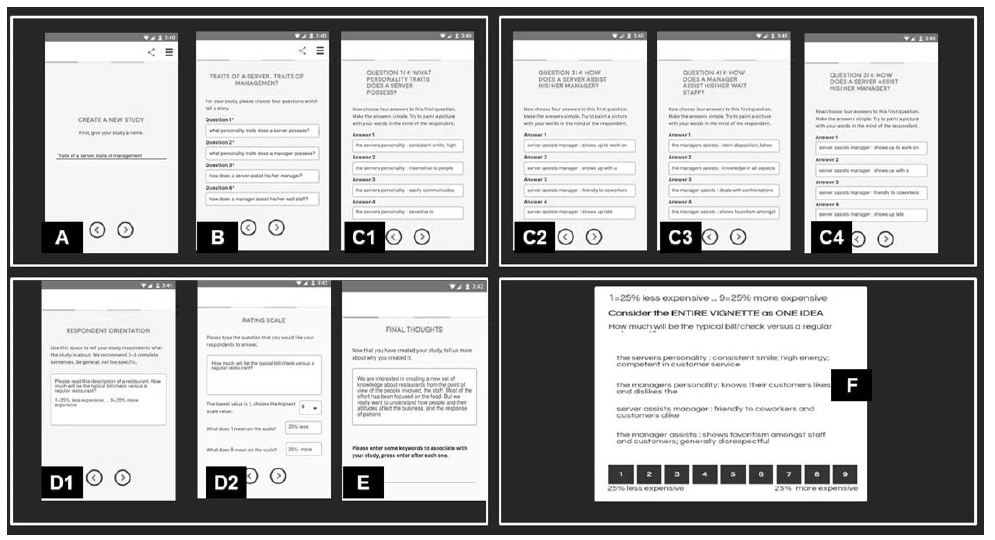
Figure 1: The set-up system for the Mind Genomics project.
It is worth noting that the ‘difficulties’ encountered in these studies are not from the study itself, but typically because people think in an undisciplined fashion. The form in Figure 1 forces the respondent to think in a systematical fashion, beginning with the topic, then proceeding to the questions, and finally moving to creating four answers for each question. After the first one or two experiences, the thinking of the typical researcher changes, as the respondent begins to follow the disciplined path demanded by the computer program. We illustrate the set up with the first of the three studies, traits of the server. We deal with the results in detail, and then follow up with a cursory analysis of the key findings for the other two studies, the interaction among the staff (Study 2) and the interaction with the customer (Study 3).
Step 1 (Panel A)
Select the name of the topic. This first step requires the researcher to give a name to the project. As simple and as direct as it sounds, Step 1 requires the researcher to focus on the topic as a coherent ‘whole,’ rather than thinking about the topic in a diffuse way. The research then records the name on the proper screen. The study here is Traits of Servers.
Step 2 (Panel B)
Select four questions which tell a story about the topic. It is at Step 2 that the topic should crystallize in the mind of the respondent. The text is typed onto the computer form, one question after another. The questions are never seen directly by the respondent, but simply used as an aid to help generate the creation of the four answers to each question. It is relevant to note here that Step 2 is the most difficult step in the entire process. Most people do not approach problems and knowledge acquisition in a structured, disciplined fashion. Two or three experiences suffice.
Step 3 (Panels C1-C4)
Repeat each question (automatically done by the computer), and instruct the respondent to type in the four different answers to the question in exactly the language and format that the respondent will see it. It is straightforward here to copy text from other languages and other alphabets, and then paste into the computer form. Each of the four panels corresponds to one of the questions. Table 1 shows the four questions, and the four answers to each question.
Table 1: The four questions and the four answers to each question for Study #1.
| Study 1: Traits of server and manager | |
| Question A: what personality traits does a server possess? | |
| A1 | the server’s personality: consistent smile; high energy; competent in customer service |
| A2 | the server’s personality: insensitive to people with different personalities who show up |
| A3 | the server’s personality: easily communicates with people similar to themselves regarding their specific needs like special dietary requests |
| A4 | the server’s personality: sensitive to customer’s/coworker’s cultural differences; understands we are all different |
| Question B: what personality traits does a manager possess? | |
| B1 | the manager’s personality: stern disposition; takes on an authoritative role |
| B2 | the manager’s personality: knows their customers likes and dislikes the |
| B3 | the manager’s personality: knows their staff’s strengths and weaknesses |
| B4 | the manager’s personality: knows their staff’s weaknesses and strengths |
| Question C: how does a server assist his/her manager? | |
| C1 | server assists manager: shows up to work on time on a consistent basis |
| C2 | server assists manager: shows up with a can-do, team player attitude |
| C3 | server assists manager: friendly to coworkers and customers alike |
| C4 | server assists manager: shows up late |
| Question D: how does a manager assist his/her wait staff? | |
| D1 | the manager assists: stern disposition; takes on an authoritative role |
| D2 | the manager assists: knowledge in all aspects of restaurant tasks |
| D3 | the manager assists: deals with confrontations between staff and customers in a bias manner |
| D4 | the manager assists: shows favoritism amongst staff and customers; generally disrespectful |
The rationale for four questions and four answers per question comes from the vision of the researchers to create an easy-to-use system to answers questions about specific topics, such as products, political candidates, and social situations. The original goal was to make the number of possible messages about a topic virtually unlimited. With repeated experience, it became clear that most issues could be satisfied with 36 elements, such as four questions with nine answers (36 elements, 60 vignettes), or six questions with six answers each (36 elements, 48 vignettes). Over time it was the design comprises four questions with four different alternatives (16 elements, 24 vignettes) which emerged as the most practical. Note that elements B3 and B4 are the same, except for a reversal of the order of elements. B3 began with strengths and finished with weaknesses. B4 began with weaknesses and finished with strengths. The Mind Genomics process lets us explore these side issues of order, and study different ways of expressing the same idea, whether these be minor differences (e.g., order of ideas) or major differences (different tonality of language.)
Step 4 (Panels D1 and D2)
Orient the respondent (D1) and then create the rating questions, selecting the number of points, and the rating scale (D2). There are three sequential steps to create the rating scale, comprising the text, the number of scale points, and the anchor points for the low end of the scale and the high end of the scale. Only two scale anchors are allowed in the current version. For other formats, the actual scale points and their anchors are typed out. For this study, the rating scale is:
Please read the vignette below. How much would you expect the price to be for your meal
1= 25% lower … 9= 25% higher
Step 5 (Panel E)
Show the actual vignette. This is not part of the set up, but is what the vignette looks like on a computer tablet or a PC. There is a slightly different ‘look’ for a smartphone, due to the difference in size and dimension. Each respondent evaluates a unique set of 24 vignettes, comprising either two, threeor four elements, viz., answers. A vignette can contain a maximum of one answer from a question, never two or more answers, This simple bookkeeping device ensures that the respondent will never be presented with a vignette comprising mutually contradictory elements. at least contradictory by presenting different altenratives to the same question.
Each respondent evaluated a different set of 24 vignettes, created by permuting the basic experimental design [12]. This strategy maintains the power of an experimental design even at the level of the individual respondent, but ensures that each respondent evlauated a unique set of 24 vignettes. Two benefits emerge, the first beiug the ability to analyze the data by creating a model at the level of the individual (important for clustering), and the second ensuring that the study covers a wide range of possible combinations and thus needs absolutely no knowledge about the most promising combinations to test.
Step 6
Create the database (Table 2). The project generates 24 rows of data for each person. An example of the database appears in Table 2, with the table transpose for presentation purpooses. . The data are set up for immediately stastical anaysis.
Table 2: Example of the database prepared for analysis. The actual matrix format for data analysis is transposed 90 degrees.
| Panelist | Each respondent has a unique identification number (UID) | 1 | 2 | 3 | 4 | 5 | 6 |
| Row in database | The 30 respondents generate 24 rows of data each, one for each vignette | 246 | 407 | 478 | 583 | 642 | 678 |
| Gender | Male or Female, obtained from an up-front classification question | Fem | Male | Fem | Male | Fem | Male |
| Age | The respondent gives year of birth | 36 | 23 | 19 | 24 | 23 | 20 |
| Age Group | After-the fact grouping into two ages | Old | Old | Young | Old | Old | Young |
| Self-Profiling (Answer one only) | Who do you relate to most in a restaurant setting?
1= Wait staff ( food ) 2= Owner 3= Bus ( drinks, setup, cleanup ) 4=Cashier/host |
1 | 1 | 1 | 1 | 3 | 1 |
| Test Order | The computer records the order of trial | 12 | 23 | 17 | 6 | 18 | 22 |
| A1 | Each element in the study us coded 1 when appearing in the vignette, and 0 when absent from the vignette | 0 | 0 | 0 | 0 | 0 | 0 |
| A2 | 0 | 1 | 0 | 0 | 0 | 0 | |
| A3 | 0 | 0 | 0 | 0 | 0 | 0 | |
| A4 | 0 | 0 | 0 | 0 | 0 | 1 | |
| B1 | 0 | 0 | 1 | 0 | 0 | 0 | |
| B2 | 0 | 0 | 0 | 0 | 0 | 0 | |
| B3 | 1 | 0 | 0 | 1 | 1 | 0 | |
| B4 | 0 | 0 | 0 | 0 | 0 | 1 | |
| C1 | 0 | 0 | 0 | 0 | 0 | 1 | |
| C2 | 1 | 0 | 0 | 0 | 1 | 0 | |
| C3 | 0 | 0 | 1 | 1 | 0 | 0 | |
| C4 | 0 | 0 | 0 | 0 | 0 | 0 | |
| D1 | 0 | 1 | 1 | 0 | 0 | 0 | |
| D2 | 0 | 0 | 0 | 0 | 0 | 0 | |
| D3 | 1 | 0 | 0 | 0 | 1 | 0 | |
| D4 | 0 | 0 | 0 | 1 | 0 | 0 | |
| Rating | The 9-point rating scale anchored at 1 (25% lower) and 9 (25% higher) | 8 | 4 | 8 | 6 | 7 | 2 |
| Price | The percentage departure from 0 | 19 | -6 | 19 | 6 | 13 | -19 |
| Rtseconds | Response time to the vignette in the nearest 10th of a second | 1.2 | 0.8 | 5.0 | 4.9 | 1.1 | 4.0 |
| Clusters2 | Membership in one of the two clusters | 1 | 2 | 1 | 1 | 2 | 2 |
| Clusters3 | Membership one of the three cluster | 1 | 3 | 1 | 3 | 2 | 2 |
Step 7: Convert the Data to Percent
The nine ratings of price are transformed to relative price, with a rating of 9 transformed to +25 (25% higher), a rating of 5 transformed to 0 (same expected price), and a 1 transformed to -25 (25% lower).
Step 8
Build separate equations for the predefined groups (total, gender, age) The data from each of the self-defined groups, total, gender, and age, were analyzed to create an equation of the form:
Percent Departure of Check from Typical (+25 to – 25) = k1(A1) + k2(A2) … k16(D4)
The coefficient for an element is relative change (percent) is size of the check when the element is inserted into the vignette: (increase in expected check when positive, decrease in expected check when negative).
Table 3 shows the coefficients for the different groups. We highlight only those elements which generate positive or negative changes of 8% or higher in the check. The interesting finding from the first group of respondents is that there are no elements which drive up the value of the check, or drive it down, as least strongly. No coefficient is 8 or higher, viz., no element can be attributed to be a major driver of the check price.
Step 9
Create new to the world mind-sets by dividing the respondents into groups based upon the patterns of their coefficients. Each respondent generates an equation with 16 coefficients, the equation relating the presence/absence of the 16 elements to the percent change expected for the check. The percent is shown as a whole number. A 25% increase in the check is shown as +25; 25% decrease in the check is shown as -25). The pattern of coefficients allows the use of k-means clustering [7]. The clustering program computes a measure of ‘distance’ between pairs of respondents, the measure D defined as (1-Pearson Correlation, viz. 1-R.) The Pearson Correlation, R, measures the strength of a linear relation between two variables, based upon the different observations. There are 16 observations for each respondent. The Pearson Correlation varies from a high of +1 when two variables are perfectly linearly related to each other, to 0 when two variables are not related to each other, to -1 when two variables are inversely related to each other.
Step 10
Create the models for two and three clusters emerging from the clustering. The segmentation or clustering does not know anything about the ‘meaning’ of the elements, but simply works with the coefficients, and the distance values. The clustering yields five new models, two for two-mindsets, and three for three-mind sets. It is the task of the researcher to name these mind-sets, based upon the pattern of strong performing positive elements. We will only present the results for the three mind-sets.
Results – Study #1 (Traits of Servers and Manager)
The first analysis comprises the deconstruction of relative price based on the traits of the staff. Table 3 shows that nearly all elements increase the expected bill, but each element increases the expected size of the check to a small degree. There are no elements which stand out as strong contributors of the magnitude of the check, at least when we deal with respondents classified by gender or by age, respectively.
Table 3: Study #1: How the traits and behaviors of the server and the manager drives the relative size of the check. Numbers in the cells are the increment or decrement of the size of the check, expressed as percent, attributable to the element.
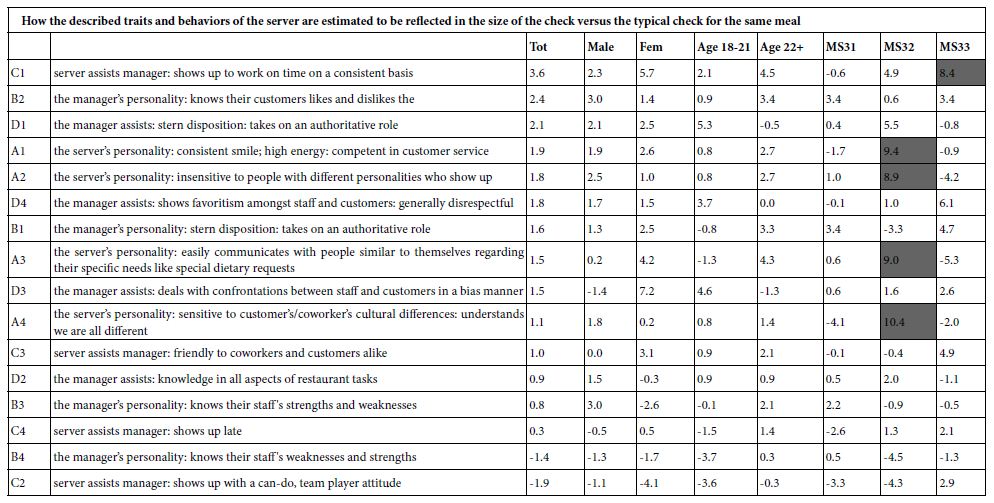
The respondent who is instructed to assign monetary value to a situation (so-called homo economicus) often is more conservative than the respondent who is instructed to assign a rating of a feeling. These data suggest a conservative response. For the Total Panel, the highest contribution to the checks only 3.6% (server assists manager: shows up to work on time on a consistent basis.) For the Total Panel, the lowest contribution to the check is -1.9% (server assists manager: shows up with a can-do, team player attitude.) There are similar, small contributions for the subgroups defined by gender and by age. At least for the total panel and for the key subgroups defined by age and gender, there is no clear relation between the positive behavior of the staff, their interaction, and the price of the check. We see a clearer set of contributions when we divide the respondents into ‘mind-sets’ based upon the pattern of their coefficients for the relative price, rather than by who they are (mind-sets versus conventional geo-demographic subgroups). Yet, as both Table 3 shows for all the data, and Table 4 shows for the strong-performing elements by mind-set, there are still very few elements which drive an expectation of a large increment or decrement of the check.
Table 4: Study #1: How the traits of the server and the manager drives the relative size of the check. Data from the strongest elements for the three mind-sets.
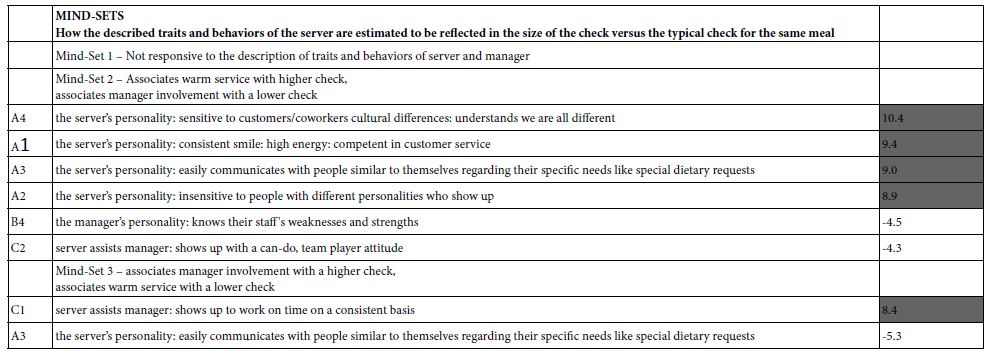
The division of respondents into three mind-sets suggests that:
Mind-Set 1
No clear elements drive change in size of the check
Mind-Set 2
Associates warm service with a higher check, associates manager involvement with a lower check. It may be that these respondents feel that any focus on the server’s personality will increase the check.
Mind-Set 3
Expects to pay more for a server who does the job. Expects to pay less for a server who is friendly, and with whom the customer identifies.
Study 1 on the Traits of the Server and Manager suggests that,, in contrast to homo emotionalis who can be shown to have expansive feelings, these patterns emerging when the mind-sets are separated, homo economicus still shows a constrained range of feelings, even when the different mind-sets are identified by the same clustering method, k-means.
Study #2 (Behavior of Staff as the Customer Enters the Restaurant)
The second study moves to what the customer might observe when walking into the restaurant, but before the customer has been seated. We see no clear relation between the incremental or decremental size of the check and staff behavior at the entrance to the restaurant (Table 5)
Table 5: Study #2: How the behavior of the staff at the time of customer entrance to the restaurant drives the relative size of the check. Numbers in the cells are the increment or decrement of the size of the check, expressed as percent, attributable to the element.
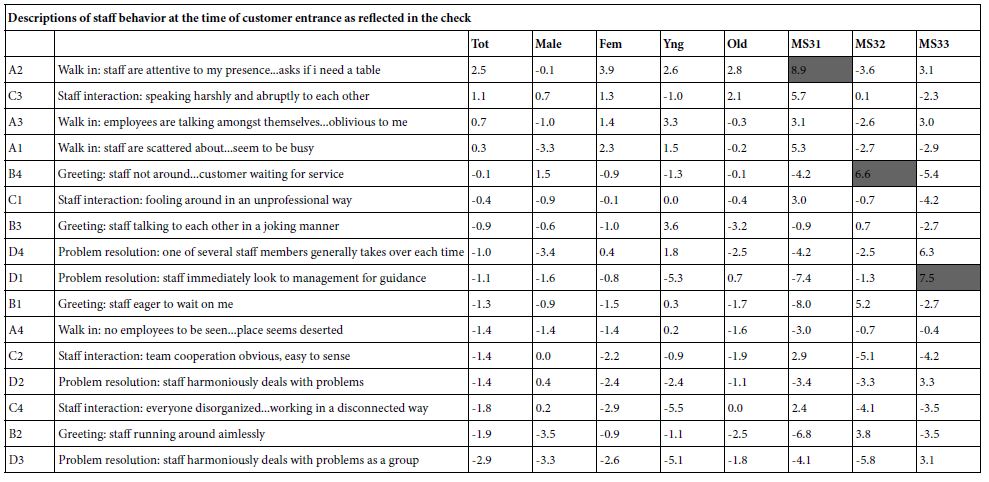
The key differences which emerge come from the three mind-sets (Table 6).
Table 6: Study #2: How the behavior of the staff at the time of customer entrance to the restaurant drives the relative size of the check. Data from the strongest elements for the three mind-sets.
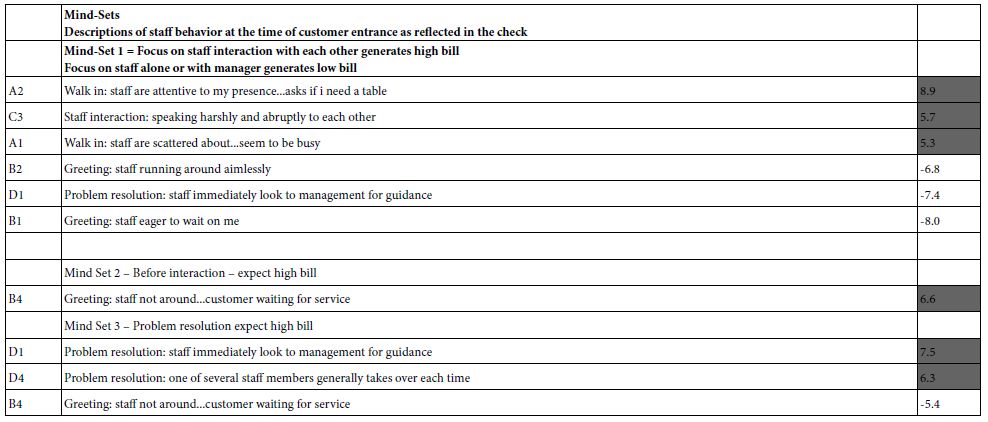
Mind-Set 1 appears to expect to pay more for staff which look busy, whether they are harmoniously busy or not. Mind-Set appears to expect to pay less for staff seemingly eager to wait on the customer.
Mind-Set 2 expects to pay more when the staff look busy.
Mind-Set 3 expects to pay more when the staff look competent and resolve a problem. Mind-Set 3 expects to pay less for incompetent service.
Study #2 reaffirms that when the respondent is asked to use economics, specifically money as a measure of something that is not usually appraised in economic terms, viz., behavior and service, homo economicus takes over, and forces the respondent in a conservative, judgmental stance. No elements emerge as dramatically strong drivers of the magnitude of the check.
Study # 3 – Dollar Value of Description of the Interaction Between Server and Customer
Study #3 was run exactly as studies 1 and 2.This time, however, the topic was the interaction of the server and the customer. Once again, no patterns emerge for the total panel and for the key subgroups of gender and age (Table 7). The key results emerge for the mind-sets (Table 8)
Table 7: Study #3: How the interaction of the server with the customer drives the relative size of the check. Numbers in the cells are the increment or decrement of the size of the check, expressed as percent, attributable to the element.
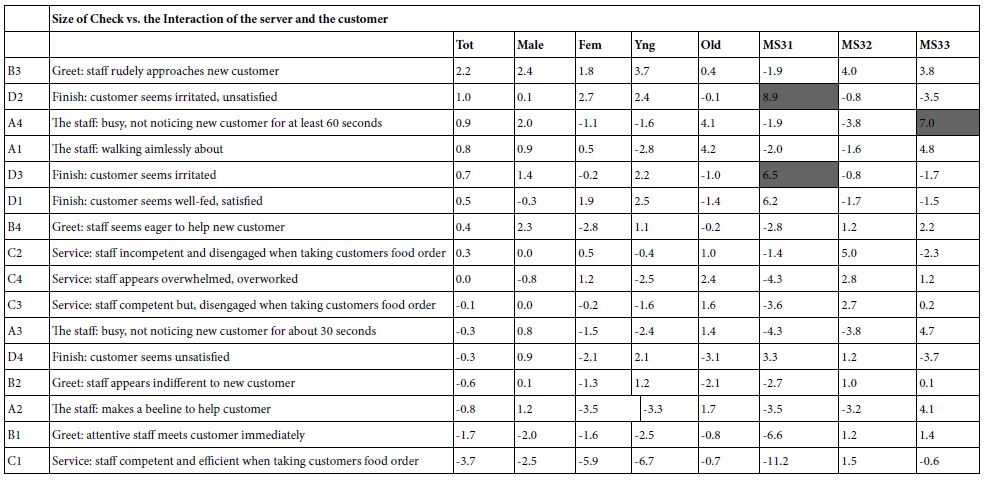
Table 8: Study #3: How the interaction of the server with the customer drives the relative size of the check. Data by mind-set
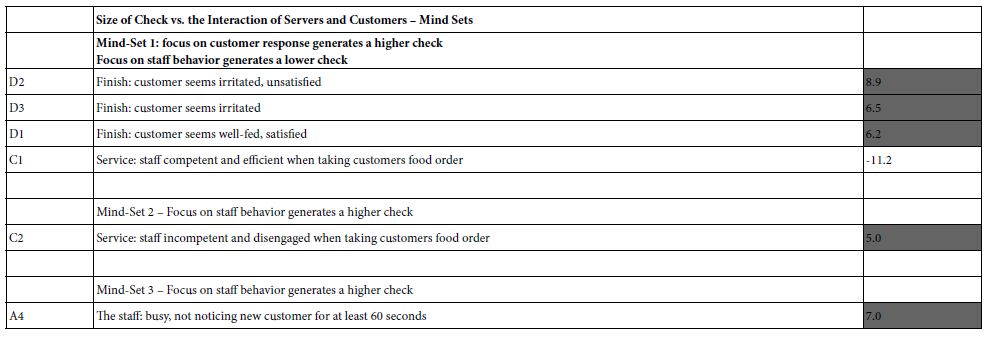
Mind-Set 1
Focus on the customer generates an expectation of a higher check. Focus on the server generates an expectation of a lower check.
Mind-Set 2
Weak effects. No strong expectations either direction.
Mind-Set 3
Focus on incompetence drives the expectation of a slightly higher check.
Again, in contrast to homo emotionalis, we see homo economicus is far more conservative, especially when there is attribution without clear linkage, rather than evaluation with clear linkage. An example of the evaluation would be the expectation of the price of the check when the messages deal with the actual food, rather than the service.
Beyond Cognitive Responses of Homo Economicus to A Focus on Engagement Time (Response Time)
The second aspect of the analysis involves the amount of time that a respondent spends making a decision. The data from the deconstruction suggests that the respondent is conservative, at least at a conscious level. At the level of the unconscious, however, can we discover anything more about homo economics and attribution? That is, if we are able to measure the time needed to make a decision, do we learn anything more? Or, in fact, is attribution more elusive? One of the features of the Mind Genomics system is the ability to measure response times, defined as the number of seconds between the time the vignette appears o the screen and the time that the respondent assigns a rating. The response time shortens and reaches a steady stage after 2-3 experiences with the task. Since each respondent evaluated all of the elements in different combinations, and each element appeared many times in each position, one need not eliminate the first 1-3 vignettes. They can simply be included because the slow response should distribute itself approximately equally across all respondents and all elements.
The respondents could not have known their own response times for each element, for three reasons:
- The respondent was not aware that the response time was being measured
- There was too much to do when evaluating 24 vignettes
- Each vignette comprised 2-4 elements.
The response times are measured as a totality. Any response time of 9 seconds or longer was defined as 9 seconds. The randomization of experimental designs ensured that the vignettes requiring 9 seconds or longer would most likely comprise similar elements.
Figure 2 shows the distribution of the response times for each element. The three histograms are plotted in a vertical fashion, allowing the eye to compare the shape of the histograms. It is clear that the response times tend to be longest when the task is to attribute relative price of the check to the traits of the server and the manager. It is clear that the response times tend to be shortest when the task is to attribute relative price of the check to the interaction of the server with the customer. These patterns make intuitive sense, because the respondent can identify with the situation of the server interacting with the respondent. There is little to think about. The reaction is quick because the situation is familiar.
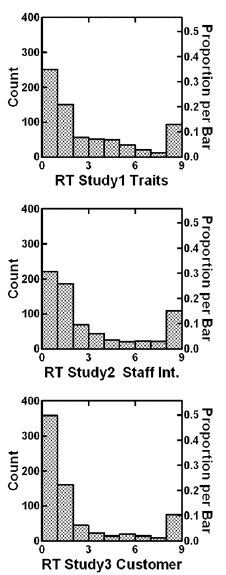
Figure 2: Histograms of the frequencies of the response times for the vignettes. Each graph pertains to one study.
A deeper look into the data reveals the number of seconds that can be ascribed to each element. The analysis is similar to the previous analysis linking the presence/absence of the element to the relative magnitude of the check (1=25% less to 9=25% more). This time, the dependent variable is the response time to the nearest tenth of a second. The equation showing the deconstruction of the response time once again has no additive constant: Response Time (Seconds) = k1(A1) + k2(A2) … k16(D4)
Table 9 shows the combination of element and subgroup for elements defined to ‘engage the respondent.’ In this study, engagement is operationally defined as an element whose deconstructed value of response time is 1.4 seconds or longer. The number 1.4 seconds is an operational definition of engagement, emerging from the analysis of hundreds of studies of this type. The typical engagement times for elements are generally 0.3 to 0.7 seconds, but the engagement times vary by seriousness of topic. Thus, 1.4 seconds for estimated response time is a safe estimate for an element which engages, albeit an estimate of convenience since there is no agreed-upon definition of engagement vs. response time.
Table 9: Response times (engagement) to individual elements by respondents in key subgroups. Only those elements generating response times of 1.4 seconds or more are shown in the table.
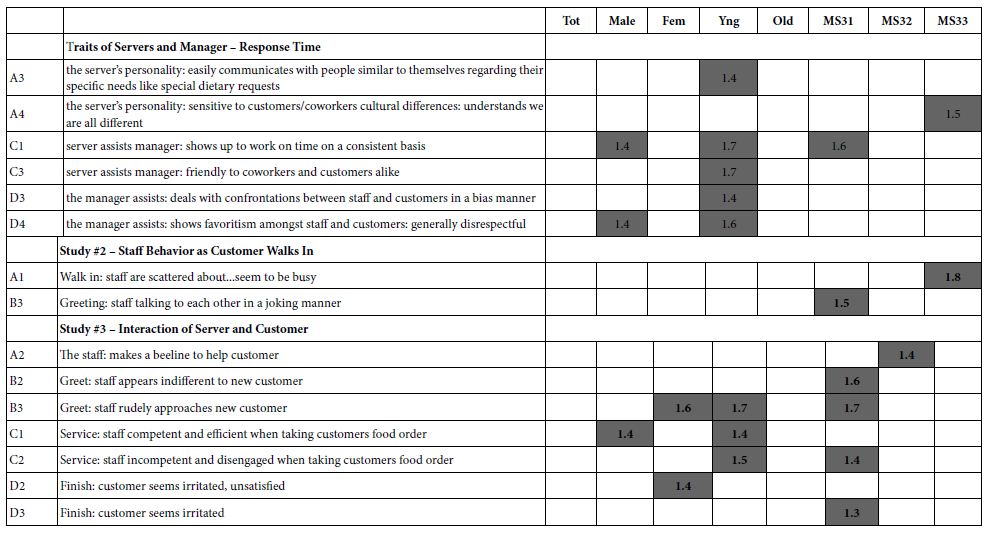
Table 9 suggests that there are some elements which engage the respondent in for dramatically longer times.
The total panel shows no long engagement times.
Males engage with the elements about assisting, whether server assists manager or manager assists server. In contrast, females engage in the element talking about a negative end to the meal.
Younger respondents engage with assistance as well, whether positive or negative. They also respond to elements talking about the nature of the service. Older respondents do not engage with any element.
Mind-Set 1 engages with all types of elements, positive and negative, and at all stages of the staff-customer interaction.
Mind-Set 2 engages with speed of service (‘beeline’).
Mind-Set 3 engages most with the staff being busy.
The use of response time reveals a somewhat more detailed story, suggesting that the attribution of dollar value to staff behavior may not reveal itself as much in the conscious evaluation of ‘how much money will change hands’ but rather in the unconscious variation in engagement time (response time to individual elements).
Discussion and Conclusion
The emerging science of Mind Genomics has been previously used to understand how people respond in an emotional fashion to the description of features and attributes of products and situations [13], as well as understand the dollar value of features and products [10,11]. The approach here moves from the evaluation of concrete descriptions of products and situations to the attribution of value to situations which have no intrinsic value in an of themselves. The introductory studies here are the atmosphere and behavior of service and managerial staff in a restaurant, and the attributed value of such service to one economic indicator, the magnitude of the check.
The data suggest that it is difficult to link economics (e.g., value of the check) to behavior which is not directly related to the product. The Mind Genomics experiment works, at least in practice. What emerges, however is a greatly constricted pattern, a conservatism which does show itself dramatically when one is rating the concrete situation based on feelings, or when one is rating the dollar value of a tangible item or clearly defined service for which one will pay. The implications of this study are great. We live in an economic society where the focus is on customer satisfaction, and the expected economic returns of customer satisfaction. These data suggest that such efforts may be more difficult than one might think. It is all well and good to measure the satisfaction of customers, but just how does that translate into what people will pay. The data from this study suggests that the results of a Mind Genomics study might not be very clear, whether the study deals with the evaluation of a situation without a customer (Study #1: Traits of Server and Manager), the evaluation of a situation where the customer is being introduced into the situation (Study #2: Staff Behavior as Customer Walks In), or even the evaluation of a situation describing the interaction with the staff (Study #3: Interaction of Server and Customer). Or to summarize, how then do we measure the dollar value of customer satisfaction? What have we missed?
References
- Han H, Ryu K (2009) The Roles of the Physical Environment, Price Perception, and Customer Satisfaction in Determining Customer Loyalty in the Restaurant Industry. Journal of Hospitality & Tourism Research 33: 487-510.
- Namkung Y, Jang S (2007) Does Food Quality Really Matter in Restaurants? Its Impact On Customer Satisfaction and Behavioral Intentions. Journal of Hospitality & Tourism Research 31: 387-409.
- Qin H, Prybutok VR (2009) Service quality, customer satisfaction, and behavioral intentions in fast-food restaurants. International Journal of Quality and Service Science 1: 78-95.
- Ryu K, Han H (2010) Influence of the Quality of Food, Service, and Physical Environment on Customer Satisfaction and Behavioral Intention in Quick-Casual Restaurants: Moderating Role of Perceived Price. Journal of Hospitality & Tourism Research 34: 310-329.
- Jang S, Liu Y, Namkung Y (2011) Effects of authentic atmospherics in ethnic restaurants: investigating Chinese restaurants. International Journal of Contemporary Hospitality Management 23: 662-680.
- Teng CC (2011) Commercial hospitality in restaurants and tourist accommodation: Perspectives from international consumer experience in Scotland. International Journal of Hospitality Management 30: 866-874.
- Zemel R, Choudhuri SG, Gere A, Upreti H, Deite Y, et al. (2019) Mind, consumers, and dairy: Applying artificial intelligence, mind genomics, and predictive viewpoint typing.
- Moskowitz H, Baum E, Rappaport S, Gere A (2019) Estimated Stock Price Based on Company Communications: Mind Genomics and Cognitive Economics as Knowledge-Creation Tools for Behavioral Finance. Edelweiss Applied Science and Technology 4: 60-69.
- Moskowitz H, Rappaport S, Moskowitz D, Porretta S, Velema B, et al. (2017) Chapter 14 – Product design for bread through mind genomics and cognitive economics. In D. Bagchi & S. Nair (Eds.), Developing New Functional Food and Nutraceutical Products 249-278.
- Moskowitz HR (2012) ‘Mind genomics’: the experimental, inductive science of the ordinary, and its application to aspects of food and feeding. Physiol Behav 107: 606-613.
- Moskowitz HR (1995) The dollar value of product quality: The effect of pricing versus overall liking on consumer stated purchase intent for pizza. Journal of Sensory Studies 10: 239-247.
- Gofman A, Moskowitz H (2010) Isomorphic Permuted Experimental Designs and Their Application in Conjoint Analysis. Journal of Sensory Studies 25: 127-145.
- Gere A, Harizi A, Bellissimo N, Roberts D, Moskowitz H (2020) Creating a mind genomics wiki for non-meat analogs. Sustainability 12: 5352.