Abstract
Focusing on the need to develop rapid ways to understand and solve social problems, the study reported here had 61 respondents each evaluate a set of 24 vignettes systematically created to represent different aspects of the problem. The topic was the expected impact of a park to be built in northern Israel, in Haifa, a simulated problem typical of local social issues world-wide. The objective was to demonstrate the ability of the emerging science of Mind Genomics to evaluate different aspects of a local issue, with rapid, affordable experiments. The study, done within the period of a few hours from start to finish, including data analysis, revealed two mind-sets of respondents, one group focusing on issues of environmental impact, the other focusing on the benefits to people. The process shows how to probe deeply into the minds of people, even when the people cannot easily express their concerns.
Introduction – A World of Issues and Prospective Answers
We live in a world rife with issues, with problems whose solutions may in their wake create other problems, or perhaps simply exacerbate these other problems. How does one approach this issue, where the solution to problems creates other problems? History seems to be the story of this problem-solution balancing acts. Philosophers such as the German romantic, Hegel, recognized this delicate balance as an ongoing pattern which characterizes history [1]. Hegel put the issue elegantly as ‘thesis, antithesis, combining to yield synthesis’, a process and balancing act which lies at the essence of world progress.
This paper reports efforts to adapt an emerging discipline, Mind Genomics, to the study of policy, using a combination of experimental psychology, statistical design of ideas, and consumer research methods, respectively. The paper is crafted as a demonstration of what could be accomplished by using the Mind Genomics approach, coupled with artificial intelligence, to investigate different aspects of a problem, structure a way to understand these aspects, and assess the response of people to various solutions. The paper also demonstrates a practical way to approach issues of public policy, in a way which is inexpensive, fast, and most of all powerful because of the ability to iterate to answers, rather than spending great time learning, hypothesizing, and then confirming or falsifying one’s conjectures.
The unpleasant reality confronting the world and its inhabitants, not to mention engineers of policy, is that for most problems there is probably no perfect solution. The language of everyday recognizes the reality that solutions come with their own problems. Truisms such as ‘there’s no free lunch’, or ‘the piper must be paid’ are tribute to this reality. And, of course, even when the objective is noble, such as helping others to escape poverty, there is always the issue of negative consequences, expected or unexpected. One need only recognize that in the history of society’s efforts to advance materially come at the price of damage to the environment [2]. There are the big picture issues, such as the deforestation of the amazon rainforest, a possibly dubious necessity there are to be farms to grow food for people to eat [3].
The issue addressed here is how to ‘surface’ the issues involved when there is a conflict between the noble effort to improve the lot of people and the effect that this effort has or could have on the local environment. Can we develop an approach to answer this everyday problem, not so much to paint a ‘grand picture’ but instead actively address a local, small, seemingly irrelevant issue? Instead of spending efforts ‘tilting at windmills’ with long, philosophically driven, coffee-powered discussions of grand issues, can we create a system which can address a real problem, small in comparison, local in nature, but equally fractious and important to those involved. In other words, do something when something should be done.
The One-at-a-Time Effort and Its Evolution to the Systematic Studies Using Mixtures
Today’s researchers are taught the ‘scientific method’, reinforced again and again that the ideal way to ‘understand’ the nature of something, some phenomenon consists of isolating that ‘something’, and studying the isolated something, to understand it deeply. Where possible, it Is important to reduce ‘noise’ around the phenomenon, whether that noise reduction be accomplished by removing all sources of variation, so that the phenomenon can be explored and its different facets revealed, or by averaging out the noise. When the phenomenon in question is one driven by behavior, the idea is to isolate the person, one way to reduce noise, and make many measurements of th same phenomena, the phenomenon being affected by different types of factors. The former strategy reduces the noise, the latter averages out the noise.
The reality of behavior is that cancelling the noise by isolating the person in an experiment may be attractive, but it is not the best way to understand how people react to the real world around them, and how people make decisions. The reality is that decision-making must work in a world of complexity, in a world presenting different choices. To understand how people make decisions, especially those involving ‘soft’ facts, such as policy issues demands that the researcher consider the many types of information presented, their interactions which inevitably mess up the isolation, and the possibility that there is no single ‘best answer’ or certainly no single ‘right answer, rather there are many ‘best answers,’ many ‘right answers.
Statisticians have long recognized that it is vital to study mixtures in many areas, those studies of mixtures teaching a great deal about the nature of the components that the mixture comprises. In the world of statistics, this topic is known as ‘experimental design’ [4]. The ingoing assumption of experimental design is that to understand the variables it is important to understand how these variables behave when they are combined, forced to interact, and then yield a result. Statisticians also realize that if one variable is studied in ‘splendid isolation’ the knowledge thus obtained will not be valid because the variable occurs in conjunction with many other variables. What nature presents to the researcher is the outcome of the interactions, the competition and cooperation of these variables as “drivers” of that which is measured.
Applying the Studies of Systematically Created Mixtures to Options in Public Policy
This paper focuses on the study of mixtures of ideas to understand responses to public policy, and to a simple situation, the creation of a child’s park outside a major city (Haifa, in Israel). The actual experiment is real, but the situation, creation of the park, is chosen simply as a topic which is meaningful to people. The paper will show the way one can incorporate thinking about mixtures of policy ideas to optimize public policy and understand the nature of variations in response to a policy idea.
The approach used here, Mind Genomics, is as an emerging branch of experimental psychology, with the focus on how people make decisions when they are faced with alternatives. Mind Genomics is empirical, not positing theory about why people make decisions, but rather focusing on how to measure the thinking of people who are instructed to make these decisions. Rather than positing that people behave in a certain way to optimize some criteria, Mind Genomics looks at a topic issue, constructs an experiment to observe decision behavior regarding topics involving this issue, and emerges with empirical results to understand the topic. The goal of Mind Genomics is thus to restructure the issue in a way amenable to a certain type of test, do the testing, come up with the results, and finally use the research to reveal how people make decisions at the specific, granular level of the situation, viz., where the activity of decision making really takes place [5,6].
Mind Genomics studies follow a simple protocol based upon the belief that the study is designed to identify areas of interest, rather than to affirm or to falsify a hypothesis, viz. to explore the unknown territory. Mind Genomics is inductive, empirical, building from the ground up, seeking patterns. Rather than following ‘calls from the literature to fill gaps in our knowledge, to fill holes in the literature as the activity is often described, Mind Genomics attempts to describe the interaction of variables in a system as drivers of a phenomenon of human experience. The discipline is experimental design. There are no intervening variables nor hypothetical constructs. There are only emergent patterns, patterns to be described and perhaps understood in a deep fashion. There may be an underlying pattern which lends itself to theory, but that theory is of secondary importance in Mind Genomics. Of primary interest is the enticing repetition of in nature, patterns which make sense, patterns which reaffirm a regularity in the universe.
Following the foregoing viewpoint, that the focus be on regularity which informs and teachers, not on slavishly affirming or falsifying a hypothesis, we now move to a demonstration of the approach. To make the study interesting, beyond just the facts, we can add a level of excitement by framing Mind Genomics as a process which demonstrates an ‘industrial-scale production of knowledge. As part of the project reported here, we also focus on the exceptional speedy creation of knowledge, and what that means for the project of science.
Mind Genomics for Industrial-Scale Production of Knowledge Regarding How People Think
We now proceed by running an experiment using Mind Genomics to set up the study, and then doing the study with 50 respondents. The Mind Genomics process follows a templated format, designed to simplify the process of thinking about the topic, generating questions, and generating answers. These different aspects will be explained as the paper proceeds.
Step 1: Name the Study
Mind Genomics begins by creating a new project, giving the project a name, and agreeing not to record personal information about the respondent. If personal information is desired, then the respondent can be asked permission, and the respondent must provide that information. Figure 1 shows an example of this page.

Figure 1: Example of the front page
Step 2: Create Four Targeted Questions about the Topic
The questions require information-rich answers in the form of phrases, not just yes/no. is at this point in the process that the researcher feels stymied, simply because all too often education does not often teach a person how to think in an investigative way. Sadly, thinking ends up being displaced by memorization. To help the thinking along, Mind Genomics has made a provision (Idea Coach), in which the researcher can type the background of the study, and in return the underlying AI will generate up to 30 questions. Idea Coach can be resubmitted, until the researcher has selected the requisite four questions.
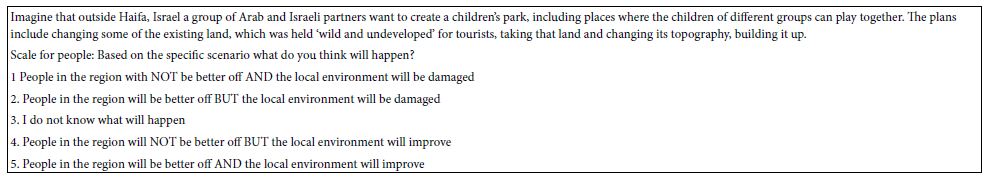
The paragraph below shows the description of the problem submitted to Idea Coach. Figure 2 (left panel) shows the request for four questions to be used for the Mind Genomics study. Figure 2 (right panel) shows the last part of the paragraph embedded in the Idea Coach screen, Outside Haifa, Israel a group of Arab and Israeli partners want to create a children’s park, including places where the children of different groups can play together. The plans include changing some of the existing land, which was held ‘wild and undeveloped’ for tourists, taking that land and changing its topography, building it up. The beneficiaries will be the people, but there are concerns that the local natural environment will be permanently changed, and not for the better.
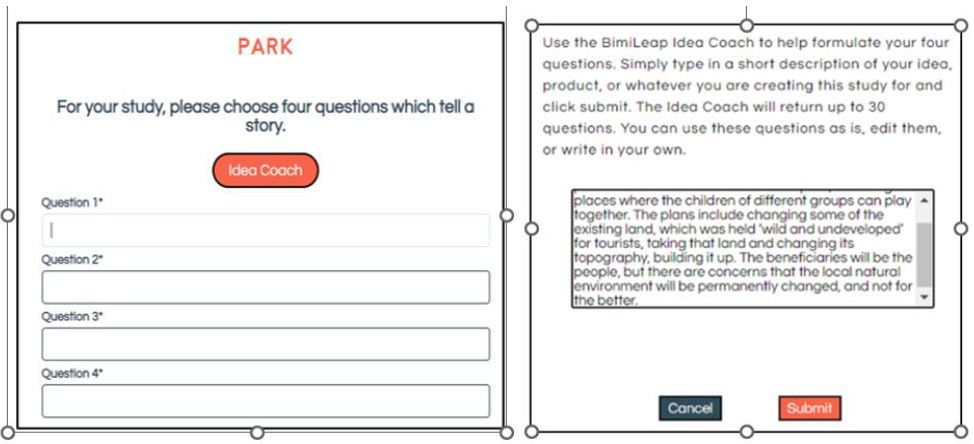
Figure 2: The request for the four questions (left panel) and part of the background paragraph typed into Idea Coach (right panel).
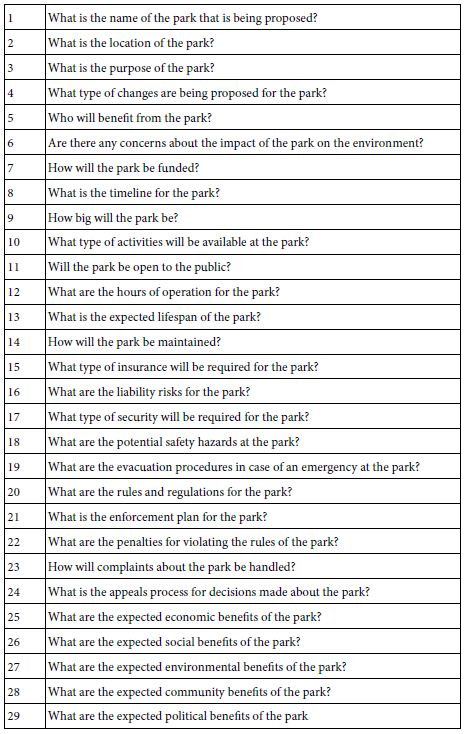
Idea Coach turns with a set of 25-30 questions for the specific paragraph entered into the Idea Coach ‘box.’ Figure 3 shows the first eight of 25-30 questions returned by Idea Coach when the same paragraph was used. Idea Coach returns with different, albeit overlapping sets of questions for each iteration of the same description. Table 1 shows the set of 29 questions returned by Mind Genomics in the actual run of the study.
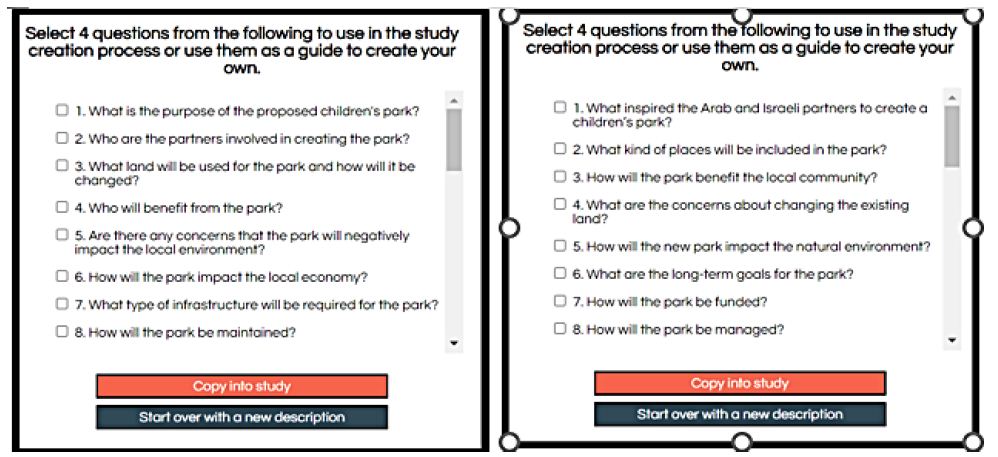
Figure 3: Idea Coach returns with sets of 25-30 questions for a specific background paragraph
From the set of 29 questions shown in Table 1, or from a new set, or from one’s own thinking, select four questions. The questions need not be from the set presented, but can be edited versions of the questions, or even new questions constructed by the researcher after reading the different question emerging from the AI of Idea Coach. It is at this point that the value of artificial intelligence begins to show itself. One need not know anything. Idea Coach can either be used directly to select questions, or to augment existing questions, or even better, to stimulate thinking. The four questions selected for further evaluation by Mind Genomics were:
How will the park be maintained?
What are the expected environmental impacts made by the park?
What are the expected economic impacts made by the park?
What are the expected social impacts made by the park?
Table 1: The 29 questions about the topic returned by Idea Coach
Step 3: For Each Question Selected, Create Four Answers, Expressed as Simple Declarative Statements
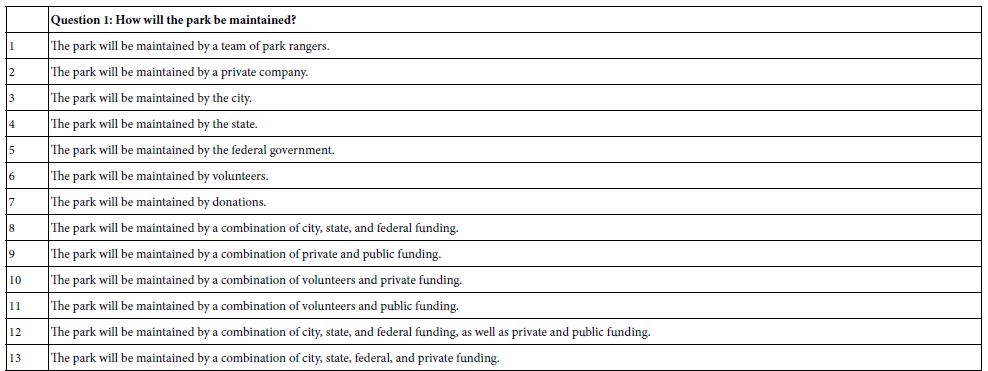
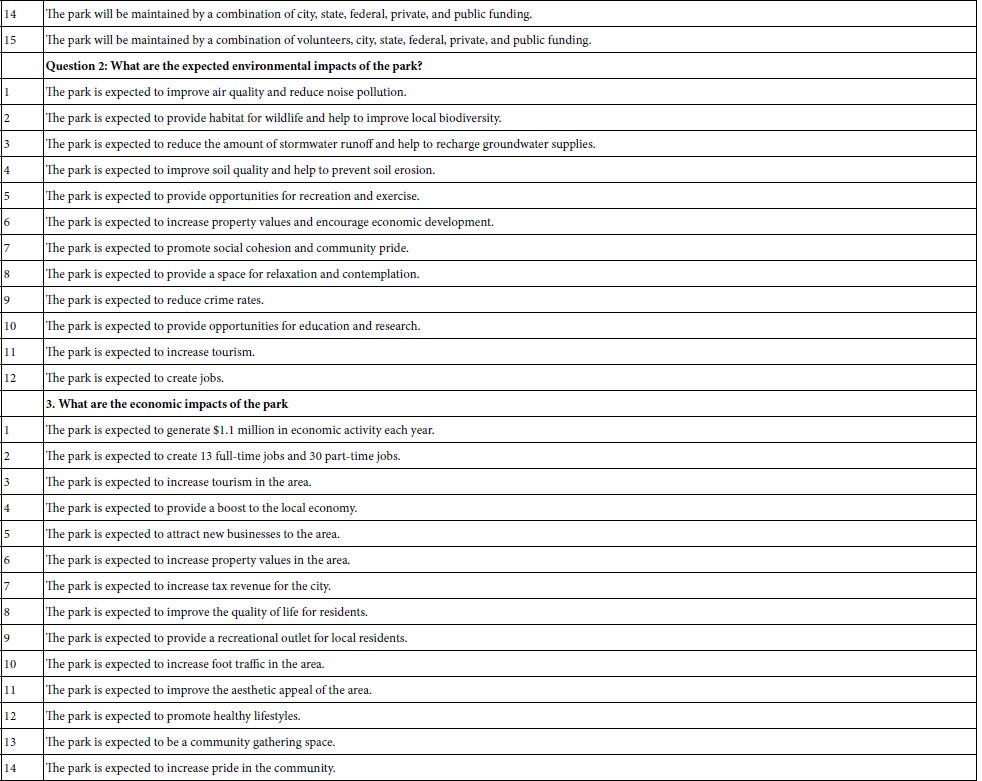
Once again Idea Coach can be used to select the questions, or to jump-start creative thinking (Figure 4) Table 2 presents four questions and up to 15 answers, exactly in the way AI-based Idea Coach returned the list. Table 2 shows the answers as they emerged from the Idea Coach.

Figure 4: Screen shots showing the four questions, Question 1 of 4, and two sets of answers from Idea Coach for Question 1 of 4.
Table 2: The answers to each question, exactly in the language returned by Idea Coach

Step 4: Create a Self-profiling Classification Questionnaire
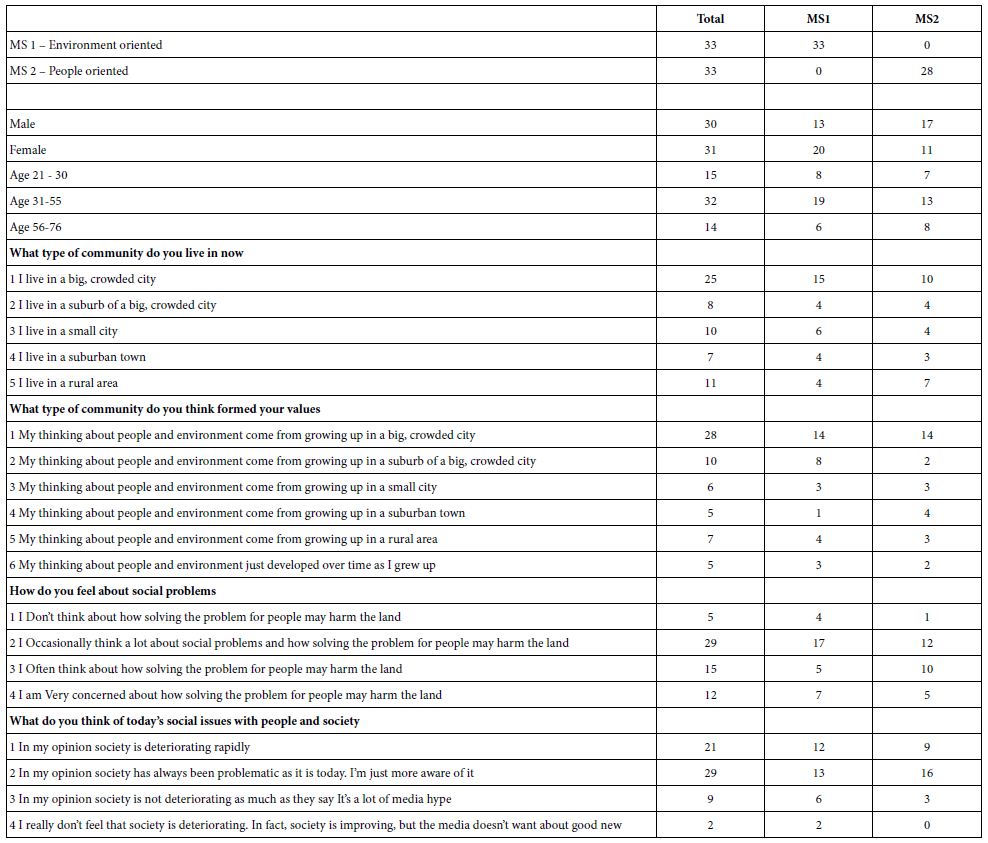
The self-profiling questionnaire will be to capture ‘who’ the respondent IS, and how the respondent FEELS about certain issues. Table 3 shows the distribution of responses, from Total Panel, as well as from two emergent mind-sets.
Table 3: Self profiling questionnaire and number of respondents in each group
Step 5: Lay Out the Combinations of Elements (So-called Vignettes)
Mind Genomics works by presenting respondents with combinations of elements, specified by the underlying plan called the experimental design. The design used by Mind Genomics for this specific set of four questions and four elements (answers) for each question is known as a permuted design [7]. Each respondent evaluates exactly 24 vignettes, with each vignette comprising either two, three, or four elements, with at most one element from a question, but often no elements from a question. The permuted design presents each of the 16 elements five times in 24 vignettes. Furthermore, each question contributes one element or answer to 20 of the 24 vignettes and contributes no answer to four of the 24 vignettes. Each respondent evaluates a totally unique set of 24 vignettes, with each of the 16 elements statistically independent of every other vignette. The happy consequence is that the researcher can estimate an equation either for a specified group of respondent or even for each respondent separately. The latter ability to estimate the individual-level respondent will allow the researcher to divide the respondents by the pattern of their responses, more correctly by the pattern of the coefficients for an equation relating the presence/absence of the elements to the ratings. That regression strategy is explained below.
Step 6: Create the Orientation and Rating Scale
Create a short paragraph introducing the topic and a scale of five questions from which the ‘respondent’ must choose the ‘appropriate answer’ for each of 24 vignettes. Table 4 shows the introduction (also presented above) and the rating scale.
Table 4: The orientation for the respondent
Step 7: Run the Experiment with Respondents Who Represent the Target Audience
For this study the respondents belong to a multi-million-person database run by Luc.id Inc., located in Louisiana, USA. The respondents used by Luc.id, Inc. came from other panels. Luc.id is the panel aggregator. The Mind Genomics program (www.BimiLeap.com) features a link which makes it easy to create specific requirements for the respondent panel and recruit those respondents. The entire process, from launch to the completion of the field work requires approximately 1-2 hours, with the individual ‘interaction with each respondent lasting about 3-4 minutes.
Step 8: Create the Database in a Format that Will Be Ready for Downstream Statistical Analysis
The data for each respondent comprises 24 rows, one row for each vignette. The information contained in each row groups of columns. The first group of columns in the database comprises information about the respondent from the self-profiling classification. The second group of columns comprises information about the composition of the vignette (16 additional columns, ‘1’ coding element present in vignette, ‘0’ coding element absent from the vignette). The third group of columns comprises information about the response to the vignette (the order of the vignette for the respondent from 01 to 24, the rating assigned by the respondent, and the response time for the vignette, defined as the number of hundredths of seconds between the appearance of the vignette and the assigned rating.)
Update the database by creating new variables, R1, R2, R3, R4, and R5, respectively. These new variables, R1-R5, are binary transformations of the ratings. The rationale for the transformed variables comes from the experience of author HRM, with users of the Mind Genomics results. Most users want to make decisions using the data. To do so, the user must ‘understand’ the meaning of the results. An average score on a scale does not help the user. The user is far more likely to understand the average when the average is couched in the language of ‘yes/no.’ Thus, it has become common practice to convert the ratings to a binary scale. For these data, each of the five rating points has been made into its own binary scale, generating five new binary transformation scales, R1 – R5. For example, when the respondent assigned a rating of ‘5’ to the vignette, variable R5 becomes ‘100’, whereas variables R1-R4 each become ‘0’. For purposes of subsequent statistical analysis, a vanishingly small random number (<10-4) is added to the newly created binary transformed scale. In this fashion the data are prepared for subsequent statistical analysis with the out of that statistical analysis immediately understandable to the user of the data.
Step 9: Relate the Presence/Absence of the 16 Elements to the Transformed Dependent Variable
OLS (ordinary least-squares) regression, also known as ‘curve fitting,’ is a standard analytic technique in statistics. OLS regression attempts to determine the contribution of each of the 16 elements to the transformed binary rating. For the analyses run in this study, we will use a variation of OLS regression which forces the equation through the origin, rather than estimating an additive constant. The traditional analysis for Mind Genomics studies has been to fit an equation of the form below to the data, with the additive constant, k0, showing the estimated value of the transformed variable in the absence of any elements. The additive constant, k0, has been treated as the baseline value, the value of the dependent transformed variable in the absence of elements. All vignettes comprise 2-4 elements, according to the underlying design, so that the additive constant is statistically correct, but may not necessarily add much information, since the focus is on the contribution of the elements themselves, not on the baseline value.
Transformed Variable with additive constant (e.g., R5)=k0 + k1(A1) + k2(A2) … k16(D4)
Transformed Variable without additive constant (e.g., R5)=k1(A1) + k2A2) … k16(D4)
To assess the impact of using an equation without the additive constant (called ‘forcing the equation through the origin’) we created nine dependent variables, as shown in Figure 5. The first five dependent variables were R5 – R1 The second set of four dependent variables were binary sums of the binary variables, to denote responses of ‘people better off’ (P+) ‘environment improved (E+), ‘people not better off’ (P-), and ‘environment damaged’ (E-). Figure 5 shows that the values of the coefficients (k1-k16) may differ, but in all cases the coefficients are virtually parallel, albeit with different values. This demonstration gives us the confidence to work with the equations lacking an additive constant.
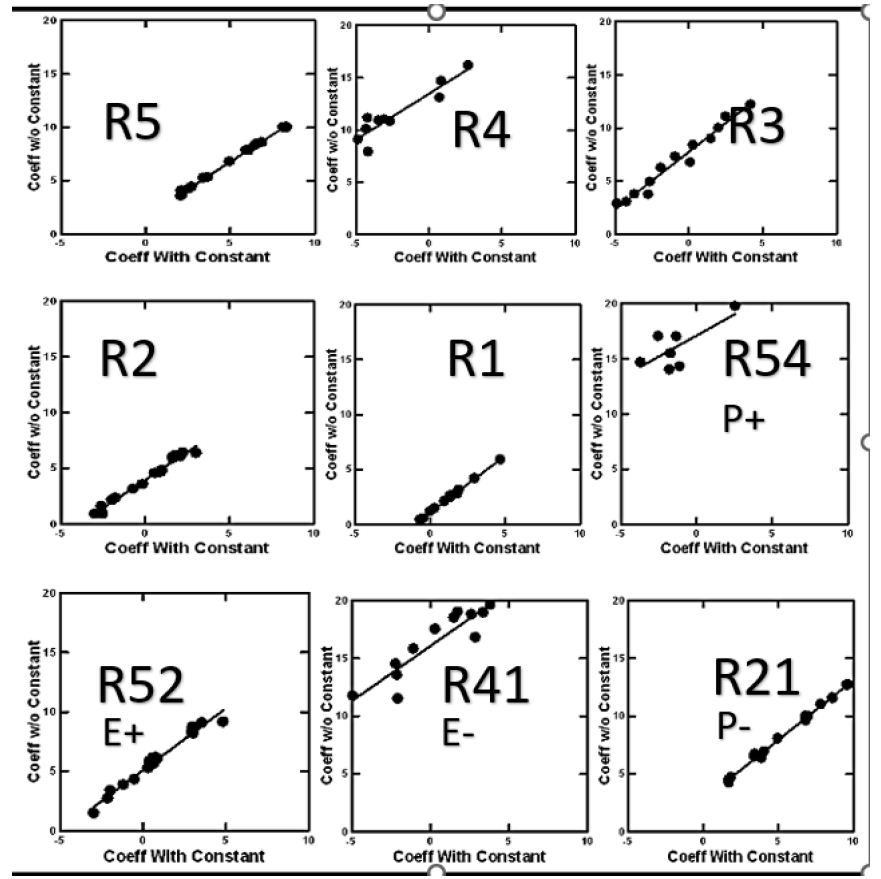
Figure 5: Scatterplot of coefficients for Total Panel for nine binary dependent variables, for equations with vs without an additive constant.
Step 10: Analyze the Results from the Total Panel
In a sense the major effort of the Mind Genomics exercise is to discover how the different elements drive the response. For our study we focus on six different responses, expressed by the dependent variables. These are positive and negative responses to the elements in terms of people and environment, respectively, as well as the rating of ‘don’t know’. Tables 5 and 6 show all coefficients of +11 or higher. These are elements which would be ‘statistically significant’ for equations without an additive constant, the T statistic being 2 or higher. Table 5 also shows all coefficients of 20 or higher in shaded cells to highlight the fact that they are to be considered ‘very strong performers.’
Table 5: Coefficients for selected equations relating the presence/absence of elements to key dependent variables. Strong performing elements are shown in shaded cells. Elements with coefficients 10 and lower are not shown.
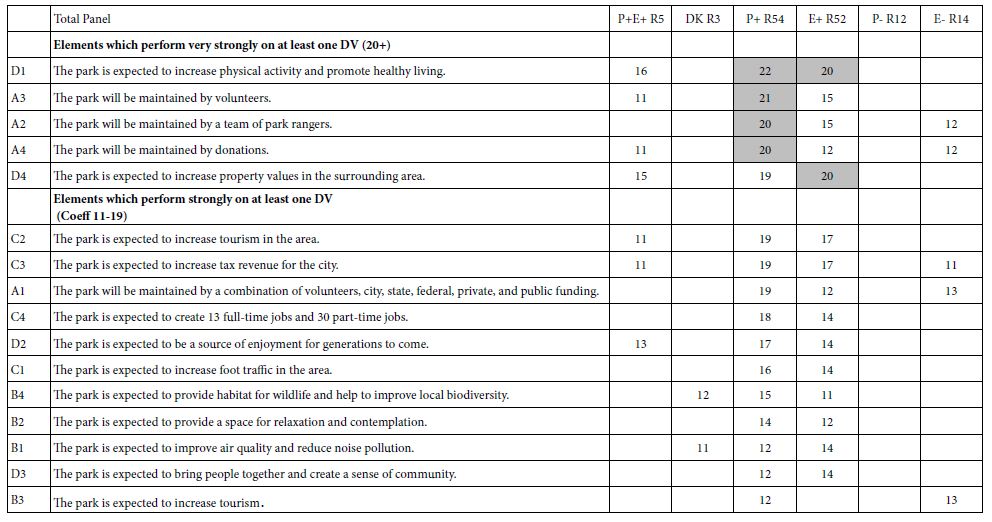
Table 6: Coefficients for the 16 elements, estimated for the two mind-sets on five dependent variables
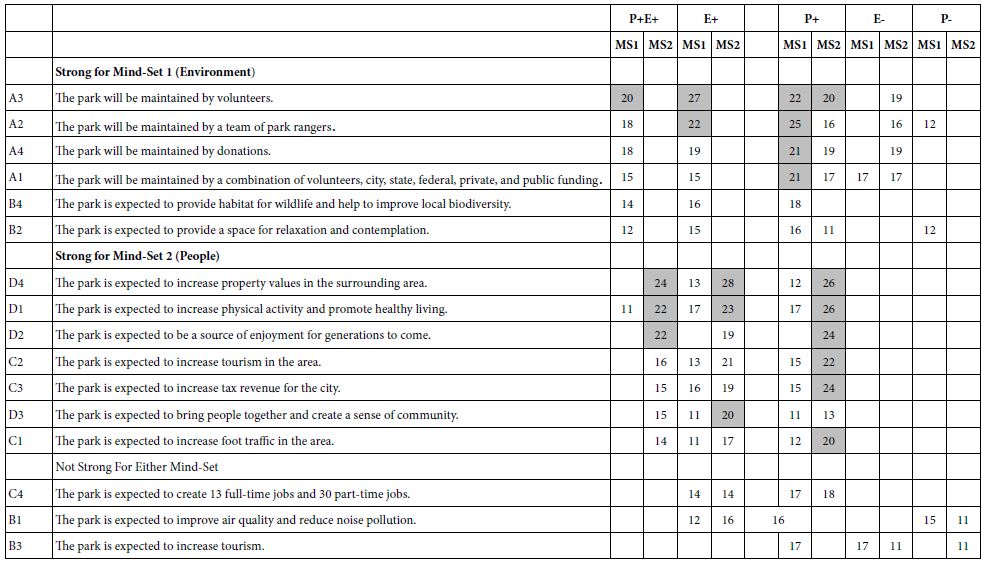
Table 5 shows only one element which performs well for the total panel, D1, The park is expected to increase physical activity and promote healthy living. This element performs well on both driving personal well-being (P+) and driving good for the environment (E+).
Two elements are seen to be both positive for the environment (E+) as well as negative for the environment (E-).
A2 The park will be maintained by a team of park rangers.
A4 The park will be maintained by donations.
In contrast, no element is seen to be negative for the people (P-), perhaps because the concept was developed for people, with the environmental impact as an afterthought.
During the setup of the study, and quite inadvertently, the topic of ‘tourism’ was included twice, one as a general statement, the other time as a specific statement. The coefficients for these elements differed. The coefficient for element B3 ‘The park is expected to increase tourism’ emerged as positive for the people (coefficient +12 for dependent variable P+) but negative for the environment (coefficient + 13 for dependent variable E-). In contrast, when the text was changed in element C2 ‘The park is expected to increase tourism in the area’ the pattern of coefficients changes. C2 now generated a coefficient of +11 for dependent variable P+E+, and coefficients +19 for dependent variable P+ and +17 for dependent E+, respectively. This finding suggests that in the mind of the respondent it is not only the action but also an enhanced explanation of the action which ends up driving the response.
Step 11: Uncovering Mind-sets, viz. Respondents Who Think Similarly about the Granular Topic of this Park
The world of consumer research has long recognized that people are different from each other, but for many years the researchers relied on differences in the way people described themselves. A hallmark of Mind Genomics is the effort uncover mind-sets, different ways of thinking about the same granular level topic. By mind-set we refer to data-based patterns which seem to ‘tell a coherent’ story (interpretability), and which seem to require only a few of these patterns (parsimony).
The mind-sets are uncovered by creating individual-level models of the type shown in Table 5, but with each respondent generating a complete model comprising 16 coefficients. The dependent is R5 (good for the people; good for the environment). The coefficients can be positive, zero or negative, depending upon the data set. The OLS regression modeling creates one equation for each of the 61 respondents, able to do so because the underlying permuted experimental design creates a valid design for each respondent. The data for each respondent can be analyzed, person-by-person, to estimate the values of each of the 16 coefficients.
The only steps left are to divide the 61 respondents for this study into two (or possibly more) groups, based upon an objective viz., non-judgment-based metric. The metric is (1-Pearson R), computed on the 16 pairs of corresponding coefficients for two respondents. The analysis returns with the measure (1-R), where R is the Pearson coefficient computed for the 16 pairs of coefficients. R measures degree of relation. When the variables are parallel to each other, they are almost indistinguishable. They probably measure the same thing, and the value (1-R) is 0 because R=1. In contrast, when the variables are opposite, then they are probably measuring different things, and the value (1-R) is 2 because R=-1.
An underlying clustering program assigns the 61 respondents first to two different groups, and then to three different groups, based upon the pattern of their distances from each other. The clustering program [8] uses objective criteria. It is the job of the researcher to interpret these mind-sets which emerge. Table 6 shows the coefficients for two mind-sets, M1 and M2. There clusters emerging appeared to be clear, obviating the need for a third cluster. Mind-Set 1 (M1) appears to respond more strongly to environmental issues and implications. Mind-Set 2 (M2) appears to respondent more strongly to the welfare of the people who will use the park.
Step 12: Scenario Analysis to Uncover Pairwise Interactions among Elements
An ongoing issue in the study of communications and decision making is to understand how ideas or messages interact with each other [9]. The importance of interactions is well known in the world of physical design when an actual object is created. When the interactions ‘work’ there is a positive response to the combination. When the interaction does not ‘work’, there is a sense of something wrong with the combination, and the designer or fabricator tries another combination. When the topic turns to language, the issue of interactions becomes less clear.
The Mind Genomics process enables the discovery of how one element affects another element. We illustrate the study of the interactions with our data on the park. The process will work when the researcher uses the permuted design. We illustrate the approach using the interactions of the four elements from Question A (how the park is cared for), with each of the remaining 12 elements, four each from Questions B, C, and D, respectively.
- Create a new variable. We call this variable ‘ByA.’ For each vignette tested, this new variable takes on one of five values, depending upon the which of element The variable takes on one of five values, 0-4, depending upon the which of the four elements from Question A appears in the vignette, or when Question A does not contribute to the vignette.
- Separate the data into five strata, depending upon the value of ByA.
- For each stratum, create an equation expressed as: R5=k5(B1) + k6(B2) .. k16 (D4).
- Put the do this analysis for any defined group. For our study we compare the results across the two emergent mind-sets, Mind-Set 1 who were defined as ‘environment’ oriented, and Mind-Set 2 who were defined as People Oriented.
- Table 7 shows the parameters of the equations. Table 7 shows five columns of coefficients, one column for each element contributed (or not contributed) by Question. Table 8 divides into two parts, the top for Mind-Set 1 (Environment focused) and the bottom for Mind-Set 2 (People focused).
- Scenario analysis is simple a method to look at interactions, generating a great deal of data. It is important to arrange the output in a way which generates relevant insights. The header rows in Table 7 show the relevant comparisons in shade.
Table 7: Summary worksheet for Scenario analysis. The defining stratum is Question A
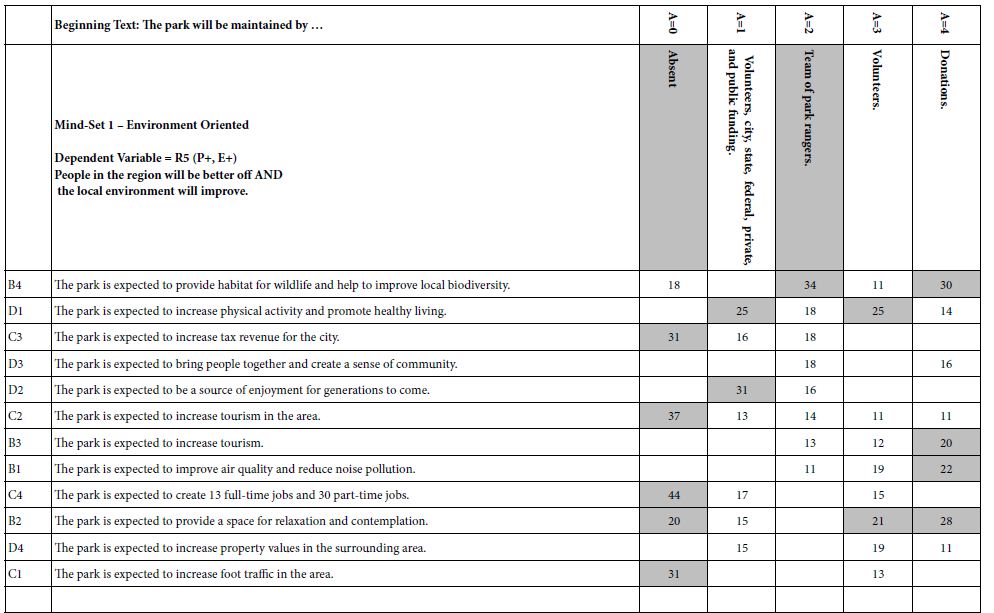

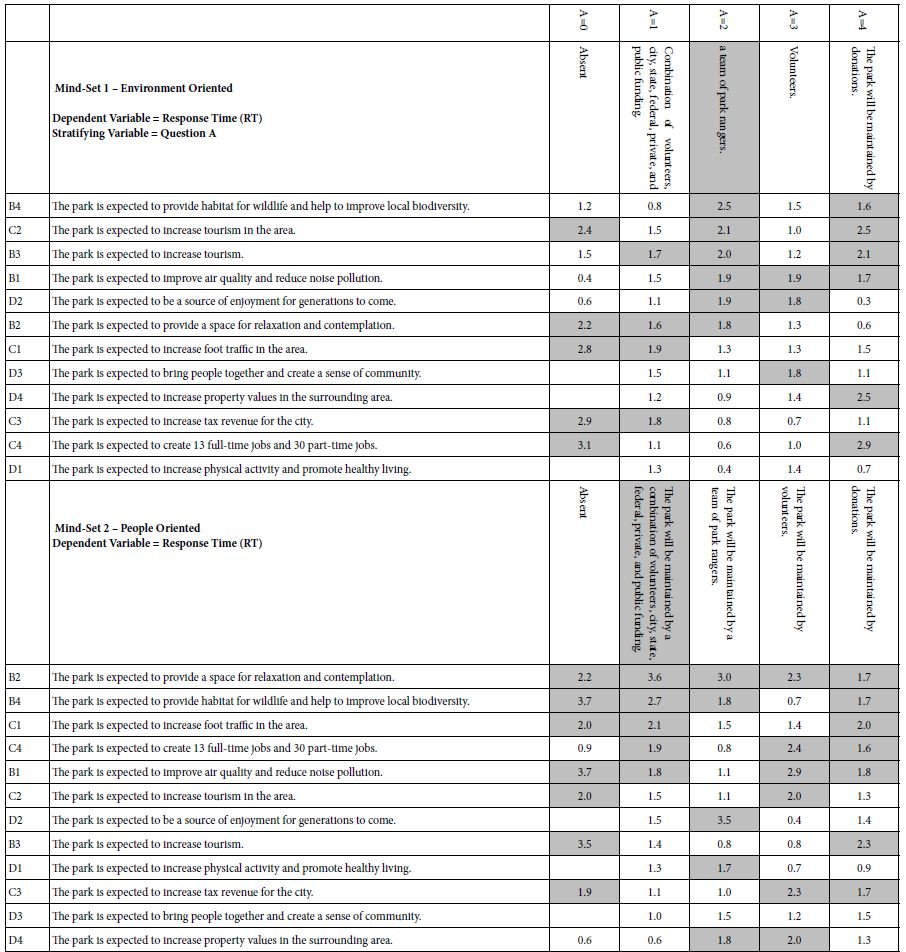
Table 8: Presents the two set of response times, the top for Mind-Set 1 (environment oriented), the bottom for Mind-Set 2 (people oriented).
Mind-Set 1 (Environment oriented) – compare column A=0 (no element about maintenance) to column A=2 (The park will be maintained by a team of park rangers). We would expect that adding ‘team of park rangers’ to the vignette would ‘synergize’ with the other elements, increasing their magnitude. The coefficients are sorted by their magnitude when in the presence of A2 (team of park rangers). The synergistic effect is dramatic, as shown by the highest scoring element. This element is B4, ‘The park is expected to provide habitat for wildlife and help improve local biodiversity’. In the absence of any element from maintenance, B4 is still a strong performer, with a coefficient of +18. When, however, the ‘team of park rangers’, is added to the vignette, the coefficient for B4 virtually doubles, from 18 to 34. Unfortunately, however, for Mind-Set 1 focusing on the environment, synergisms are not common. This relatively rarity of synergisms suggests the possibility that the ‘way of thinking’ of Mind-Set 1 may be ‘particularistic’, looking at one item at a time, the key item.
Mind-Set 2 (People oriented) – compare column A=0 (no element about maintenance) to column A=1 (The park will be maintained by a combination of volunteers, city, state, federal, private, and public funding). There are four synergisms, all from Question D, about what the park will provide to people. Mind-Set 2 may be ‘integrative’, looking at combinations of items, rather than focusing on the one aspect, viz., the environment.
Step 13: Scenario Analysis Applied to Response Time
The Mind Genomics program, www.BimiLeap.com, measures the times between the appearance of a vignette of the respondent’s computer screen and the assignment of the response. For two centuries, researchers have used the response time as a measure of internal psychological processes that may or may not be readily explained [10]. The assumption made by researchers is that the response time elapsing between the stimulus appearance and the response is an indicator of underlying psychological processes. For the most part, the response times are either to posit the existence of some underlying psychological process, or to show differences in the speed of response due to external factors imposed on the respondent.
The pattern of responses times for the two mind-sets suggests different priorities in what engages attention.
When we look at Mind-Set 1, focus on the environment, and pay attention to the potentially synergistic effects with element A2 (The park will be maintained by a team of park rangers) we find a lot more engagement (viz., longer response times) emerging with elements dealing with the general public good.
The park is expected to provide habitat for wildlife and help to improve local biodiversity.
The park is expected to increase tourism in the area.
The park is expected to increase tourism.
When we look at Mind-Set 2, focus on people, and pay attention to the potentially synergistic effects with element A1 (The park will be maintained by a combination of volunteers, city, state, federal, private, and public funding). we find more engagement (viz., longer response times) emerging with elements dealing with the public good.
The park is expected to provide a space for relaxation and contemplation.
The park is expected to provide habitat for wildlife and help to improve local biodiversity.
The park is expected to increase foot traffic in the area.
Discussion and Conclusions
The use of research to deal with issues of public policy is well accepted. What is not so well accepted is the ability to use so-called ‘high powered’ research methods for local problems. Typically, when local issues arise there might be a referendum called, with people answering a few questions on an easily tabulated questionnaire or showing up for a town-hall type meeting where the topic is discussed, and a vote taken. These methods are the working of local democracy and occupy a hallowed place in the machinery of local government.
The advent of DIY (do it yourself) research has made it attractive to use stronger methods to understand people. For example the small problem of public opinion about the effects of the park has been elevated from an opportunity to measure responses to a momentary issue to a deeper way to understand the way people think. The scale of the problem is important. The world abounds in small-scale problems, important to some, but most important ‘real’. Rather than simply creating an artificial test situation to explore how we make decisions, or perhaps waiting for very rare major events to occur, the researcher can now apply powerful tools to everyday issues to extract information about the mind of the average citizen for real-world but minor issues.
A popular method for approaching problems is called scenario analysis [11]. It is from the conventional scenario analysis that the name was adopted for Mind Genomics. The notion is to lay out the combinations of different factors, not necessarily in the fashion of experimental design, but still lay out reasonably complete, and alternative combinations. An analysis of these scenarios gives a sense of what alternatives are optimal in a world where one can choose different paths. The standard methods have been used in areas such as hospital design [12], the environment [13], and as a method for risk analysis [14].
Armed with these new tools such as Mind Genomics, and applying these tools to many types of problems, and in many countries, one can only speculate on the further evolution of our knowledge of the ‘mind of society.’ It may well turn out that topics which produce a great deal of ‘heat’ through argumentation from different viewpoints may end up producing knowledge of different ‘minds’, and the opportunity to find middle-positions through the research, positions allowing for constructive solutions.
References
- Perkins RL (1984) History and System: Hegel’s Philosophy of History. State University of New York Press.
- Eismont O (1994) Economic growth with environmental damage and technical progress. Environmental and Resource Economics 4: 241-249.
- Malhi Y, Roberts JT, Betts RA, Killeen TJ, et al. (2008) Climate change, deforestation, and the fate of the Amazon. Science 319: 169-172.
- Easterling RG (2015) Fundamentals of Statistical Experimental Design and Analysis. John Wiley & Sons.
- Moskowitz HR, Gofman A, Beckley J, Ashman H (2006) Founding a new science: Mind genomics. Journal of Sensory Studies 21: 266-307.
- Moskowitz HR, Gofman A (2007) Selling Blue Elephants: How to Make Great Products that People Want Before They Even Know They Want Them. Pearson Education.
- Gofman A, Moskowitz H (2010) Isomorphic permuted experimental designs and their application in conjoint analysis. Journal of Sensory Studies 25: 127-145.
- Likas A, Vlassis N, Verbeek JJ (2003) The global k-means clustering algorithm. Pattern Recognition 36: 451-461.
- Egami N, Imai K (2018) Causal interaction in factorial experiments: Application to conjoint analysis. Journal of the American Statistical Association 114.
- Bassili JN, Fletcher JF (1991) Response-time measurement in survey research a method for CATI and a new look at nonattitudes. Public Opinion Quarterly 55: 331-346.
- Huss WR (1988) A move toward scenario analysis. International journal of forecasting 4: 377-388.
- Capolongo S, Buffoli M, di Noia M, Gola M, Rostagno M (2015) Current scenario analysis. Improving Sustainability during Hospital Design and Operation: A Multidisciplinary Evaluation Tool 11-22.
- Duinker PN, Greig LA (2007) Scenario analysis in environmental impact assessment: Improving explorations of the future. Environmental Impact Assessment Review 27: 206-219.
- Hassani B, Hassani BK (2016) Scenario analysis in risk management. Springer International Publishing Switzerland.