Abstract
The paper presents a deep reanalysis of the response by consumers to pricing and emotion messages from 30 parallel studies of non-perishable products. The nine pricing and the nine emotion messages were approximate the same across the 30 products. Considering the results from 3656 respondents for pricing, and separately for emotion, revealed the exists about 2-3 new mind-sets, appearing across each of the 30 products. The ability to study judgments of pricing statements separately from judgments of emotion statements provides an increased power of research to more deeply understand the thoughts and feelings of ordinary people in ordinary situations. The implementation demonstrated successfully by the project, ‘Buy It!’ using Mind Genomics suggests the simplicity of creating a database of the mind across products, genders, ages, even cultures, and times, with the data easy to acquire, analyze, and apply.
Introduction
The topic of shopping consumes the attention of researchers, especially market researchers, consumer psychologists, economists, and occasionally occupies clinicians who are called in to deal with dysfunctional behavior involving shopping, especially compulsive shopping [1]. A great deal of the work is from the top down, looking at behavior, tabulating what people like about shopping, about products, and so forth. For the most part, the research focuses on the product, primarily because it is the focus of the marketer of products to sell the product. Whatever can be culled about the shopping situation is of interest to the product marketer, especially when that specific information helps ‘move product.’
Shopping as a behavior attracts a number of disciplines because it represents a fundamental set of behaviors necessary for survival, and an integral part of civilized life. The literature of shopping spans disciplines ranging from focus on the unconscious motives of people [2], to the behavioral economics involved in price [3-6], to the art and science of advertising, and onto the design of the shopping environment, and the observation of people shopping from the point of view of anthropology [2,7-11].
The consumer researcher working in an applied setting is not to be left out of this world. Companies which manufacture products and which offer services are interested in the process of shopping, to understand the way people think, or in today’s parlance the ‘shopper’s journey.’ One need only look at conferences today, many of them sponsored by organizations involved in for-profit consumer researcher, to discover the way companies use different research methods to provide so-called ‘shopper insights [12]. One will come across virtual shopping, a technology going back more than three decades [13], where the store can be set up. One will come across shop-by’s, wherein a researcher will accompany the shopper, asking questions at strategic points. Or one might well encounter eye tracking devices, which measure where on the shelf the shopper’s eyes alight [14,15].
At the most general levels are questionnaires, surveys about the shopping experience. These questionnaires can be of the most general kind, instructing respondents to rate the importance of different aspects of shopping, although such approaches seem to be quite general, and hard to deal with in an abstract situation. If questionnaires and surveys seem too abstract one need only wait, visit a store or a restaurant, to be bombarded later by questionnaire about how was the experience, as stores restaurants, even hospitals and physician’ office attempt to become smarter about the ‘purchaser.’
The Contribution of Experimental Design and Mind Genomics to the Understanding of Shopping
A key issue in research is what is important to the shopper. The question sounds easy, but deceptively so. When one talks about ‘what is important,’ one is requiring the respondent to abstract from a lifetime of experience to provide one number. The typical answers for ‘what is important to you’ are such generalities as price, assortment, product quality, product price, product reliability, convenience of shopping, and so forth.
The reality is that such questions as ‘what is important’ are hard to answer. The difficulties come from different sources. The first source is that it is hard to abstract an experience and rate it. It’s one thing to ask, ‘how much do you like oranges,’ or some other food product. That is pretty easy to answer, although the reality is that the respondent has to call up into memory the orange, and the last time the respondent ate the orange. Once the respondent has eaten an orange and remembers it, the rest is easy. The difficulty occurs when we move from a simple situation, remembering an orange, to the more amorphous situation of shopping for something. Shopping for an item is not like eating the item, in the most direct 1:1 comparison. For example, it may be straightforward to ask, ‘how much do you like eating an orange?’ It is much more difficult, and involves many more subtleties when the question is ‘how much do you like shopping for oranges?’. Furthermore, it’s fairly straightforward to ask a person about the degree to which a person likes or dislikes different aspects of oranges (or a specific orange), such as appearance, aroma, taste/flavor mouthfeel, etc. It’s far harder to answer that question about liking the different parts of the shopping journey for an orange.
The published data, but even more so the private data in the hands of companies, tell us a lot about the shopping experience. Most of the information can be categorized as ‘outside-in.’ That is, we ask the respondent to tell us what is important, or we infer importance by observing behavior. Occasionally, we may ask the respondent to describe the experience in his or her words, exercises which produce so-called ‘verbatims’, or records of the experience of shopping from the mind of the shopper, ask to describe what is happening during the experience. Often this is the richest kind of data because it gives a sense of what the respondent is thinking.
As a prelude to this paper, and the approach discussed in detail, let us begin with the some of the data that the study provides. We do so by putting the study in perspective. The respondent who began did so by selecting a product from a set of 30 products. We thus know that the respondent was interested in the product at some level. The respondent evaluated 60 different vignettes about the shopping experience. Afterwards, the respondent completed a self-profiling vignette. Question #8 presented the respondents with 26 factors, such as appearance, price, et al. The respondent was to check off three of the 26 elements which were deemed most important in the shopping experience.
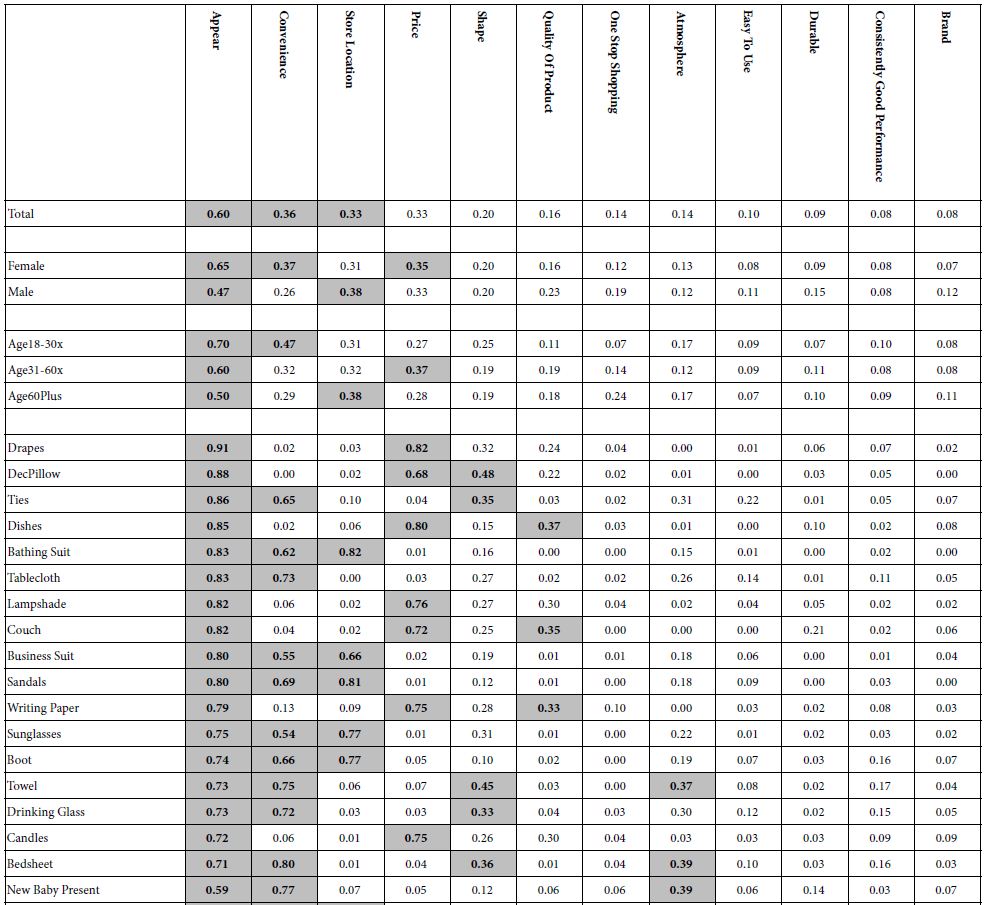
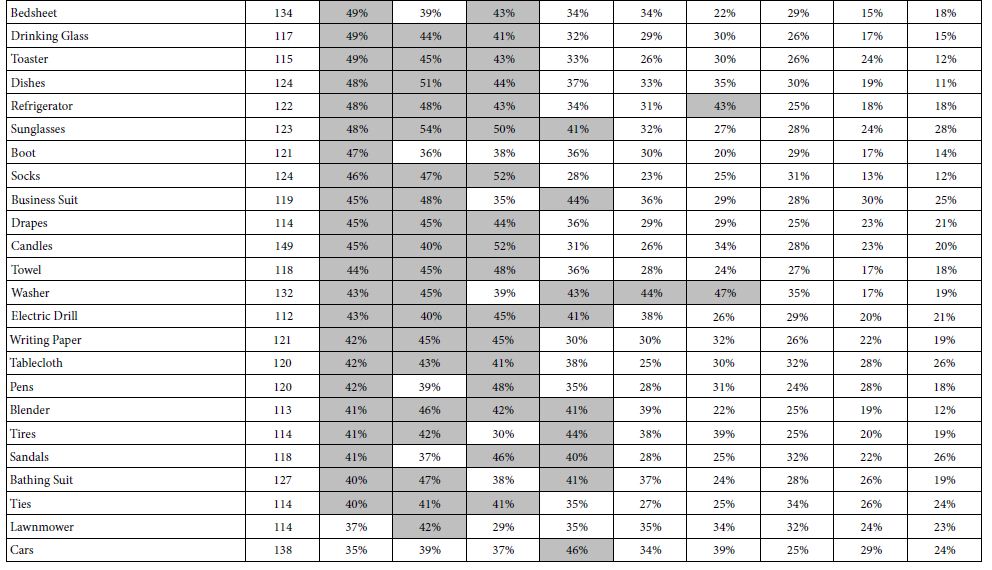
Table 1 shows the distribution the 12 most aspects of shopping to the respondent. What is important about the numbers in Table 1 is that they allow us a sense of what the respondent feels to be important. What is troubling, however, is the lack of psychological depth, a lack of meaning, other than the most general. There is nothing to connect the term with the shopping experience. It is for that reason that we present an analysis of both shopping and emotional responses to the shopping experience, and determine how these more contextualized, elaborated phases, apply to the shopping experience.
Table 1: Factors that are deemed important to shopper, overall, by gender, and by age. The product data are arranged in descending order by appearance.
A good analogy is the difference between the plot of a novel or play, and the way evocative language brings the plot to life, engaging the reader. It is this ‘bringing the plot to life’ or the letter the mind ‘talk a bit’ in richer language that is the objective of Mind Genomics. The results are both a database and a richer comprehension of the inside of the mind revealed by the pattern of a person’s thought through Mind Genomics cartography, a simple experiment.
Mind Genomics, What it is, Where it Comes from, and How it Evolved to the It! Studies
The original research efforts upon which this reanalysis and paper is based came from pioneering research efforts using Mind Genomics experiments (cartographies) to study how people responded to what makes a shopping experience ideal for them. The project was funded by the University of Indiana. The goal was to create a way to understand the inner mind of a shopper, using experimental design and the (then) newly emerging research approach, first known as RDE (rule developing experimentation) [16], and then known as Idea Map, and finally as Mind Genomics.
The guiding rationale for Mind Genomics is that people respond best to contextualized combinations of ideas, and not to single ideas alone. We are dealing with people, and their evaluation of different representation of ideas that they would encounter in their daily life. Thus, in the world-view of Mind Genomics, the optimum research approach is to combine ideas into vignettes, so that the respondent evaluates a description closer to everyday reality. It seemed quite appropriate to study the mind of shoppers using this method. The key issue was what the stimuli would be to uncover the shopper mind, or more correctly to define what should be measured to uncover the shopper mind.
Mind Genomics creates combinations of messages, combinations of elements, and these elements telling somewhat of a story. The elements are phrases which describe the product or the service. The combinations are called vignettes. Typically, in a Mind Genomics study, the topic is first chosen, and then a set of questions posed. These questions ‘tell a story,’ or at least attempt to give different facets of the topic. Each question becomes the impetus to generate answers, these answers providing specific information about the shopping experience. It is the structured analysis of this type of data which allows Mind Genomics to generate a description of what might be going on in the mind of the shopper.
The next sections below will present the Buy It! project in more detail. Right now, it important to understand the world view of Mind Genomics, its history, and its modification to create the It! studies. These It! studies were developed in a pioneering effort to understand the world of consumer decision making, here for the shopping experience.
The emerging science of Mind Genomics as founded in the 1990’s, combining statistical design of ideas and consumer research, inspired by the pioneering effort of Wharton professors, Paul Green and Yoram (Jerry) Wind. The scientific power and practical applicability of conjoint measurement were to demonstrate themselves in those who used the conjoint methods to study shopping behavior [17].
Looking back a 50-year history, it is abundantly clear that most of the studies ended up being ‘one-off’, half the published paper discussing method, half the study discussing the actual topic results and implications. The studies themselves ranged across many aspects of human behavior, from products to services to even beliefs. The fascination with understanding human decision making through these tools was obvious, but left behind was the untapped potential of creating a database of the mind, using conjoint measurement.
During the early years of the 21st century, author Moskowitz and colleagues at the Understanding and Insight Group, Inc., became interested in creating a large-scale database on topics, using Mind Genomics [18]. It was to address the opportunity of a larger-scale data of the mind which prompted the creation of an approach known as the It! Studies. The approach, developed by the late Hollis Ashman and Jacqueline Beckley of the Understanding and Insight Group, together with author Howard Moskowitz, would put together a group of related studies, studies with similar underlying structure. The major difference among the studies would be the topic. The minor differences would be the specific wording pertaining to the topic.
In the specific studies, each respondent evaluated a unique set of combinations, the vignettes, the messages created by experimental design. Each respondent would rate a unique set of 60 vignettes, rating each vignette on a common scale for the entire set of studies, and all the vignettes. The rating scale would be something: How well does this vignette describe your ideal shopping experience, 1=Not at all … 9=perfectly. In other studies, such as dealing with emotional stressful issues (Deal With It!), the rating scale might be something like ‘How do you feel about this? 1=Can deal with it … 9=Cannot deal with it.’ These are not the actual words, but they give a flavor of the way the rating scale was designed.
The focus of the rating scale was on the degree to which the vignette described something in the mind of the respondent. The assumption was that the respondent may not be able to describe what she or he feels or is thinking, but can recognize it when presented. Psychologists have often reported that recognition memory is easier than reproduction memory [19].
Thus far we are dealing with a new form of test stimulus, a systematically varied set of combinations of answers to questions. Each respondent evaluates a different set of combinations, so that the Mind Genomic experiment covers more of the possible ‘space’ than would any conventional approach. It is with this approach then that the researcher can explore the way people make decisions in the world of the normal, the quotidian, the everyday, such as shopping.
The Buy It! Studies
The It! study reported here deal with the mind of the shopper, for durables, viz., non-perishable items. Figure 1 shows the 30 topics. The goal was to understand how people react both to the product, and to the nature of the store. It is the latter topic, which is of interest here, specifically how people respond to the store based upon what it announces about its pricing, and the shopping experience to be expected.
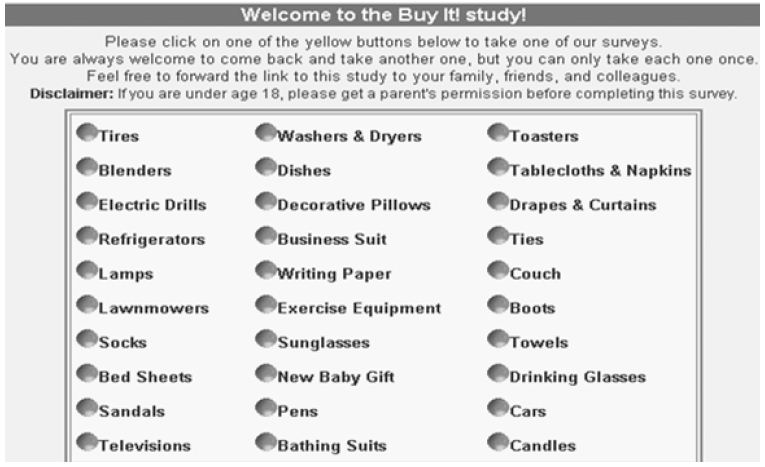
Figure 1: The 30 products, shown as a wall to the respondents, who would choose the product of interest to them.
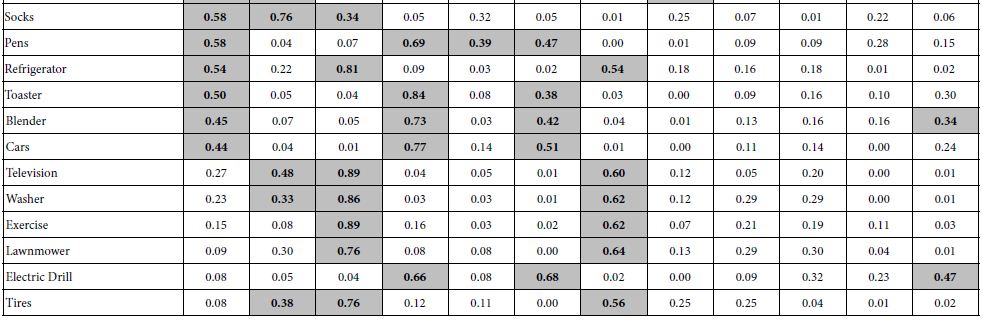
Step 1 – Select the 30 Products
Figure 1 shows the 30 different products that were studied, each product the subject of a separate Mind Genomics cartography, in which the respondent would evaluate different vignettes (combinations of statements about the store, for a specific product). Figure 1 is called the ‘wall’. The respondents who agreed to participate were able to choose a product that interested them. When the ‘quota’ for the product was filled the product ‘disappeared’ from the wall. Once again, the purpose was not to present a method, nor to study one topic in depth (viz. one product), but rather to create an integrated database across many respondents and non-perishable products.
Step 2 – Choose the Raw Materials (Elements) that would be Later Incorporated into the Study
The objective of the It! studies was to create a database whose elements could be compared to each other. The strategy to create the raw materials begins with asking questions, here four questions, and providing nine answers to each question. This so-called 4×9 design was the one use for all It! studies, generating36 elements.
The elements had to be particularized for the specific product. For example, many of the elements for ‘candles’ would not be appropriate for ‘sandals’ nor for ‘cars. Yet the form of the element could be maintained. Figure 2 shows the nature of the four questions. Table 2 presents the full set of answers in shortened form, both for Question 2 and for Question 3, respectively. The elements in Question 2 (Service, pricing scheme) and Question 3 (emotional benefits) were most similar across the 30 products, and did not need particularization. It will be the results from Question 2 and Question 3 which will constitute the data from which the analyses in this paper are drawn.
Figure 2: The structure of the four questions, and the nature of the answers to the questions.
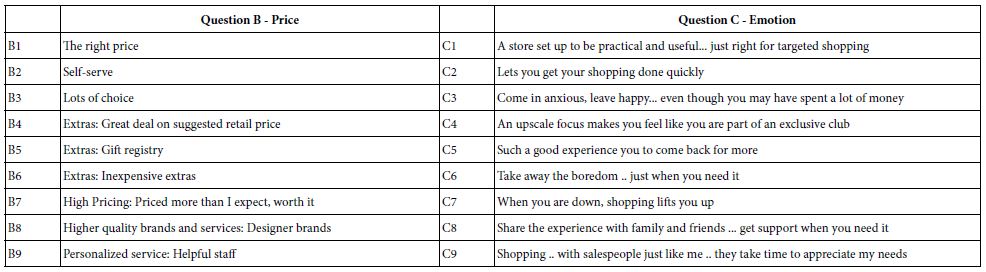
Table 2: The topics of the Questions B (Price) and C (Emotion).
Step 3 – Combine the Element (Answers) from the Four Questions into Small, Easy to Read Vignettes
The objective of the Mind Genomics effort is to identify the degree to which each of the 36 elements drives the feeling that the element contributes to the person’s ideal shopping experience. Rather than asking the respondent to check off different words or simple, colorless phrases as being important, Mind Genomics deduces the importance of richer, more evocative phrases, but does it in a more subtle, more ecologically meaningful way. A potentially more productive way combines phrases such as the answers from Questions 1-4, creating vignettes, combinations. The respondent is present with combinations, one combination at a time, rating how well the experience described by the combination of phrases (elements) in the vignette matches the person’s ideal shopping experience. People are accustomed to combinations of features in life, not to single ideas. The task becomes simply to match scale values to compound sets of messages.
The task may seem hard, but once the respondent gets accustomed to the fact that the vignette comprises disconnected phrases, the respondent seems to have no problem rating the combination. Of course, when asked the respondent will say that she or he did not know the ‘right answer,’ was just guessing. Yet the results will show clearly that the respondent was paying attention to the individual features. The story, the vignette, the combination was just there to present something that was realistic in its moderate complexity, preventing the respondent form gaming the system.
The actual combinations of the elements are prescribed by an underlying experimental design, a recipe book of combinations. Although the combinations may be thought of, and even described as random, nothing could be further from the truth. The 60 vignettes prescribed by the design allow each of the 36 elements to appear equally often, and ensure that the 36 elements are statistically independent of each other. The design prescribes combinations comprising 2-4 elements, at most one element or answers from each question, but often no element from either one or from two of the four questions. It is this particular arrangement which allows the researcher to estimate the relation between the presence/absence of each of the 36 elements and the rating (or more correctly the transformed rating). The method for estimation, OLS (ordinary least-squares regression) is perfectly adapted to work with experimental designs.
One more feature of the design is worth noting and emphasizing, the permuted design [20]. The family of permuted designs comprises designs which are mathematically the same, but whose combinations differ. Permuted designs, pioneered by the author and Alex Gofman, in the late 1990’s) ensures that there could be 200 or so different sets of combinations. The researcher using Mind Genomics need not be ‘right’ in the selection of the 60 vignettes, a frequently-encountered problem in conventional research. Rather, the Mind Genomics approach allows exploration of many different combinations. With 100 respondents, the Mind Genomics design ends up testing 100×60 or 6000 different vignettes, 6000 different combinations. Even when there is a great deal of ‘noise’ around each of the 6000 combinations, the pattern underlying the data is generally well-revealed by working with the 6000. Thus, Mind Genomics sacrifices the standard practice of narrowing vision but increased precision within that vision, abandoning that approach to the heretical but ultimate more success approach of broad view, less precision at any point, but ultimately far more precision when the grand pattern is encountered.
Figure 3 shows an example of a vignette the way the respondent would see it. The elements or answers are placed one atop the other, centered, with the rating scale on the bottom. The result is a format easy for the respondent to inspect and visually graze. The respondent may find this strange at first, but eventually the respondent looks at the vignettes, and almost automatically assigns a rating. The respondent generally does not pay much attention to the task, nor is the respondent asked to do so. It suffices that the respondent moves through the evaluation. One can always test for randomness at the level of the individual respondent by computing the goodness of fit of the individual models to the data [18].
Step 4 – Acquire the Ratings, Transform the Ratings to a Binary Scale, and Create the Equations on a Respondent by Respondent Basis
Step 4 constitutes the heart of the data preparation. The Mind Genomics program creates the combinations for each respondent as prescribed by the specific permuted variation of the experimental design, presents the combination on the screen, acquires the rating, and then moves to the next screen. The process is quick, allowing the respondent to rate a vignette almost every 3-4 seconds. The respondent rates each of the 60 vignettes on a 9-point rating scale, shown in at the bottom of Figure 3.
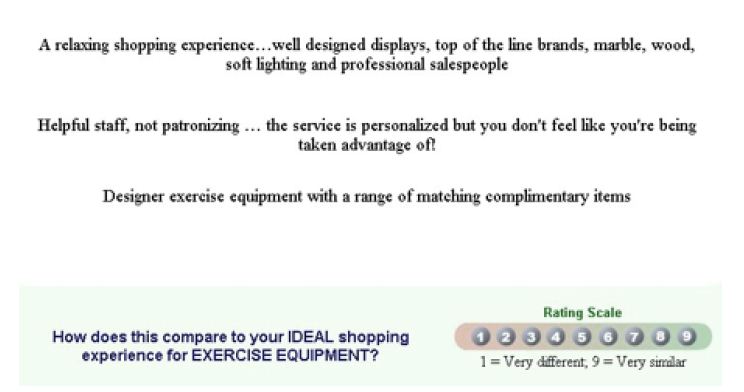
Figure 3: Example of a three element vignette for exercise equipment. This vignette would be presented to one of the respondents choosing the Buy It! study dealing with exercise equipment. It is quite likely in the order of things that this vignette would be presented to only one respondent.
As attractive as the Likert scale of nine (or fewer points) may be, most users of research data do not find it straightforward to interpret the meaning of the scale. The attractiveness of research is greater when the user can see a story. Most users of research prefer answers couched in the ‘yes/no’ mode, viz., that the answer suggests one group (yes) or another group (no), what the topic may be. That binary thinking should be reflected in the data. To do so the Mind Genomics convention for 9-point scales converts ratings of 1-6 to 0 to denote no/low, and ratings of 7-9 to 100, to denote yes/high. To each converted rating is added a vanishingly small random number (< 10-5), which ensures some minimal variation in the ratings. That minimal variation will prevent statistical issues in the regression analysis, but will not affect the data in any material fashion. The benefit will be results far easier to understand and to interpret.
Step 4 Generates a Database of Data, Comprising these Specifics
a. Each row in the database corresponds to one vignette rate by a respondent. Therefore, by design each respondent generates 60 rows of data.
b. The first few set of columns provides the name of the product being studied, the unique identification number of the respondent, and the order of evaluation (from 1 to 60)
c. The second set of columns, totaling 36, corresponds to the 36 elements. Each of the 36 elements is associated with a column. When the element is present in the vignette, the cell is given the value 1. When the element is absent from the vignette, the cell is given the value 0.
d. The third set of two columns corresponds to the rating assigned by the respondent, and the transformed rating. As noted above, ratings of 1-6 are transformed to 0, ratings of 7-9 are transformed to 100, and a vanishingly small random number is added to the transformed number.
e. The remaining columns are given over to a set of self-profiling classification questions, comprising questions about WHO the respondent is, how the respondent FEELS about shopping, and so forth, what are the CRITICAL ASPECTS of the product, etc.
f. The OLS (ordinary regression analysis) is conducted at the level of the individual respondent. At the start, the data base comprised 3967 respondents. The database was reduced to 3656 individual respondents who showed some variation across the 60 vignettes, with at least three vignettes assigned 100 when the rest were assigned 0, or vice versa. The equation for each respondent is: TOP3 = k0 + k1(A1) + k2(A2) … k36(D9). The OLS equation can be done in a straightforward fashion because the set of 36 vignettes were created for each respondent according to the basic experimental design (4×9), which was then permuted to change the specific combinations.
g. The final database for subsequent analyses comprised the set-up information (respondent identification number, product covered by the study, a column for the additive constant and 36 columns for the elements, followed by the columns of classification information, based upon the answers provided by the respondents in the self-profiling classification questionnaire. The respondent completed that questionnaire after finishing the evaluation of the 60 vignettes. The self-profiling classification questionnaire was identical across all 30 products, and all 3656 respondents.
Step 5: Focus on the Two Silos, Question B (price), and Question C (emotion), as well the Self-profiling Classification
The analysis focuses only on the elements which are applicable to the shopping experience recognizing that some of the elements were slightly modified to make ‘sense’ in the context of a vignette. The relevant results appear in Table 2 (nine elements focusing on price), and Table 3 (nine elements focusing on emotions).
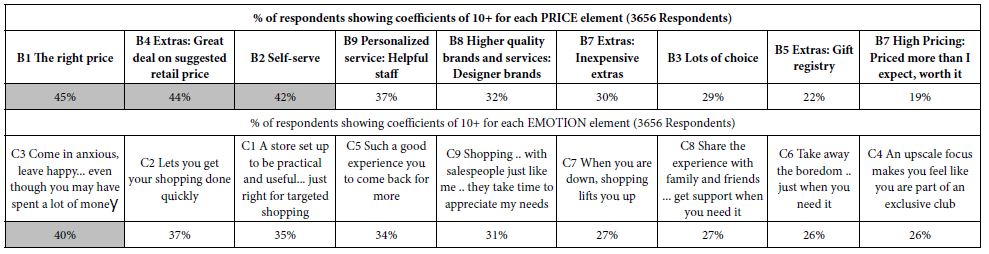
Table 3: Performance of the nine elements for Price (Top) and Emotion (Bottom).
A Mind Genomics cartography produces an extraordinary, occasionally overwhelming amount of data. Fortunately, there are no hypotheses to be discussed, nor detailed implications based on the limited set of data. Rather, with 30 studies, we are looking for emergent, easy-to-visualize results, and in the words of the market researcher of today as of this writing (winter 2022), ‘data which tell a story.’
Step 6: Look for Patterns
Our basic data are the coefficients in aforementioned regression analysis, done for each respondent separately. We are not going to focus on the additive constant, but rather focus only the magnitude of the 36 elements. These 36 coefficients tell us the degree to which the individual element drives the response to the similarity of the description to one’s the ideal shopping experience (rating 7-9). Thus, one can assume that each of the 36 regression coefficients shows the degree to which the specific element ‘drives’ the response toward describing the ideal shopping experience, presumably for that product.
The regression analysis is done on a respondent by respondent basis. Our first step in the search for patterns is to replace all coefficients less than+ 10 by a blank in the database. The coefficient +10 corresponds to a statistically significant coefficient in the OLS regression. From other studies, coefficients around +10 or higher suggest that the element is an important element.
Having now eliminated all coefficients lower than +10, we replace the remaining coefficients with the number ‘1’, simply to denote that for the element and for the respondent, the element is statistically significant. Now it is time to prepare the data in a way that will make it easy to discern patterns. We work according to the groups, the groups being defined by the total panel, by self-stated demographics, beliefs, and behaviors, as well as by the study. The strategy is to count the number of individuals who generate a coefficient of +10 or higher for a specific element, and then divide that number of individuals by the total number of individuals in the group.
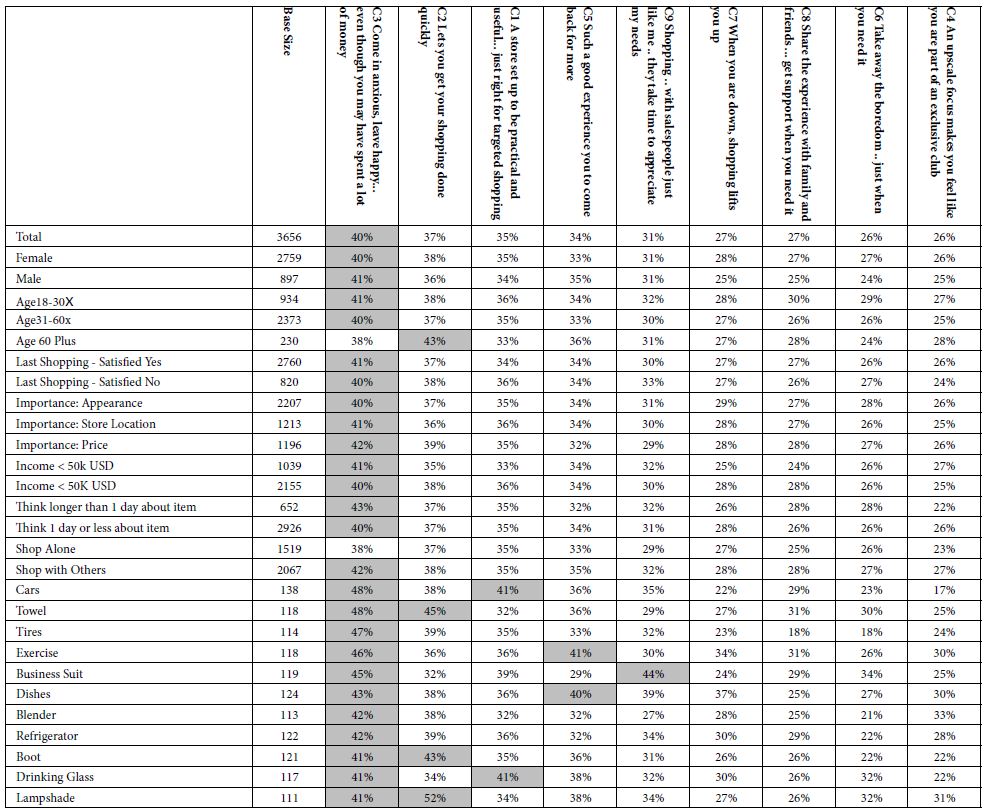
Table 3 shows two sets of data, for the total panel, the top set corresponding to the percent of times across the total panel of 3656 that the element generated a coefficient of +10 or higher for the pricing elements (Elements B1-B9, in ranked order by total). The bottom set, in contrast shows the percent of times that the element generated a coefficient of +10 or higher for the emotion elements C1-C9, in ranked order by total). To review before the details, the percentages in Table 3 are obtained by dividing the number of coefficients of +10 or higher by 3656, corresponding the number of respondents in the group labelled ‘Total’. To help the pattern emerge more clearly, we have shaded all percentages of 40% or higher. This strategy allows the pattern to jump out at us.
Price: Three key elements drive strong positive reactions
B1 the right place
B4 Extras: Great deal on suggested retail price
B2 Self-serve
Emotion: Only one key element drives strong positive reactions
C3 Come in anxious, leave happy… even though you may have spent a lot of money.
The paucity of strong performing elements may mean either that these elements are not critical, especially ‘emotion’ elements, or that the differences among the groups are more likely to emerge from the individual groups.
Step 7 – The Surprising Similarity of Self-defined Subgroups
One of the continuing findings in Mind Genomics is the similarity of patterns of response across subgroups, these subgroups being defined by the respondent. The subgroups may comprise individuals who are of the same gender, age, education, income. The subgroups may comprise individuals who describe their behaviors in the same way, e.g., the number of people with whom they shop. Or the subgroups may comprise individuals holding different values, such as what is important to them.
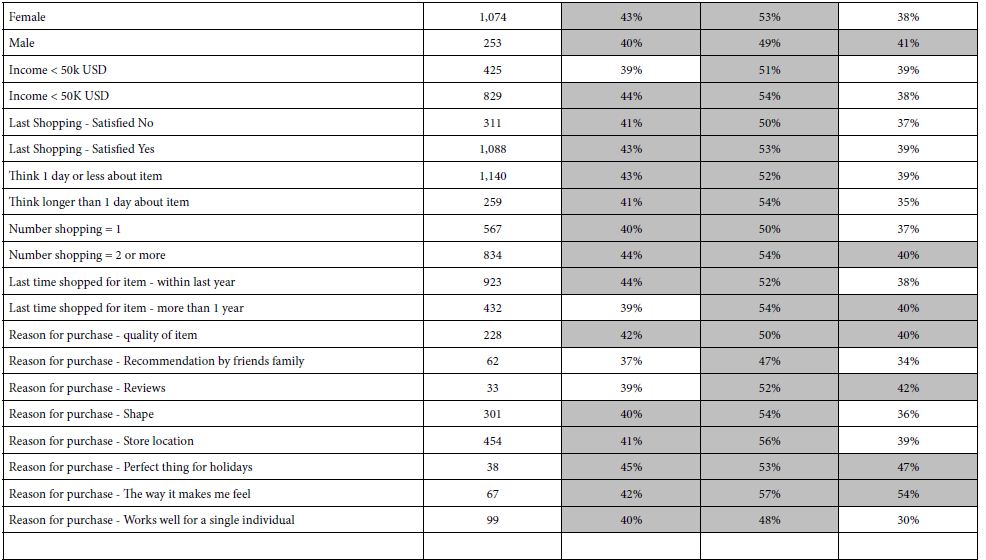
In the Buy It! study with the 30 products the respondent completed an extensive self-profiling classification questionnaire, covering geo-demographics, beliefs, and behaviors. Sometimes this is called an A&U study (short for attitude and usage), or a habits and practices study. Do these groups differ in the patterns of elements that they find important? Once again our focus is on the percent of respondents in a group who find the element to be important, viz., the coefficient for the element is +10 or higher for the individual respondent.
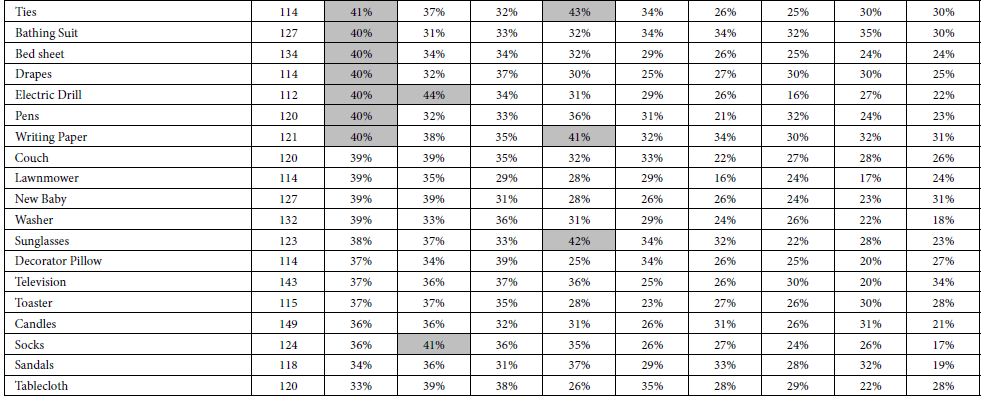
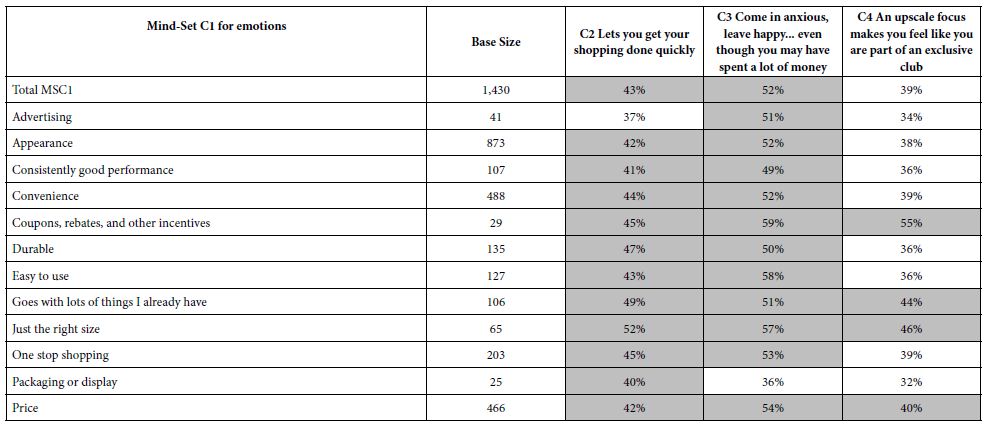
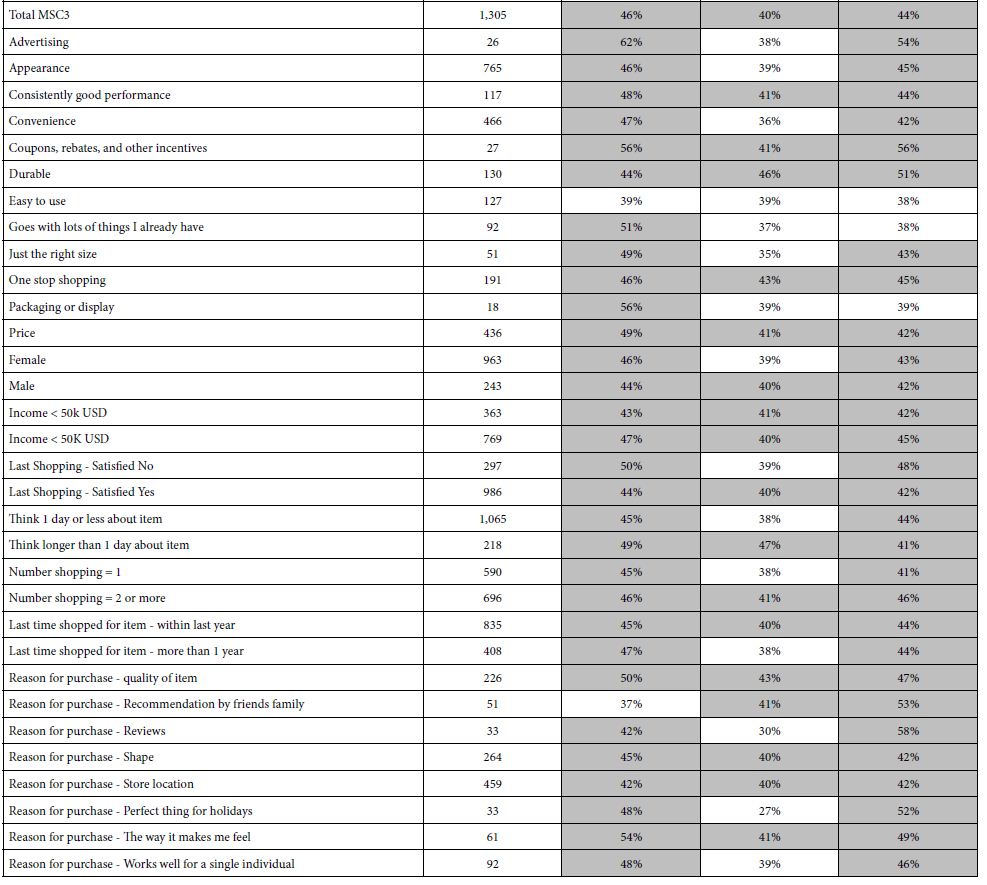
Table 4 presents the percent of respondents showing strong coefficients (+10 or higher) for each of the nine price elements, for each defined group, based upon the self-profiling classification. Table 4 is the first of the two tables showing the relation of self-defined groups to responses emerging out of the Mind Genomics experiment Table 4 need not be dissected any further than a quick note to observe that for the most part, three of the nine elements account for a vast majority of the strong performing elements.
Table 4: Percent of respondents in self defined groups who generate strong coefficients for each of the nine PRICE elements (B1-B9). The nine elements are sorted by the percentage shown for the total panel.
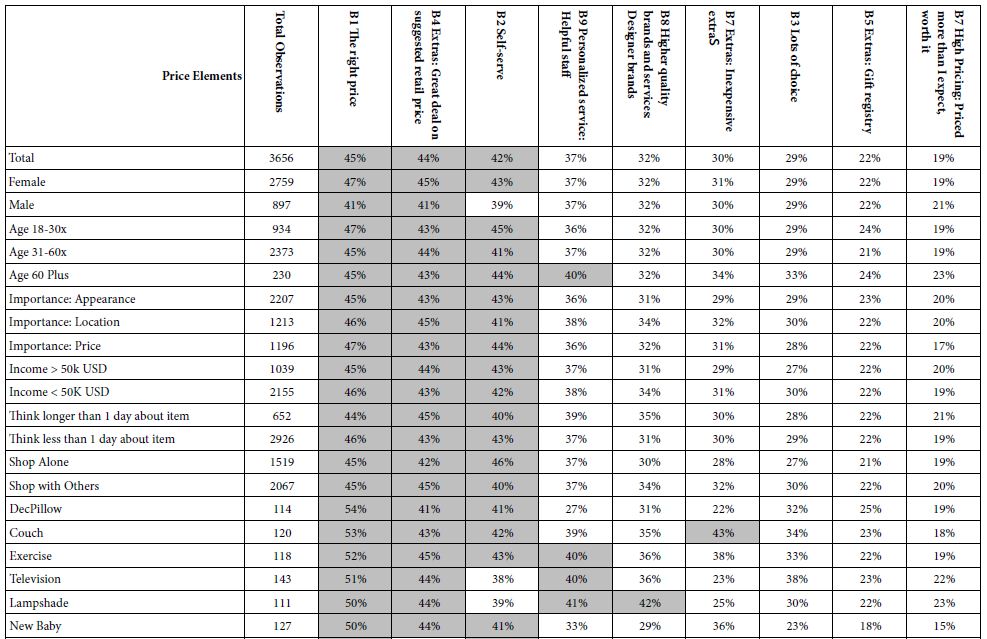
B1 The right price
B4 Extras: Great deal on suggested retail price
B2 Self-serve
There are some outliers, such as element B7 Extras: Inexpensive extras, for the couch. refrigerator, and washer, respectively.
Table 5 presents the same analysis, this time for the nine elements (C1-C9) talking about emotions experienced during shopping. Only one element show strength:
C3 Come in anxious, leave happy… even though you may have spent a lot of money
Table 5: Percent of respondents in self defined groups who generate strong coefficients for each of the nine EMOTION elements (C1-C9). The nine elements are sorted by the percentage shown by the total panel.
Step 8 – Uncover Mind-sets for Price and for Emotion, respectively
Previous analyses of Mind Genomics data focused on the entire set of elements tested, rather than focusing on the elements of one silo. The regression analysis would be done on all of the elements, and the reporting would be done on the analysis emerging from all of the coefficients.
The It! studies make such a grand approach difficult. The elements for Questions A and D have been so ‘particularized’ for the product being studied that it makes little sense to work with the coefficients AFTER the regression analysis has been done on all 36 elements. That is, it makes statistical sense to incorporate A1-A9 and D1-D9 into the analyses, estimate their values, as well as estimating the values of B1-B9, and C1-C9, respectively. Afterwards, however, when A1-A9 and D1-D9 have served their purpose in the estimation of values of the 36 coefficients and the additive constant, it makes sense to discard them.
The focus for last new analysis is on two separate sets of data, coefficients B1-B9 on price, and then coefficients C1-C0 on emotion. This last analysis will work with the two data sets separately, for all respondents, and for each data set generate three new mind-sets, using k-means clustering [21-23].
Clustering in Mind Genomics is a way to divide the respondents into groups based upon the pattern of numbers generated by each respondent, using as a basic a metric of ‘distance’ between pairs of respondents based upon these numbers. For this study, and for each clustering exercise (price, emotion, respectively), the distance between all pairs of the 3656 people was computed based upon the Pearson Correlation. Each respondent generated nine coefficients, say for Price. The ‘distance’ between every pair of respondents was operationally defined as (1-Pearson correlated, based on the 9 pairs of coefficients). The distance measure used a well know statistic, the Pearson correlation or Pearson R. When two patterns are identical, the Pearson R is +1. The distance should be zero, because they show the same pattern. (1-1 = 0). When the patterns are exactly opposite the Pearson correlation, Pearson R, becomes -1, and the distance becomes (1 – – 1), or 2 based on the magnitudes of the nine corresponding coefficients. The measure of distance is defined as D = 1 – Pearson Correlation. The Pearson Correlation, R, takes on the value +1 when two sets of items are perfectly related to each other. When R is 1, the distance is 1-R, 1-1, or 0. The Pearson Correlation r takes on the value blue -1 when wo sets of items are perfectly inversely related. The distance is now 1- -1 or 0.
The story for pricing, Question B, is quite different when we move from the total panel to the three mind-sets. (Note that the number of mind-sets is left to the discretion of the researcher). We choose three mind-sets as a number which often proves to the few numbers of mind-sets to reveal interest and interpretable patterns (Table 6).
Table 6: The performance of elements emerging three mind-sets based upon price (Question B, Silo B).
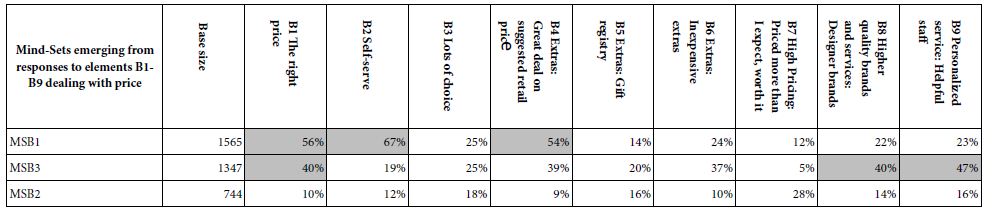
Mind-Set MSB1 – Fast, easy buying, no price concerns
B2: Self Service; B1: The right price; B4: Extras: Great deal on suggested retail price.
Mind-Set MSB3 – Wants to be pampered, presented with good products, and will pay for it;
B9: Personalized service: Helpful staff; B8: Higher quality brands and services: Designed brands; B1 The right price.
Mind-Set MSB2 – Nothing stands out, almost indifferent to everything.
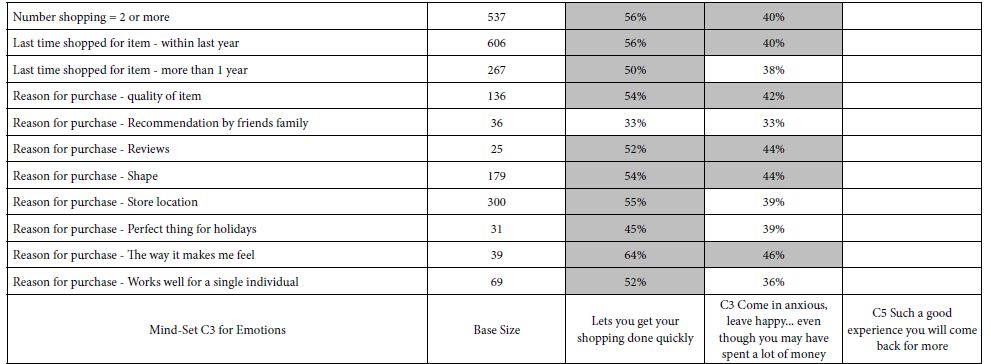
The story for emotion, Question C (Silo C), is also quite different when we move the total panel to the three mind-sets. We see differences among the three mind-sets based elements C1-C9 (Table 7).
Table 7: The performance of elements emerging from three mind-sets based upon emotion (Question C, Silo C).
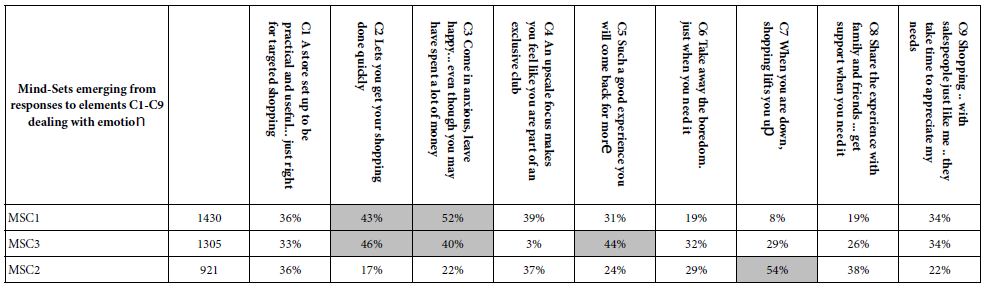
Mind-Set MSC1: Simply interested in hassle-free shopping
C2 Lets you get your shopping done quickly
C3 Come in anxious, leave happy… even though you may have spent a lot of money
Mind-Set MSC3: Hassle-free (like MSC1) but also a bit of a seduction for repeat shopping
C2 Lets you get your shopping done quickly
C3 Come in anxious, leave happy… even though you may have spent a lot of money
C5 Such a good experience you will come back for more
Mind-Set MSC3: Shopping is therapy
C7 When you are down, shopping lifts you up
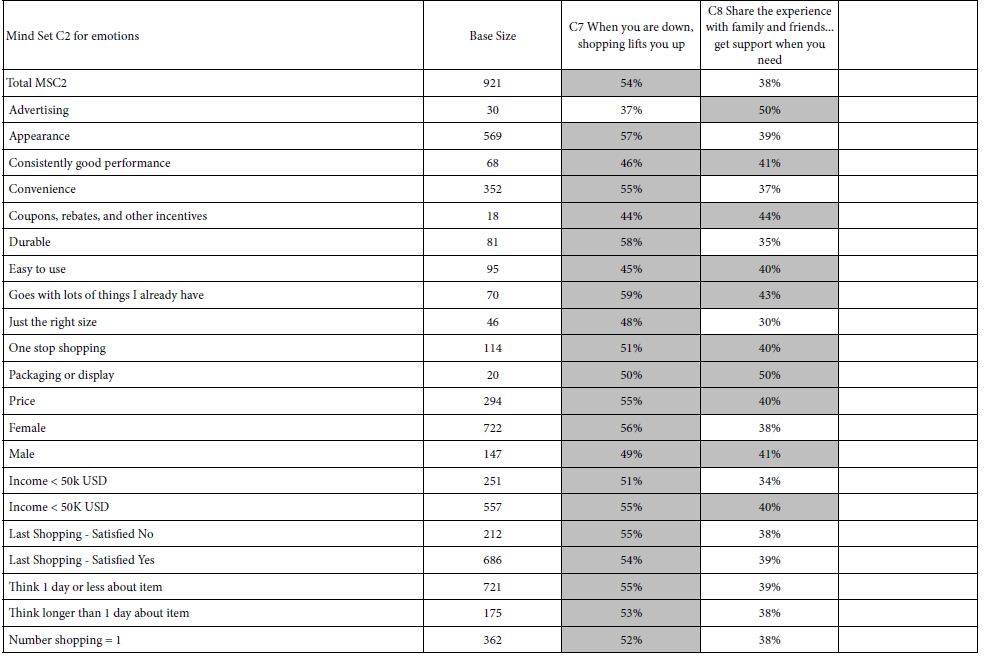
Table 8 presents the performance of these strong performing elements in mind-set by key subgroup. What becomes quite striking in Table 8 is the strength of these emergent mind-sets to perform well across all the smaller subgroups into which respondents fall, based upon their own self-profiling. That is, the emergent mind-sets based upon the pattern of the individual coefficients suggest the reality and strength of these mind-sets. Table 8 suggests that these elements perform well across all the groups. What is not show is the poor performance of these elements in the mind-sets in which the element does not resonate.
Table 8: Strong The performance of key elements in each mind-set (columns) across the different self-defined groups of respondents (rows).
Discussion and Conclusions
The topic of shopping occupies a great deal of attention because of its importance in economies powered by consumer demand. The focus of the effort is on nature of the shopping venue, the way the products are presented, priced, and the nature of the sales effort. This is the world of ‘retail,’ with increasing of the focus which pleases the customer and increases sales. It should come as no surprise that there is a plethora of information on the nature of the sales process for people, this information making interesting reading in the popular press, as well as the to-be-expected abundance of individuals and organizations ready to teach, coach, team-build, all for a fee, of course.
What is lacking, however, is a sense of the inside out, viz., what do shoppers feel to be important, not in the rarified language of science and research, but in the language of feeling. When we talk about the sales situation, what is deemed to be important by respondents? As noted in the introduction, the typical research study focuses on the outside, for example the importance of something general. The description is sterile, the response is considered, the analysis is statistical, and the results are tabulations. The Mind Genomics approach works within these somewhat sterile confines. What is new, however, is the use of evocative phrases, and the effort to get people to match numbers to descriptions in an effort to ‘flesh out’ the inner experience.
The Mind Genomics efforts are labelled cartographies because they ‘map’ a domain, that domain being the mind of the person. In this case, the results of the analysis were remarkable, not so much in the richness of the shopping experience, but just the opposite. For the total panel, the shopping experience appears to be functional, and not emotional, more elements performing well in Question B on price, fewer on Question C on emotion. The results become far richer, however, when we move from the total data across the four questions or silos to each silo, specifically silo B on price, and silo C on emotions. We generate the entire model across 36 elements for each respondent, but then divide the data into the two ‘soft’ sections, statements about price and statements about emotion, respectively. It is then, in this ‘posterior, micro-analysis’ of the silos and the elements where the rich substructure of the mind of the shopper can begin to emerge.
Acknowledgements
The authors wish the acknowledge the support of the University of Indiana which funded the study in 2002, and acknowledge the guidance and friendship of Professor Thomas Hustad.
The creation of the study was directed by Jacquelyn Beckley and by the late Hollis Ashman, then of the Understanding and Insight Group, Inc., of New Jersey
Attila Gere gratefully acknowledges the support of Premium Postdoctoral Research Program of the Hungarian Academy of Sciences.
References
- Valence G, d’Astous A, Fortier L (1988) Compulsive buying: Concept and measurement. Journal of Consumer Policy 11: 419-433.
- Bargh JA (2002) Losing consciousness: Automatic influences on consumer judgment, behavior, and motivation. Journal of Consumer Research 29: 280-285.
- Ackerman D, Tellis G (2001) Can culture affect prices? A cross-cultural study of shopping and retail prices. Journal of retailing 77: 57-82.
- Lichtenstein DR, Ridgway NM, Netemeyer RG (1993) Price perceptions and consumer shopping behavior: a field study. Journal of Marketing Research 30: 234-245.
- Stassen RE, Mittelstaedt JD, Mittelstaedt RA (1999) Assortment overlap: its effect on shopping patterns in a retail market when the distributions of prices and goods are known. Journal of Retailing 75: 371-386.
- Tang CS, Bell DR, Ho TH (2001) Store choice and shopping behavior: how price format works. California Management Review 43: 56-74.
- Darden WR, Dorsch MJ (1990) An action strategy approach to examining shopping behavior. Journal of Business Research 21: 289-308.
- Goldsmith RE, Flynn LR, Clark RA (2011) Materialism and brand engagement as shopping motivations. Journal of Retailing and Consumer Services 18: 278-284.
- Miller D (1998) A Theory of Shopping. Cornell University Press.
- Suher J, Sorensen H (2010) The power of atlas: Why in-store shopping behavior matters. Journal of Advertising Research 50: 21-29.
- Turley LW, Milliman RE (2000) Atmospheric effects on shopping behavior: a review of the experimental evidence. Journal of Business Research 49: 193-211.
- Silveira PD, Marreiros C (2014) Shopper marketing: A literature review. International Review of Management and Marketing 4: 90-97.
- Burke RR (1997) Do you see what I see? The future of virtual shopping. Journal of the Academy of Marketing Science 25: 352-360.
- Pfeiffer J, Pfeiffer T, Meißner M, Weiß E (2020) Eye-tracking-based classification of information search behavior using machine learning: evidence from experiments in physical shops and virtual reality shopping environments. Information Systems Research 31: 675-691.
- Pizzi G, Scarpi D, Pichierri M, Vannucci V (2019) Virtual reality, real reactions?: Comparing consumers’ perceptions and shopping orientation across physical and virtual-reality retail stores. Computers in Human Behavior 96: 1-12.
- Moskowitz HR, Gofman A (2007) Selling Blue Elephants: How to Make Great Products that People Want Before They Even Know They Want Them: Pearson Education.
- Oppewal H, Timmermans HJ, Louviere JJ (1997) Modelling the effects of shopping centre size and store variety on consumer choice behaviour. Environment and Planning A 29: 1073-1090.
- Moskowitz HR, Silcher M (2006) The applications of conjoint analysis and their possible uses in Sensometrics. Food Quality and Preference 17: 145-165.
- Cohen RL, Granström K (1970) Reproduction and recognition in short-term visual memory. Quarterly Journal of Experimental Psychology 22: 450-457.
- Moskowitz HR, Gofman A, Lieberman LE, Ray I, Onufrey SR (2011) Sequencing the genome of the customer mind by RDE and intervention testing. Journal of Academic and Business Ethics 3: 1.
- Likas A, Vlassis N, Verbeek JJ (2003) The global k-means clustering algorithm. Pattern Recognition 36: 451-461.
- Gofman A, Moskowitz H (2010) Isomorphic permuted experimental designs and their application in conjoint analysis. Journal of Sensory Studies 25: 127-145.
- Moskowitz MR, Ashman H, Minkus-McKenna D, Rabino S, Beckley JH (2006) Databasing the shopper’s mind: approaches to a ‘mind genomics’. Journal of Database Marketing & Customer Strategy Management 13: 144-155.