DOI: 10.31038/OHT.2020112
Abstract
Objective: To identify factors influencing the onset and the development of tinnitus among adolescents.
Patients and methods: 1260 high school students in Gothenburg participated in a health screening program during their first and third year of high school (age 16 and 19). Measurements included screening audiometry (thresholds were measured if the students failed the 20 dB HL) and patient reported outcomes, covering; noise exposure, use of cell phones, psychological well-being and students’ experiences of spontaneous tinnitus (ST), noise induced tinnitus (NIT) and temporary thresholds shift (TTS). Half of the group participated in occupational education programs (n=662), which was considered by the school health authorities as a noisy environment, and the other half in quiet, mostly theoretical programs (n=598).
Results: Over the three years in school, the students did not develop more hearing loss, tinnitus or TTS, than their initial level. Hearing loss did not correlate to ST, NIT or TTS. Frequent use of cell phones was highly correlated to NIT and TTS. The most important noise exposure factors were playing an instrument or attending concerts. An interesting observation was the influence of anxiety in all reported symptoms, i.e. ST, NIT and TTS.
Conclusion: This study points to the multifaceted nature of tinnitus, where noise exposure and anxiety are two strong influencing factors. However, hearing loss as measured by screening audiometry, did not correlate to the presence of tinnitus. The students listening habits, such as playing instruments and listening to music, live or recorded, correlated significantly to ST, NIT and TTS in this population. In our study, the single most influential factor for any form of subjective hearing symptoms is anxiety, which has also previously been reported for adults.
Key words
Adolescent, Anxiety, Child, Hearing loss, Noise, Stress, Tinnitus
Key messages
Live music is more highly linked to the emergence of tinnitus than listening to portable music players. When adolescents seek help for tinnitus of any kind, look for signs of untreated anxiety disorder.
Introduction
Noise can lead to hearing loss but also to stress reactions and stress related diseases [1–4]. Tinnitus is often one of the results of noise, where both hearing loss and stress reactions contribute to the symptom. Children’s auditory systems differ from adults in anatomy of the outer ear, sound transfer function [5] and central processing [6]. As concluded in an earlier review [7], longitudinal studies that focus on factors contributing to hearing loss in children are few/sparse. So far there is no direct evidence linking high frequency hearing loss and noise in children, as there is for adults, yet clear correlations with hereditary factors exist. Noise exposure in children’s leisure time is not regulated per se as it is in the work place, and schools in Sweden are not entitled to the same monitoring as the adult work places are Young people and children seeking medical help for tinnitus, report more often that tinnitus started after noise exposure, be it school hours or leisure [7]. Although there are reports on high noise levels in the elementary schools or pre-schools [8–10], it is the adult that complains of noise-induced tinnitus and the child or toddler is given less consideration. When asked, children report experience of tinnitus in between 30% and 53% [11–14]. Experience of temporary threshold shift (TTS) in the young population has not been the focus of many studies, yet those that do examine TTS [15, 16], report frequencies of 35% recurrence in teenagers. This recurrence seems to increase with experience of noise induced tinnitus (NIT), hearing loss, tobacco use and heredity of hearing loss [1]. Prolonged noise exposure has been shown to damage hearing [17], lower cognitive performance [18, 19] and evoke tinnitus [2, 20–22]. Noise induced tinnitus can signal minor cochlear lesions as well as a dysfunction of the efferent system [23, 24] and can also be linked to a vulnerable psychological type [25]. Similar to spontaneous tinnitus (ST), a connection to psychiatric disorders has been established [26–28] and a serotonergic vulnerability suggested [29]. The presence of serotonin in the auditory system has been well documented [30] and there are discussions on the functional link between tinnitus and depression [26, 27, 30, 31]. Despite this, we still do not know whether children and adolescents are more sensitive to noise and/or more prone to developing any kind of tinnitus, even though there are observations suggesting that the young auditory pathway does not function in the same way as the adult [6]. The ability to understand speech in a noisy environment develops over time and young children suffer the consequences of ambient noise the most [32]. The assumption that music is less hazardous than occupational noise is generally based on studies which have investigated the hearing in professional musicians and one experimental study on 10 volunteers [33–35]. However, the listening patterns and the voluntary exposure to live or recorded music may differ in adults versus the younger population [36, 37] and, as for occupational noise, in the young population it consists mainly of the school environment. It is difficult to compare epidemiological studies on tinnitus in children, as well as in adults, as the definitions of the symptom vary. Prevalence studies of tinnitus in children and adolescents also differ (with regards to hearing status of the study population) depending on whether it is an unselected or selected population. There are numerous studies on young adults, starting from 18 years of age, but not that many select a strictly paediatric population. A brief summary of tinnitus prevalence in children, recorded in studies dating back from 1972, is listed in Table 1. A more comprehensive review has been done by Rosing et al [38], but still battling with the same issues of lack of definitions of the studied symptoms and heterogeneous study populations.
Table 1. Prevalence of tinnitus in children reported in 1972–2016
|
Authors (year of publication) |
n |
Age range |
Prevalence of tinnitus (any kind) % within group |
||
|
|
|
|
Normal hearing |
Any HI |
Hearing tests not performed |
|
Nodar (1972) |
2000 |
10–18 |
13 |
|
|
|
Graham (1979) |
92 |
12–18 |
|
66 |
|
|
Graham (1981) |
66 |
12–18 |
|
29 |
|
|
Mills and Cherry (1984) |
110 |
4–17 |
44 |
30 |
|
|
Nodar (1984) |
56 |
? |
|
55 |
|
|
Mills et al (1986) |
93 |
? |
29 |
|
|
|
Viani (1989) |
102 |
6–17 |
|
23 |
|
|
Martin and Snashall (1994) |
67 |
2–16 |
50 |
50 |
|
|
Aust (2002) |
1420 |
5–17 |
|
|
7 |
|
Holgers (2003) |
964 |
7 |
13 |
9 |
|
|
Holgers and Pettersson (2005) |
671 |
13–16 |
|
|
53 |
|
Holgers and Juul (2006) |
274 |
9–16 |
|
|
46 |
|
Aksoy et al (2007) |
1020 |
6–16 |
15 |
|
|
|
Savastano (2007) |
1100 |
6–16 |
26 |
8 |
|
|
Coelho et al (2007) |
506 |
5–12 |
38 |
45 |
|
|
Raj-Koziak et al (2011) |
60212 |
7 |
32 |
43 |
|
|
Figueiredo et al (2011) |
100 |
15–30 |
18 |
|
|
|
Juul et al (2011) |
756 |
7 |
41 |
58 |
|
|
Giles et al (2012) |
145 |
19–26 |
|
|
15 |
|
Bartnik et al (2012) |
59 |
7–17 |
44 |
56 |
|
|
Mahboubi et al (2013) |
3520 |
12–19 |
7.5 |
10 |
|
|
Park et al (2014) |
3047 |
12–19 |
18 |
18 |
|
|
Humphriss et al (2016) |
7092 |
11 |
28 |
|
|
Table 1. Prevalence or occurrence of tinnitus in children, with the original numbers extracted and re-calculated as to allow the easiest inter-study comparison.
There are distinctions between objective and subjective tinnitus, distinctions based on aetiology, impact or triggers. In this study, the definition of tinnitus in terms of subjective tinnitus will be that of an aberrant perception of sound unrelated to an acoustic source of stimulation, internal or external. Spontaneous tinnitus will be defined as subjective tinnitus without any prior acoustic stimulation and noise induced tinnitus as tinnitus appearing in close time connection to prior noise exposure, subjectively defined.
Subjects and methods
Starting in the year 2004, 1260 high school students in Gothenburg were given the opportunity to participate in a health screening program during their first and their third/last year of high school (age 16 and 19). Written consent from both the students and their parents were obtained. Of these 1260 students, 155 declined to participate. The young students were enrolled in equal parts from noisy, occupational education programs (n=662) and not noisy, mostly theoretical programs (n=598). Hearing thresholds were obtained from 1105 students in the first year (611 in noisy programs and 494 in quiet programs) and 816 students were followed up in the third year (493 and 325, respectively). The exclusion criterion for follow-up in the third grade was discontinuation of their studies, since it proved to be difficult to follow the drop-out students.
Screening audiometry: The screening program was performed by a school nurse, trained in performing screening audiometry. The tests were performed in the school nurses offices, so as to mirror the standard school entry screening conditions. Standard pure tone audiometry in both ears, with ear phones over 0.5, 1, 2, 3, 4, 6 and 8 kHz was conducted out at 20 dB HL. Thresholds were measured if the student did not pass the screening level, i.e., they did not obtain the 20 dB HL on at least one frequency.
Questionnaire: The nurse collected anthropometric data and administered an extensive questionnaire battery regarding the students’ own perception of health and well-being (including 1. HADS – Hospital Anxiety and Depression Scale [39], 2. noise exposure during school and leisure time and 3. hearing problems such as spontaneous tinnitus, noise induced tinnitus or temporary threshold shift). The students also responded to questions regarding their listening habits, in terms of playing instruments, attending concerts, listening to music on stereos or portables devices, playing computer games, going to the cinema, target shooting, use of mobile phones (with or without hands-free earphones) and use of hearing protection devices. Excerpt from the questionnaire is presented at the end. The same questions covering the experience of ST, NIT and TTS have also been used in previous studies from our research group [1, 11] on a total of 1635 children and adolescents. The questions are not yet formally validated but have been constructed based on previously revised questionnaires. These in turn, have been assessed by the audiologist performing all school entry hearing screenings to be easily understood even by young children.
Statistics: The dependent variables were the three: Spontaneous Tinnitus (ST), Noise Induced Tinnitus (NIT) and Temporary Threshold Shift (TTS). The hearing data were analysed frequency by frequency in correlation analyses, as well as dichotomised in multiple stepwise logistic regression analyses to groups of Hearing loss “Yes”/”No” (meaning screening audiometry level 20 dB failed or passed). The independent variables were: Gender, Noisy Program, Hearing Loss, Anxiety, Depression and for the listening habits – Instruments, Concerts, All live music (created by pooling Instruments and Concerts), Computer, Disco, Mobile phone, Mobile phone with headphones and Recorded music. For statistical purposes, all questionnaire answers were dichotomised, where response options “Never” and “Once/Rarely” were treated as “No” and “Often/Sometimes” and “Very often” were treated as “Yes”. When analysing the HAD-scale, scores above the cut-off level of 7 were considered as positive for depression-related symptoms and above 9 for anxiety, in accordance with the recommendations for application in adolescents [40]. For each subject, the difference between the results of each variable in the first year (Year 1) and the third year (Year 3) was calculated. The created ∆-variables were used where applicable. All noise variables were tested for correlations using Spearman’s rho or univariate logistic regression. The analyses were conducted identically for all three dependent variables (ST, NT, TTS). The independent variables with significant outcome were put in a multiple stepwise logistic regression analysis. The probabilities attained in the final models were then applied in ROC-curves for calculation of model strength with Area under the Curve (AUC). Variables were tested for, and fulfilled the criteria for normal distribution. Grading of correlation strength was as follows: 0 < |r| < .3 weak correlation, 3 < |r| < .7 moderate correlation, |r| > 0.7 strong correlation. Data were analysed using SPSS 19.0 for Windows. This study was approved by the Ethical Committee in Gothenburg (125–04) and performed according to the Helsinki declaration.
Results
Descriptives:
More boys than girls joined occupational education programs and more boys with pre-existing hearing loss entered these programs rather than the quieter theoretical programs, see Table 2. The students did not differ in experience of NIT, ST or TTS in respect of the chosen program, but overall, girls were more likely to report any of these three symptoms.
Table 2. Noisy program vs. hearing and gender at the start of the program
|
Gender |
Hearing loss either side |
|
|||||
|
No |
Yes |
Total |
|
||||
|
Boy |
Noisy program |
No |
N |
202 |
39 |
241 |
|
|
% within hearing loss |
37,1% |
26,2% |
34,8% |
|
|||
|
Yes |
N |
342 |
110 |
452 |
p=0,015 |
||
|
% within hearing loss |
62,9% |
73,8% |
65,2% |
|
|||
|
Total |
N |
544 |
149 |
693 |
|
||
|
Girl |
Noisy program |
No |
N |
207 |
45 |
252 |
|
|
% within hearing loss |
60,7% |
64,3% |
61,3% |
|
|||
|
Yes |
N |
134 |
25 |
159 |
p=0,593 |
||
|
% within hearing loss |
39,3% |
35,7% |
38,7% |
|
|||
|
Total |
N |
341 |
70 |
411 |
|
||
|
Total |
Noisy program |
No |
N |
409 |
84 |
493 |
|
|
% within hearing loss |
46,2% |
38,4% |
44,7% |
|
|||
|
Yes |
N |
476 |
135 |
611 |
p=0,040 |
||
|
% within hearing loss |
53,8% |
61,6% |
55,3% |
|
|||
|
Total |
N |
885 |
219 |
1104 |
|
||
Table 2. Distribution of gender in the noisy and quiet programs. Correlations between noisy or quiet program and hearing loss either side (pass = No, fail = Yes); Chi2-test. Percentage numbers represent the proportion of students with normal hearing (first column) or hearing loss (second column) within the respective program.
In the third year, many students had dropped out from school, mostly within the theoretical programs, thus reducing the observed number from 1105 to 816. The follow-up screening audiometry did differ slightly in some students in isolated frequencies and created therefore odd effects of statistically significant difference at 500 Hz in the left ear alone, due to seven students in the quiet group reporting 5 dB better thresholds and 8 students in the noisy group reporting 5 dB worse thresholds. The same effect was present in the right ear at 3000 Hz with sixteen students in the noisy group reporting a 5 dB worse threshold. In the clinical setting we do not consider such minute changes in isolated frequencies as significant, why this mathematical result is considered to be representative of a mass effect of multiple comparisons. When calculating with the dichotomised variable Hearing loss, there were no significant differences between the sufferers
Correlations and regression analyses:
All the noise variables and HADS reports were tested for correlations using univariate logistic regression. The variables with significant outcome were used in multiple stepwise logistic regression analyses. The probabilities attained in final model were then applied in ROC-curves for calculation of model strength with Area under the Curve (AUC). The odds ratios for the variables in the final models are presented, with their confidence intervals, in Figures 1 and 2. Figure 1 presents the models for ST, NIT and TTS in Year 1 and Figure 2 for the ST, NIT and TTS in Year 3. For cinema, target shooting and use of noise protection, there were no significant correlations (data not shown) (Insert Fig 1, 2).
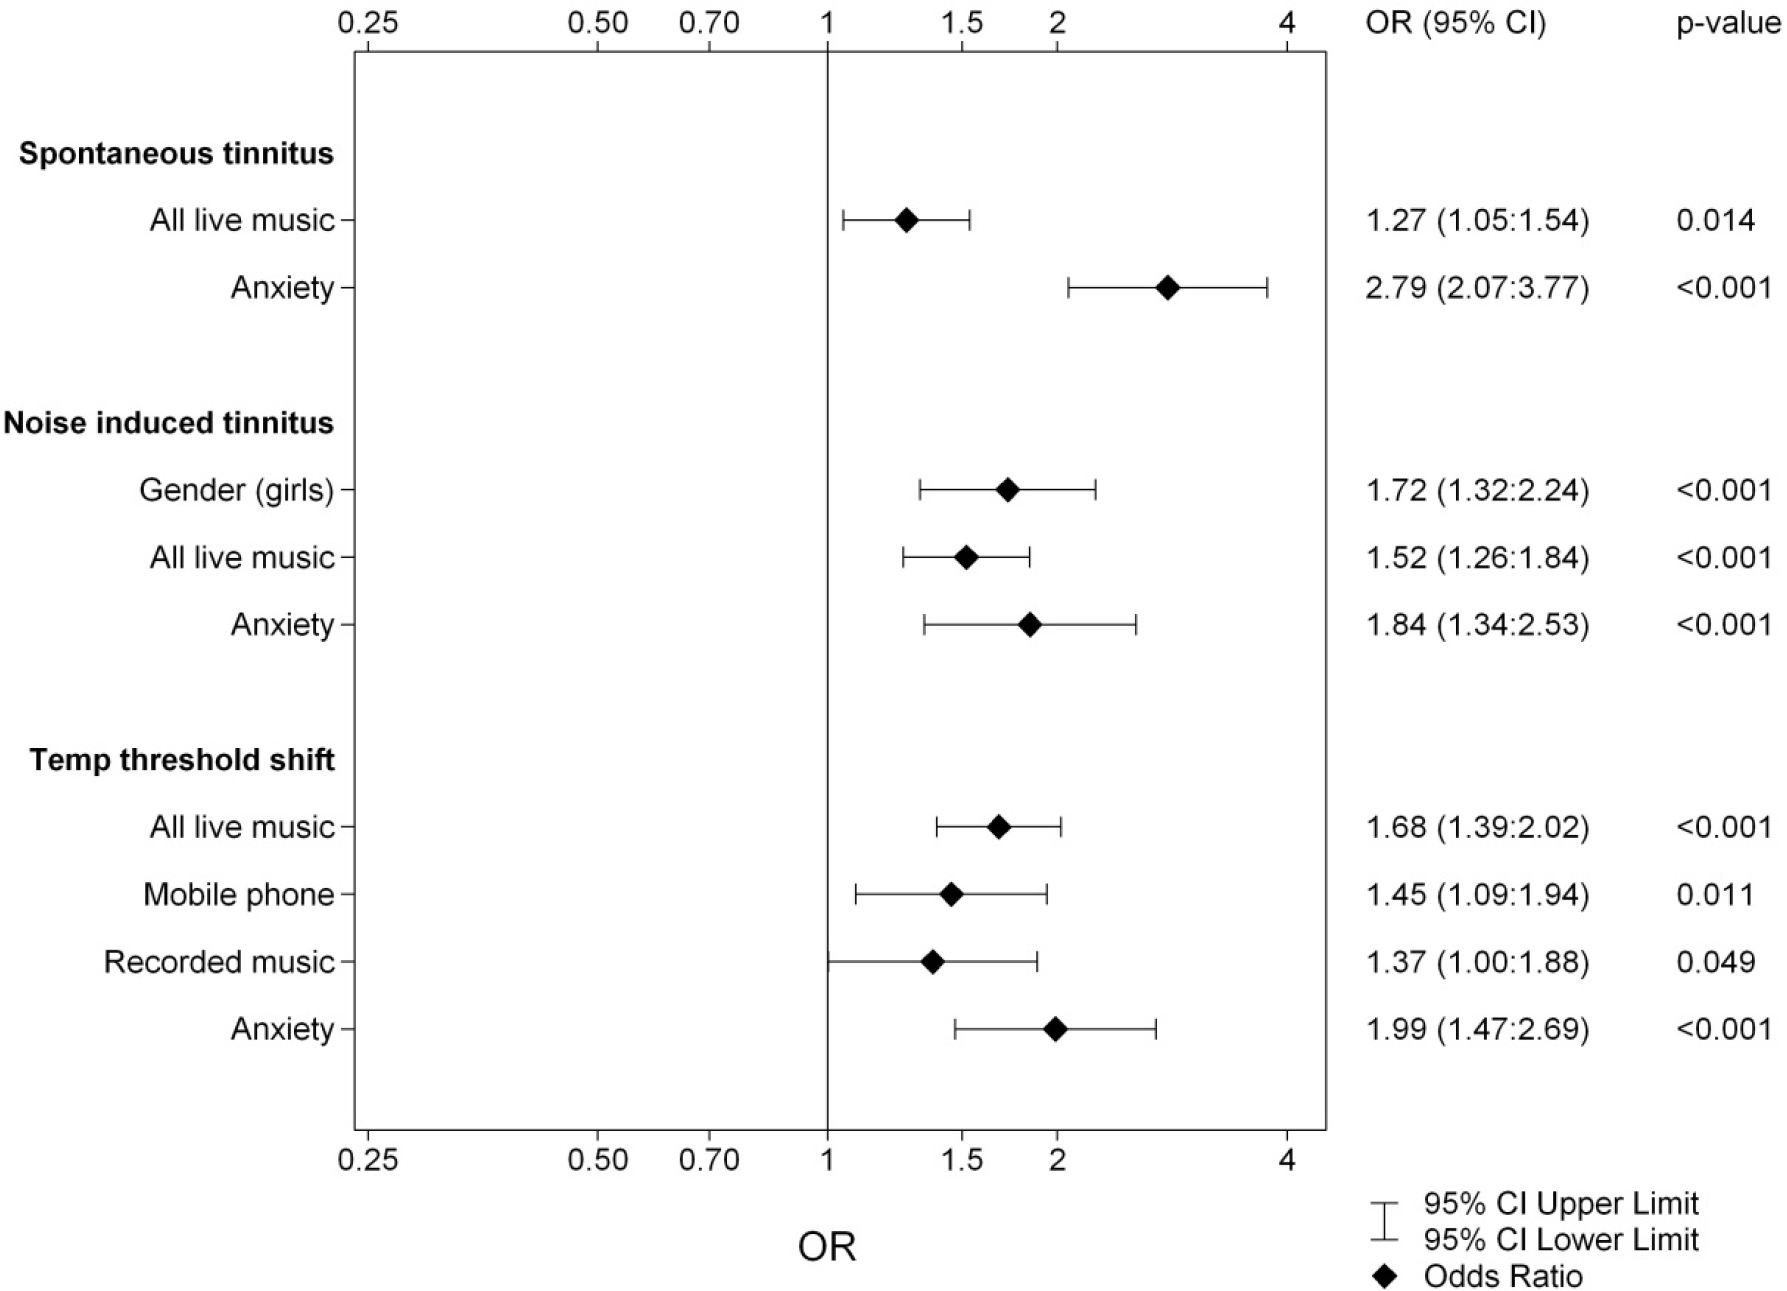
Figure 1. Logistic regression of the dependent variables ST, NIT and TTS for Year 1. The results from the three multivariate stepwise logistic regression analyses of the independent variables Gender, Hearing Loss, Noisy Program, Anxiety, Depression and listening habits (listed in Subjects and Methods).
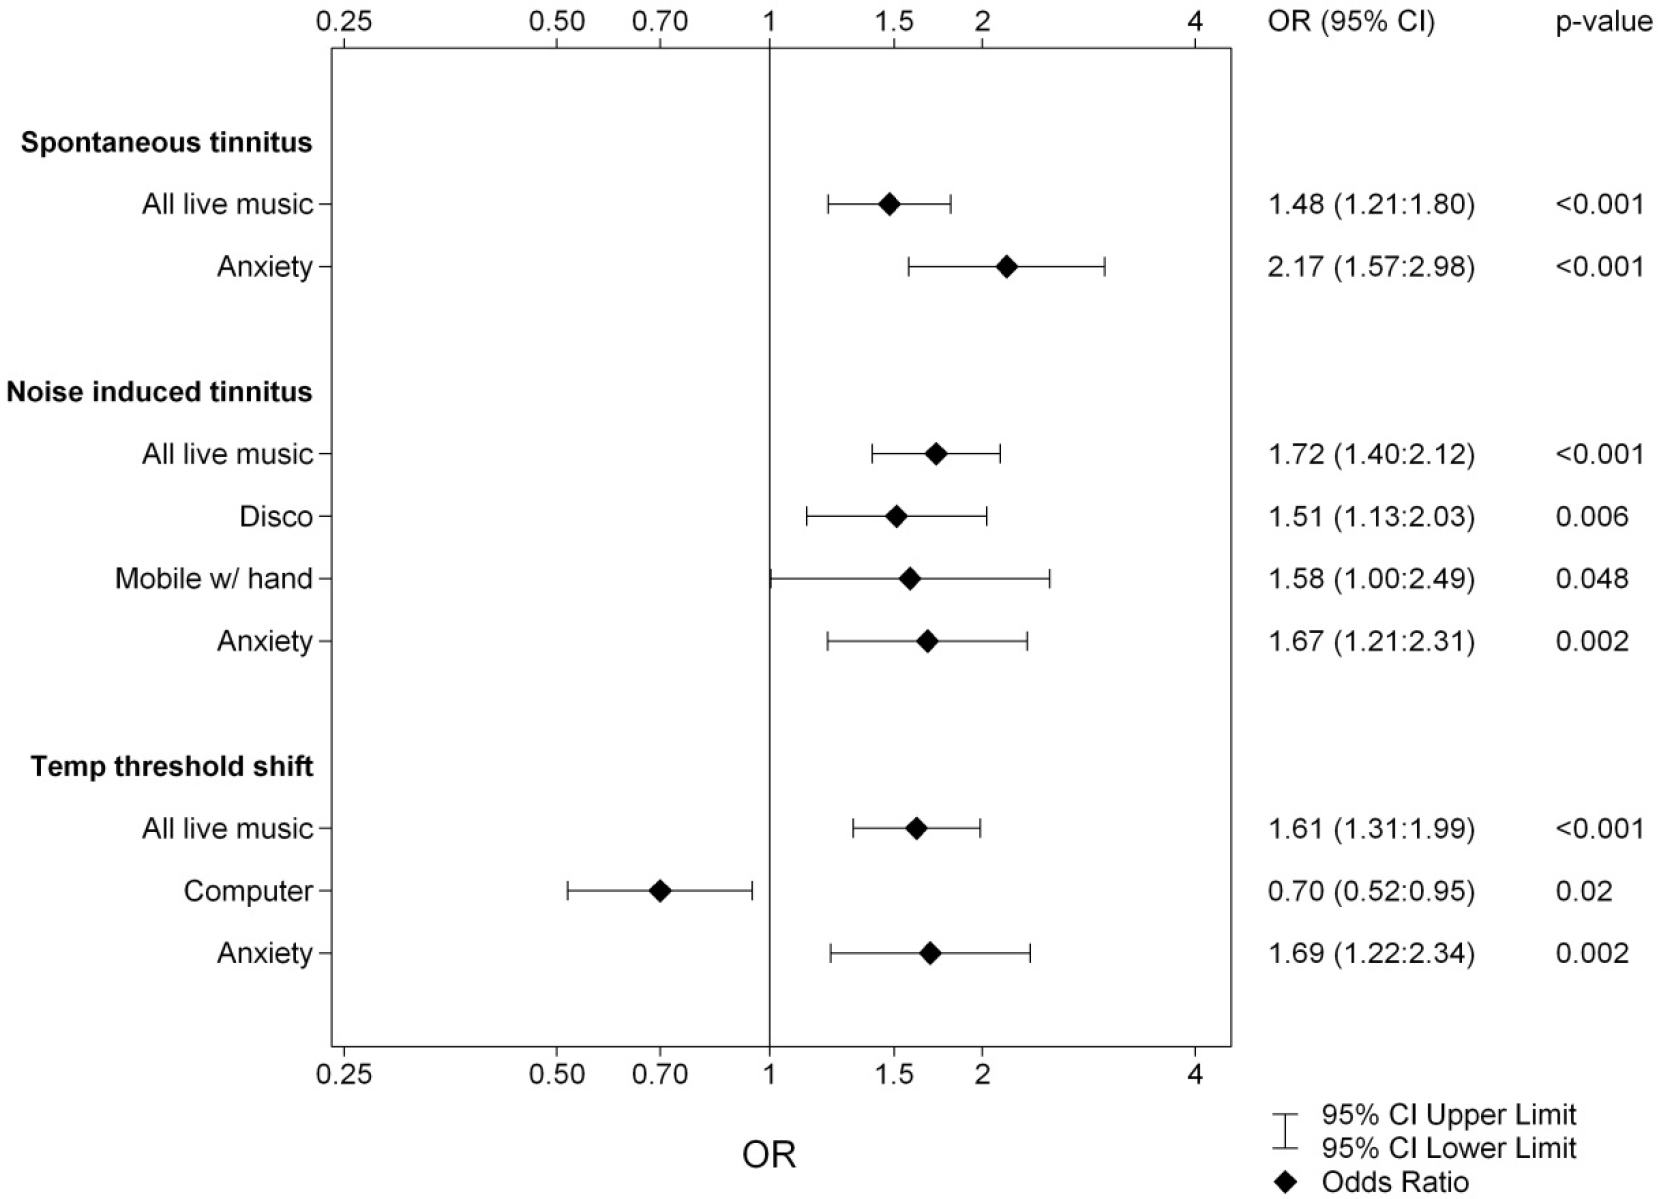
Figure 2. Logistic regression of the dependent variables ST, NIT and TTS for Year 3. The results from the three multivariate stepwise logistic regression analyses of the independent variables Gender, Hearing Loss, Noisy Program, Anxiety, Depression and listening habits (listed in Subjects and Methods).
Playing instruments and attending concerts were pooled in to one variable, called ‘All Live Music’, as to separate from ‘Recorded Music’, which here signifies portable music players, iPod, mp3 or stereo. As seen in clinical practice, the three hearing symptoms (ST, NIT and TTS) often coincide. In our results, ST shared weak to moderate correlations with NIT and TTS, whereas NIT and TTS shared correlations of moderate strength, all with p-values of <0,001, see Table 3.
Table 3. Correlations ST, NIT and TTS
|
Year 1 Spearman’s rho |
ST |
NIT |
TTS |
|
|
ST |
Correlation Coefficient |
1,000 |
0,287 |
0,167 |
|
Sig. (2-tailed) |
|
<,001 |
<,001 |
|
|
N |
1104 |
1102 |
1099 |
|
|
NIT |
Correlation Coefficient |
0,287 |
1,000 |
0,372 |
|
Sig. (2-tailed) |
<,001 |
|
<,001 |
|
|
N |
1102 |
1108 |
1103 |
|
|
TTS |
Correlation Coefficient |
0,167 |
0,372 |
1,000 |
|
Sig. (2-tailed) |
<,001 |
<,001 |
|
|
|
N |
1099 |
1103 |
1104 |
|
|
Year 3 Spearman’s rho |
ST |
NIT |
TTS |
|
|
ST |
Correlation Coefficient |
1,000 |
0,404 |
0,287 |
|
Sig. (2-tailed) |
|
<,001 |
<,001 |
|
|
N |
807 |
807 |
807 |
|
|
NIT |
Correlation Coefficient |
0,404 |
1,000 |
0,399 |
|
Sig. (2-tailed) |
<,001 |
|
<,001 |
|
|
N |
807 |
815 |
815 |
|
|
TTS |
Correlation Coefficient |
0,287 |
0,399 |
1,000 |
|
Sig. (2-tailed) |
<,001 |
<,001 |
|
|
|
N |
807 |
815 |
816 |
|
Table 3. Correlations between Spontaneous Tinnitus, Noise Induced Tinnitus and Temporary Threshold Shift; Spearman’s rho.
The relevant results and models for each symptom group follow below.
Spontaneous Tinnitus:
In Year 1, 33 % of the children (N=368 children, 37% of the girls and 31% of the boys) reported recurrent ST. Two years later the numbers had risen to 37% (39% of the girls, 36% of the boys). A pre-existing hearing loss at the first audiometry in Year 1 did not correlate to ST but heredity of hearing loss did correlate. History of prior ear infections or transmyringeal drainage (TMD) correlated with ST only, see Table 4.
Table 4. ST vs. Ear infections
|
|
|
|
Ear infections |
|
|
Total |
|
|
|
|
|
|
Never |
1-2 times |
Many times |
TMD in childhood |
|
|
|
ST |
No |
N |
378 |
228 |
62 |
55 |
723 |
|
|
|
|
Expected |
353,2 |
233,7 |
74,8 |
61,4 |
|
|
|
|
Yes |
N |
151 |
122 |
50 |
37 |
360 |
|
|
|
|
Expected |
175,8 |
116,3 |
37,2 |
30,6 |
|
p=0,001 |
Table 4. Spontaneous Tinnitus vs. ear infections and transmyringeal drainage, N observed and expected, Chi2-test.
Children affected with ST scored significantly higher on both the anxiety and depression parts of the HADS. Through multiple stepwise logistic regression analysis we obtained an overall model for the development of ST. The final variables for Year 1 and Year 3 are presented in Figures 1 and 2. For both years the model for ST contained All Live Music and Anxiety. In Year 1 the linear constant was ST: =-1.055 +0.238xAll Live Music +1.026xAnxiety with AUC = 0.614 and for Year 3 it was ST: =-0.972 + 0.391xAll Live Music +0.772xAnxiety with AUC = 0.625. Fitted probabilities with confidence intervals from these models are shown in Figure 3, diamonds showing Year 1 and circles Year 3.
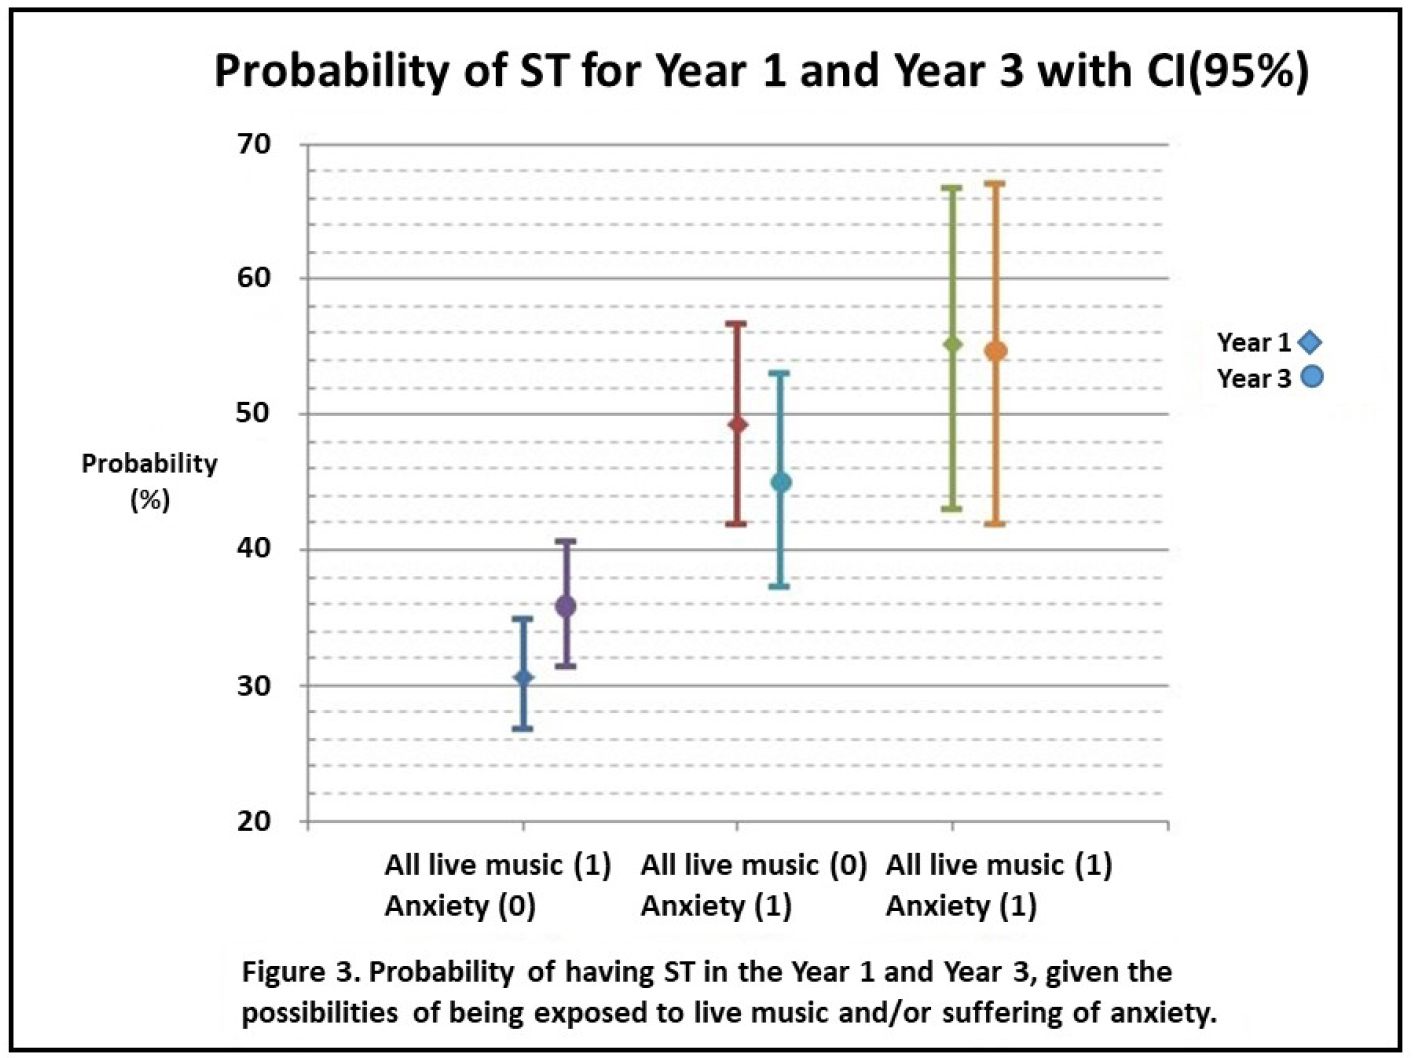
Figure 3. Fitted probabilities of suffering from spontaneous tinnitus if anxiety or noise exposure from live music is present. Diamonds represent Year 1 and filled circles Year 3. The lines signify confidence intervals of 95%.
Noise Induced Tinnitus:
During the first phase of data collection, 55% of the students (N=610, 64% of the girls and 50% of the boys) reported recurrent NIT. Two years later 54% (58% of the girls, 52% of the boys) still experienced the symptom. Pre-existing hearing loss at entry did not correlate to NIT, but heredity did. Children affected with NIT scored significantly higher on the anxiety part of the HADS, but the results did not reach significance in regard of self-reported depressive traits. The multiple stepwise logistic regression analysis results are presented in Figures 1 and 2. In Year 1 the multiple stepwise regression model for NIT showed the strongest correlates to be: Gender, All Live Music and Anxiety, in comparison to Year 3, where the variables differed slightly: i.e., All Live Music, Disco, Hands-free and Anxiety instead. The linear constants were as follows: for Year 1 NIT: =-0.319 + 0.544xGender +0.418xAll Live Music + 0.610xAnxiety (AUC = 0.631) and for Year 3 NIT: =-0.507 + 0.542xAll Live Music +0.414xDisco+0.457xHands-free+ 0.514xAnxiety (AUC = 0.632). This is the only model where gender is statistically significant and also only in Year 1. In the first year, an unusually large portion of the girls (64 % vs. 49%) reported having experience of NIT, while the other symptoms remained in parity with the boys. In the third year, that difference was no longer discernible.
Temporary Threshold Shift:
In the first grade, 39% (N=425, 43% of the girls and 36% of the boys) confirmed recurrent TTS. Two years later the number had increased to 54% (equal gender distribution). Pre-existing hearing loss at school entry did not correlate to TTS, but heredity for hearing loss did. Children reporting TTS scored significantly higher on both the anxiety and depression parts of the HADS. Frequent use of cell phones was highly correlated to NIT and TTS, but the use of earphones did not seem to have any protective influence. The logistic regression presented in Figures 1 and 2 showed the strongest variables to be: All Live Music, Mobile, Recorded Music and Anxiety in Year 1 and All Live Music, Computer and Anxiety in Year 3. The linear constants present as: TTS for Year 1: =-1.396 + 0.517xAll Live Music + 0.374xMobile + 0.317xRecorded Music + 0.688xAnxiety (with AUC = 0.638), TTS for Year 3: =-0.663 + 0.479xAll Live Music -0.357xComputer + 0.523xAnxiety (with AUC = 0.637). For Year 1, mobiles were of significant importance in the development of TTS. The same pattern was present also for Year 3, however, the multiple regression analysis for this variable did not show statistical significance with p= 0.071, yet certainly a trend. The main outcomes of this study were the models of strongest correlates. These models point to several noise exposure factors were live music seems to represent a hazardous environment and possibly unprotected listening habits. These models have a rather weak strength when calculated for with AUC, but what is markedly apparent is the influence of anxiety in all reported symptoms.
Discussion
First and foremost we must answer the question whether the working environment of our students is appropriate, at least from the perspective of noise exposure. The students did not develop more hearing loss, tinnitus or TTS over the three years in school, reassuring as protective measures go. An Argentinian study noticed nevertheless a slight increase in hearing thresholds using a similar observation paradigm as we (15 year olds retested two years later) in youths reporting exposure to loud music[41]. A shortcoming of this type of investigation is the screening audiometry. We do not map the full extent of the subjects hearing but stop at the 20 dB level. Also, in a clinical setting we do not acknowledge small changes in isolated frequencies but in cohort studies we look for trends, were even small changes might prove important. Pre-existing hearing loss at the start of the investigation did not correlate to ST, NIT or TTS in either Year 1 or Year 3. This might be a result of precautionary behaviour and noise avoidance in individuals with subjectively known impaired hearing. Heredity of hearing loss did correlate to all three symptoms, which is more difficult to explain. We can speculate that perhaps the individuals with heredity of hearing loss have not yet developed evidently lowered thresholds but may signal their higher vulnerability with the presence of tinnitus. More girls reported (any of the) hearing symptoms and surprisingly more NIT in the first year and not the third. This finding is interesting and difficult to interpret, since there are two conflicting possible arguments. There are discussions suggesting estradiol serves a protective function in the female auditory system[42] however, this effect could be counterbalanced by a higher prevalence of anxiety in girls[43]. A recent meta-analysis of tinnitus in a pooled population of over 28,000 adolescents confirmed this gender difference [44]. As this study focuses on environmental and psychological impacts, the overall models for each symptom do not include any of the other two hearing symptoms. Although this was calculated for, we feel the presentation is simpler and easier to follow logically without what can be strongly considered as confounding factors. Adding NIT and TTS to the final ST regression model, adding ST and TTS to NIT and ST/NIT to the TTS model did in fact increase the overall strength of the models but only just slightly and at the cost of losing some of the other variables, without any obvious logical pattern to it. As shown in Table 2, the experience of NIT or TTS does correlate weakly to ST, but it is between the variables NIT and TTS we see the strongest correlation, likely signifying that both are more noise related by nature than is ST. We believe that perhaps all three symptoms are interconnected and represent different facets of auditory sensitivity. When calculating for factors influencing the onset of any kind of the discussed hearing symptoms, we should focus on what can be prevented or alleviated (such as noise exposure or anxiety) rather than what describes an already present and probably unavoidable sensitivity (such as concurrent TTS or NIT). The observed difference, with a higher prevalence of already present hearing loss in the occupational education group, could represent different prior noise exposure habits or perhaps are these two socioeconomically different groups with different health service seeking pattern? The noise in school did not seem to influence the youngsters negatively, but the following 16 hours of leisure time were of significance, for instance when looking for just one powerful noise impact factor, playing instruments and attending concerts appear (one or the other) in all of the analyses. These are activities where protecting one’s hearing is controversial and not always possible or wanted [45]. We also noticed a pattern were the variables annotating playing instruments or attending concerts were the two strongest of environmental factors, yet they tended to alternate in strength and sometimes cancel each other. As these two factors arguably could represent more or less the same environment and listening habits, they were pooled into one variable and analysed together. The fact that playing computer games seemed to protect from TTS in Year 3, having a negative B-value, could perhaps represent that year’s population of gamers as being less interested in attending live music scenes and instead choosing the home and the computer as leisure activities? Or perhaps it could be an effect of noise protection from sound conditioning [46]? Mobile phones were noted as a factor in TTS but this is more difficult to explain since the technology had evolved rapidly between the years Year 1 and Year 3 and mobile phones were being merged with portable music players. In Year 1, only 6.4% students used earphones vs. 12.4% in Year 3, while the number reporting use of mobile phones remained unaltered at 70%. Unfortunately, we do not know what the students referred to when answering the question of how much they used their mobile phone with or without hands-free earphones, i.e. if it was for phone calls and therefore being exposed to possibly harmful electromagnetic radiation or if it was for listening to music and thus being exposed to possible high speaker output levels [47]. Both expositions are potential factors in the development of tinnitus [36, 48, 49]. More interestingly, all three hearing symptoms were highly correlated to anxiety and such a correlation, between tinnitus and mood disorders, has been previously established in adults. Generally, anxiety is much more common than depression in youngsters [7], a finding which was also again demonstrated by the frequency numbers in this study. While in the adult population tinnitus appears more strongly correlated to depression than anxiety [27], the reverse seems to be the case for adolescents. The influences for this are yet to be established, if it is due to the psychological development of the young mind or perhaps a slightly different balance in the neurotransmitter systems [50]. Irrespective of cause, the importance of identifying symptoms of anxiety and depression in a youngster complaining of tinnitus is apparent. This study further highlights the importance of educating the young population in terms of noise protection at live venues, both as a visitor and a performer, and once a youth does seek help for tinnitus of any kind, then signs of an untreated anxiety disorder need to be investigated.
Questionnaire regarding hearing symptom and listening habits:
- After you have listened to loud music or noise, have you ever noticed a worsening of your hearing shortly after the cessation of the music or noise? (TTS)
□ No, never
□ Yes, once
□ Sometimes
□ Often
- After you have listened to loud music or noise, have you ever noticed a ringing, buzzing, hissing or beeping noise in your ears shortly after the cessation of the music or noise? (NIT)
□ No, never
□ Yes, once
□ Sometimes
□ Often
- Have you ever noticed a ringing, buzzing, hissing or beeping sound in your ears even if you have not been exposed to loud noise? (ST)
□ No, never
□ Yes, once
□ Sometimes
□ Often
If you have answered NO to the questions 2 and 3, you can skip the questions 5 through 7.
- How often do you have a ringing, buzzing, hissing or beeping sound in your ears?
□ Rarely
□ Often
□ All the time
- Is the sound bothersome for you?
□ No
□ Sometimes
□ Often
□ Always
- How did the sound start?
□ Suddenly
□ Gradually
- How long have you had this sound?
..…..weeks …….months
- How often do you:
Never
Sometimes
Often
Very often
Use noise protection in noisy environments?
□
□
□
□
listen to recorded music in mp3, ipod or equal?
□
□
□
□
Talk on your mobile phone?
□
□
□
□
Use handsfree ear phones with your mobile phone?
□
□
□
□
- How often do you:
Go to concerts?
Never
Rarely
6–12/yr
Twice/month
Several/month
Go to disco?
□
□
□
□
□
Go to cinema?
□
□
□
□
□
Play instruments?
□
□
□
□
□
Use PlayStation/computer/equal with head phones
□
□
□
□
□
Shoot for target practice/use exploding materials?
□
□
□
□
□
Reference
- Holgers KM, Pettersson B (2005) Noise Exposure and Subjective Hearing Symptoms among School Children in Sweden. Noise Health 7: 27–37. (Crossref)
- Baigi A, Oden A, Almlid-Larsen V, Barrenäs ML, Holgers KM (2011) Tinnitus in the general population with a focus on noise and stress: a public health study. Ear Hear 32: 787–789. (Crossref)
- Daniel E (2007) Noise and hearing loss: a review. J Sch Health 77: 225–231. (Crossref)
- Evans GW, Lercher P, Meis M, Ising H, Kofler WW (2001) Community noise exposure and stress in children. J Acoust Soc Am 109: 1023–1027. (Crossref)
- Hellstrom PA (1995) Soud transfer function and hearing. Studies of the acoustics of the external ear and auditory canal in man. In Otolaryngology and audiology University of Goteborg: Goteborg.
- Moller AR, Rollins PR (2002) The non-classical auditory pathways are involved in hearing in children but not in adults. Neurosci Lett 319: 41–44. (Crossref)
- Holgers KM, Juul J (2006) The suffering of tinnitus in childhood and adolescence. Int J Audiol 45: 267–272. (Crossref)
- Eysel-Gosepath K, Daut T, Pinger A, Lehmacher W, Erren T (2012) Sound levels and their effects on children in a German primary school. Eur Arch Otorhinolaryngol 269: 2475–2483 (Crossref)
- Walinder R, Gunnarsson K, Runeson R, Smedje G (2007) Physiological and psychological stress reactions in relation to classroom noise. Scand J Work Environ Health 33: 260–666. (Crossref)
- Sjodin F, Kjellberg A, Knutsson A, Landstrom U, Lindberg L (2012) Noise exposure and auditory effects on preschool personnel. Noise Health 14: 72–82. (Crossref)
- Holgers KM (2003) Tinnitus in 7-year-old children. Eur J Pediatr 162: 276–278. (Crossref)
- Savastano M (2007) Characteristics of tinnitus in childhood. Eur J Pediatr 166: 797–801. (Crossref)
- Juul J, Barrenas ML, Holgers KM (2012) Tinnitus and hearing in 7-year-old children. Arch Dis Child 97: 28–30. (Crossref)
- Park B, Choi HG, Lee HJ, An SY, Kim SW (2014) Analysis of the prevalence of and risk factors for tinnitus in a young population. Otol Neurotol 35: 1218–1222. (Crossref)
- Miyakita T, Hellstrom PA, Frimanson E, Axelsson A (1992) Effect of low level acoustic stimulation on temporary threshold shift in young humans. Hear Res 60: 149–55. (Crossref)
- Holmes AE, Widén SE, Erlandsson S, Carver CL, White LL (2007) Perceived hearing status and attitudes toward noise in young adults. Am J Audiol 16: 182–189. (Crossref)
- Brookhouser PE, Worthington DW, Kelly WJ (1992) Noise-induced hearing loss in children. Laryngoscope 102: 645–55.
- Jamieson DG, Kranjc G, Yu K, Hodgetts WE (2004) Speech intelligibility of young school-aged children in the presence of real-life classroom noise. J Am Acad Audiol 15: 508–17. (Crossref)
- Persson Waye K, Bengtsson J, Kjellberg A, Benton S (2001) Low frequency noise “pollution” interferes with performance. Noise Health 4: 33–49. (Crossref)
- Bulbul SF, Muluk NB, Cakir EP, Tufan E (2009) Subjective tinnitus and hearing problems in adolescents. Int J Pediatr Otorhinolaryngol 73: 1124–1131. (Crossref)
- Coelho CB, Sanchez TG, Tyler RS (2007) Tinnitus in children and associated risk factors. Prog Brain Res 166: 179–191. (Crossref)
- Moore DR, Zobay O, Mackinnon RC, Whitmer WM, Akeroyd MA (2017) Lifetime leisure music exposure associated with increased frequency of tinnitus. Hear Res 347: 18–27. (Crossref)
- Lindblad AC, Hagerman B, Rosenhall U (2011) Noise-induced tinnitus: a comparison between four clinical groups without apparent hearing loss. Noise Health 13: 423–431 (Crossref).
- Hinalaf M, Maggi AL, Hüg MX, Kogan P, Villalobo JP et al. (2017) Tinnitus, Medial Olivocochlear System, and Music Exposure in Adolescents. Noise Health 19: 95–102. (Crossref)
- Meric C, Gartner M, Collet L, Chéry-Croze S (1998) Psychopathological profile of tinnitus sufferers: evidence concerning the relationship between tinnitus features and impact on life. Audiol Neurootol 3: 240–252. (Crossref)
- Zoger S, Svedlund J, Holgers KM (2001) Psychiatric disorders in tinnitus patients without severe hearing impairment: 24 month follow-up of patients at an audiological clinic. Audiology 40: 133–140. (Crossref)
- Malakouti S, Mahmoudian M, Alifattahi N, Salehi M (2011) Comorbidity of chronic tinnitus and mental disorders. Int Tinnitus J 16: 118–122. (Crossref)
- Langguth B, Kleinjung T, Fischer B, Hajak G, Eichhammer P, et al. (2007) Tinnitus severity, depression, and the big five personality traits. Prog Brain Res 166: 221–225. (Crossref)
- Holgers KM, Zoger Sigyn, Svedlund Jan (2003) Tinnitus suffering: a marker for a vulnerability in the serotonergic system?. Audiological Medicine 1: 138–143.
- Thompson GC, Thompson AM, Garrett KM, Britton BH, et al. (1994) Serotonin and serotonin receptors in the central auditory system. Otolaryngol Head Neck Surg 110: 93–102. (Crossref)
- Tyler RS, Coelho C, Noble W (2006) Tinnitus: standard of care, personality differences, genetic factors. ORL J Otorhinolaryngol Relat Spec 68: 14–19. (Crossref)
- Bradley JS, Sato H (2008) The intelligibility of speech in elementary school classrooms. J Acoust Soc Am 123: 2078–2086. (Crossref)
- Axelsson A, Lindgren F (1981), Pop music and hearing. Ear Hear 2: 64–69. (Crossref)
- Axelsson A, Lindgren F (1981) Hearing in classical musicians. Acta Otolaryngol Suppl 377: 3–74. (Crossref)
- Lindgren F, Axelsson A (1983) Temporary threshold shift after exposure to noise and music of equal energy. Ear Hear 4: 197–201. (Crossref)
- McNeill K, Keith SE, Feder K, Konkle AT, Michaud DS (2010) MP3 player listening habits of 17 to 23 year old university students. J Acoust Soc Am 128: 646–53. (Crossref)
- Vogel I, Brug J, Hosli EJ, van der Ploeg CP, Raat H (2008) MP3 players and hearing loss: adolescents’ perceptions of loud music and hearing conservation. J Pediatr 152: 400–404. (Crossref)
- Rosing, S.N., Schmidt JH, Wedderkopp N, Baguley DM (2016) Prevalence of tinnitus and hyperacusis in children and adolescents: a systematic review. BMJ Open 6. (Crossref)
- Bjelland I, Dahl AA, Haug TT, Neckelmann D (2002) The validity of the Hospital Anxiety and Depression Scale. An updated literature review. J Psychosom Res 52: 69–77. (Crossref)
- White D, Leach C, Sims R, Atkinson M, Cottrell D (1999) Validation of the Hospital Anxiety and Depression Scale for use with adolescents. Br J Psychiatry 175: 452–454. (Crossref)
- Biassoni EC, Serra MR, Hinalaf M, Abraham M, Pavlik M, et al. (2014) Hearing and loud music exposure in a group of adolescents at the ages of 14–15 and retested at 17–18. Noise Health. 16: 331–341. (Crossref)
- Charitidi K, Meltser I, Tahera Y, Canlon B (2009) Functional responses of estrogen receptors in the male and female auditory system. Hear Res 252: 71–78. (Crossref)
- Moksnes UK, Espnes GA, Lillefjell M (2012) Sense of coherence and emotional health in adolescents. J Adolesc 35: 433–441. (Crossref)
- Lee DY, Kim YH (2018) Risk factors of pediatric tinnitus: Systematic review and meta-analysis. Laryngoscope 128: 1462–1468. (Crossref)
- Hunter A (2018) “There are more important things to worry about”: attitudes and behaviours towards leisure noise and use of hearing protection in young adults. Int J Audiol 57: 449–456. (Crossref)
- Niu X, Tahera Y, Canlon B (2004) Protection against acoustic trauma by forward and backward sound conditioning. Audiol Neurootol 9: 265–273. (Crossref)
- Olsson H, Juul J, Holgers K (2009) Cell phones, Personal Music Players and Temporary Threshold Shifts in 16-year-old students. ln: Huong S. 13th Asean ORL and Head & Neck Surgery Congress, Medimond International Proceedings: Siem Reap, Angkor, Cambodia.
- Hutter HP, Moshammer H, Wallner P, Cartellieri M, Denk-Linnert DM, et al. (2010) Tinnitus and mobile phone use. Occup Environ Med 67: 804–808. (Crossref)
- Widen SE, Basjo S, Möller C, Kahari K (2017) Headphone listening habits and hearing thresholds in swedish adolescents. Noise Health 19: 125–132. (Crossref)
- Axelson DA, Birmaher B (2001) Relation between anxiety and depressive disorders in childhood and adolescence. Depress Anxiety 14: 67–78. (Crossref)