Abstract
Three studies explored how systematically designed combinations of messages drive the subjective estimation of anxiety. The topics were loss of assets, loss of income, and loss of health, respectively. Respondents evaluated unique sets of 60 vignettes comprising 2-4 messages from a pre-selected set of 36 messages. Deconstruction of the ratings using ordinary least-squares regression revealed the basic anxiety-provoking potential of the loss (additive constant from the model), as well as the part-worth additional contribution of the particular element (the 36 coefficients). The data matrix was enriched by breaking out the respondents in each study into geo-demographic groups, into groups defined by when they experienced the anxiety. The creation of equations for the key subgroups revealed both differences in basic anxiety from size of the additive constant, as well as differences in the power of specific messages to drive anxiety. The approach using Mind Genomics coupled with a detailed self-profiling questionnaire, provides a new way to create an experimentation-oriented method to understand the mind and anxiety, a method which is fast, inexpensive, iterative, and generates scalable databases.
Introduction
We live in an uncertain world, one filled with dangers, resulting in bad things happening to good people [1] causing anxiety, and eventuating into a source of poetry, prose [2], not to mention words spoken to family, friends, and professional helpers in the field of mental health.
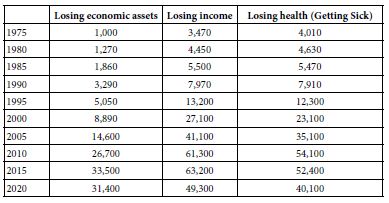
One need only go to Google® or some other source, to get a sense of the pervasiveness of anxiety. Table 1 shows the number of ‘hits’ in Google Scholar®, for the years 1980, 1985, 1990, etc., up to 2020. The topics are anxiety, anxiety about losing one’s assets, anxiety about losing one’s income, and anxiety about losing one’s health, the three major topics dealt with in this paper. Table 1 reveals clear the increase in ‘hits’, show the pervasive interest in anxiety. A reading of this literature will reveal the various aspects, viz., externalities driving anxiety, personal proclivities, and the like. There are numerous references to the physiological correlates of anxiety and situational correlates, along with expected discussions and analyses of personal predilections towards anxiety [3].
Table 1: Number of ‘hits’ in the academic literature pertaining to loss and other personal issues of the topic. Data from Google Scholar®
Understanding Anxiety from the Vantage Point of Mind Genomics
People are fascinated by the life stories of other people A great deal is known about the everyday, perhaps not always from science, but certainly from inter-personal interactions, as well as from published material. If personal experience is not sufficient, we have at our disposal the whole gamut of literature, the diverse ways of describing daily life, presented in an artistic manner to delight as well as to report. With this introduction, then, to the world of anxiety, what can experimentation contribute that has not been contributed in a far more elegant way by the literature, not to mention the analysis of countless sessions, whether with professionals, or far more frequently, with friends?
Conventional research methods give a sense of the nature of the experience (viz., in-depth interviews and focus groups), the distribution of different variations of th experience (viz., polls and quick surveys), as well as the nature of the world surrounding the experience (viz., behavioral studies, anthropological and sociological studies). Absent, however, is a delineation of the experience in a way which combines qualitative approaches to dive deeply into the topic, and quantitative approaches which provides data that can be used to create a database, and from there extract new insights into the topic.
Mind Genomics is an emerging branch of experimental psychology, with roots in psychophysics, in statistics, and in consumer research. The objective of Mind Genomics is to understand the way we respond to the topics of our daily lives, through systematic experiments about responses to descriptions of the ‘ordinary’ [4]. Mind Genomics quantifies how we respond to the general topics, issues, and specific actions of the everyday. For example, the topic of this paper is anxiety, specifically the anxiety emerging from the possible loss of assets, or income, or health, respectively, all three topics important to people. How can we explore the way people think about the anxiety emerging from the disruption of daily life, specifically disruption one of the three areas, assets, income, or health, respectively. How do we respond? Can we quantify our feelings? Are there different patterns of response?
Mind Genomics grew out of the interest in the way people think. Over the 40 years that Mind Genomics developed, the author was active in the world of psychophysics and perception, the study of how we perceive the outside world. It became increasingly obvious that scientists studying various aspects of ordinary behavior were attempting to bring disciplined evaluation from science into the world of the everyday. Missing, however, was an integrated approach, one that could be applied across many different areas, easy to do, and with the potential to easily, and affordably create a large, searchable database which could tell us about the way people think. The focus of Mind Genomics was not to put individuals into unusual situations and observe reactions to the unusual, but rather study reactions to the far more frequent ‘usual,’ the warp and woof of life usually ignored because it is always in view.
Explicating the Approach by Investigating Three Sources of Anxiety Emerging from ‘Loss’
This paper grew out a set of studies called Deal With It!, designed and executed 20 years ago, in 2002. The studies focused on actual issues driving everyday anxiety. The objective was to understand the relation between descriptions of anxiety-provoking situations, and the stated feeling of anxiety experienced by the respondent, who read the descriptions.
The actual process follows these steps:
Step 1: Select the Topics
The actual Deal with It! study comprised an investigation of 15 different topic areas. The respondent was invited to participate by an email invitation. Pressing the embedded link led to the ‘wall’ of studies shown in Figure 1. The respondent selected the study, and participated in the study. This choice of studies allowed the respondent to select a topic of interest. All 15 studies shown in Figure 1 were run. This paper presents and discusses only the results from three of the 15 studies (loss of assets; loss of income; loss of health, respectively).
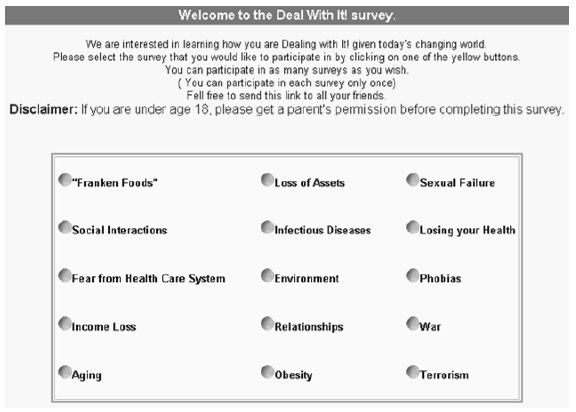
Figure 1: The Wall showing the 15 ‘Deal With It!’ studies. The respondent chose the study in which to participate.
Step 2: Create the Elements according to a Specific Plan
Mind Genomics works by the approach in experimental psychology known as S-R, stimulus-response. The stimuli are messages (elements), messages that will be later combined in a specified manner described below. It is important to select a representative set of these messages, covering various aspects of the topic. One of the benefits of Mind Genomics is the ability to do small initial experiments to identify promising messages. These preparatory efforts are not discussed here.
The basic structure of elements in a Mind Genomics study comprises a set of questions (categories of ideas), and for each set of questions a limited set of answers. Thus, for the Deal With It! studies presented here the underlying structure comprised the topic (viz., nature of loss), then four questions, and then nine answers for each question. Table 2 shows the underlying structure.
Table 2: Structure underlying the creation of the elements
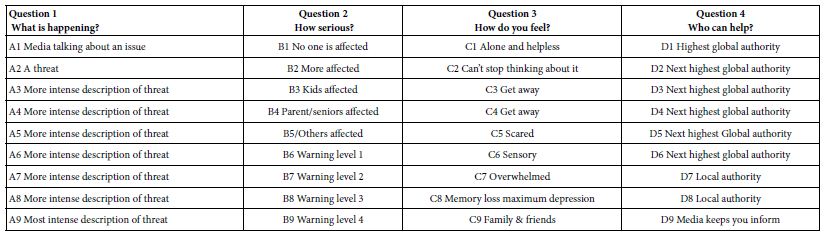
It is important to keep in mind that the set of answers should be chosen so that a combination of answers (our elements) generates the rough outline of a ‘story’ when the elements are combined into vignettes, viz., combinations comprising 2-4 elements. Each vignette can comprise at most one answer from each question, or may be absent answers from one or two questions, as dictated by the design.
There are three requirements for the elements listed in Table 2:
- The questions should be answered by declarative phrases. These phrases should be as short as possible.
- The declarative phrases should paint ‘word’ pictures, even though they are phrases, and not complete sentences. Word pictures are important because they convey idea quickly.
- The four sets of answers comprise the same number of answers in each set. This property makes it possible and straightforward to create experimental designs, templates for the vignettes.
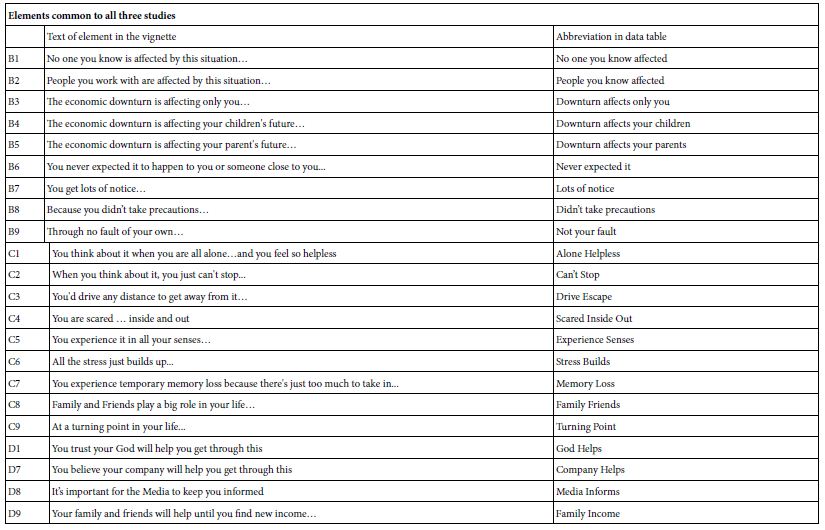
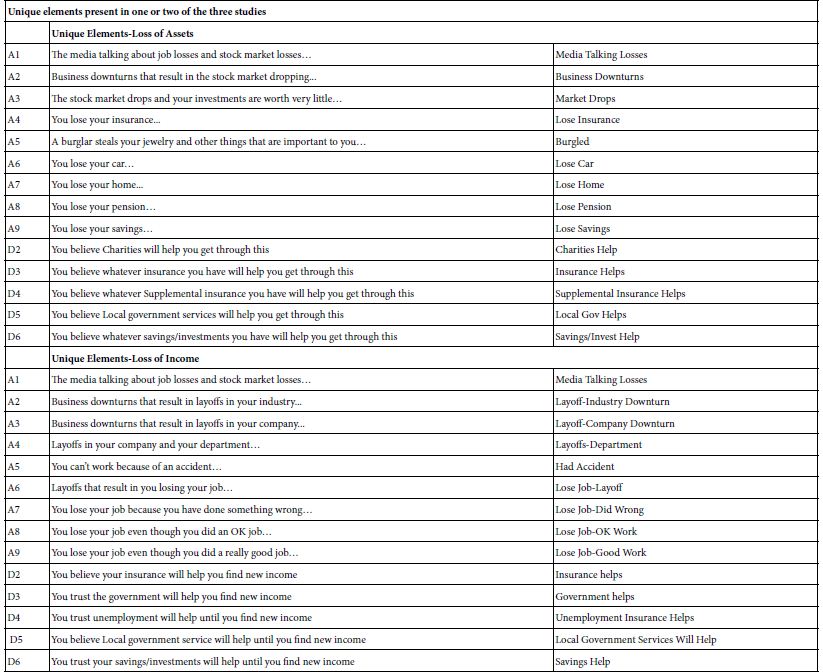
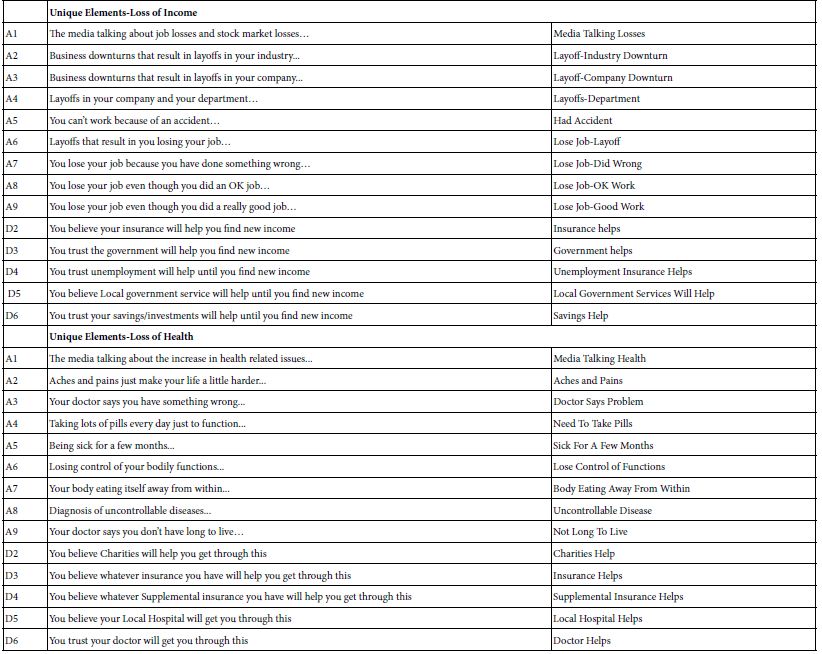
- The actual elements appear in Table 3. Table 3 shows the full text of the different elements and, to the right side, the abbreviated text for the element which appears in the data tables The top part of Table 3 shows the 13 elements common to all three studies. These elements describe one’s feelings, and general actions from the outside. The bottom part of Table 3 shows the unique elements from each of the three studies. In the interest of brevity and readability the data tables present the abbreviated text.
Table 3: Elements in the three studies
Step 3: Combine the Elements into Unique Sets of 60 Combinations (Vignettes)
Mind Genomics moves away from the traditional and hallowed approach of isolating a variable, and studying that variable thoroughly. The rationale for moving away from the traditional ‘isolate and study’ comes from two realizations.
- The reality of our everyday experience is that the experience comprises mixtures of stimuli, not single stimulus in solitude. We could be instructed to pay attention to one stimulus in the mix, and disregard other stimulus, but our mind and our behavior appears to be wired to deal with compound stimuli, with mixtures. The focus on one single aspect is artificial. That focus may work with conventional science, but humans live in a world where they respond most naturally to ever-changing mixtures of stimuli, and NOT to pure stimuli. Pure stimuli are artificial, and the results may fail to mirror what happens in everyday life when stimuli must ‘fight each other’ to gain attention.
- When people judge aspects of their everyday life, they typically use a common scale for the different combinations of the same type of stimuli that they encounter. For example, when a person deals with traveling on a road, most roads of the same type are subject to the same judgment criteria. This makes the person’s job easy, and routine, allowing the person to focus on other issues of the moment. However, were each aspect of the travel on the road to be separately evaluated, such as weather, pavement, trees, time of year, etc., it may well turn out that the respondent uses different criteria to judge each aspect, making it impossible to truly compare travel on one street to travel on the other. The plethora of details, abstracted and evaluated one at a time, makes it likely that the respondent will change the criterion for evaluation for each aspect, to make the criterion fit the topic. The researcher might well think that the respondent is using the same criterion for all judgments whereas in actuality the respondent is dynamically changing the criterion to be appropriate for each isolated aspect. There is no way the researcher could know that unless the respondent were to volunteer, but the respondent might not yet know just what criterion had been used for each of the judgments.
Given the foregoing issue, Mind Genomics studies work in a manner more similar to nature, albeit in manner which is carefully choreographed. The test stimuli no longer are single ideas such as those in Table 2. Rather, the test stimuli become combinations of messages which tell a story, or at least have the surface appearance of something which might actually exist. Her is an example for ‘loss of health.’
Diagnosis of uncontrollable disease…
You never expected it to happen to you or someone close to you…
At a turning point in your life…
You trust your God will help you get through this
The respondent does not rate each of the four phrases (elements), but rather reads the combinations, and assigns a single rating to the combination. Although the messages are compounded into one vignette, the respondent usually has no problem assigning a single rating to the combination. The respondent may not consciously know the criteria used to assign the rating, and may feel that she or he guessed, but subsequent analyses show that the respondent’s ratings generate an interpretable pattern, and the pattern points to consistent criteria for judgment.
The actual combinations follow a prescribed grouping, called an experimental design. The experimental designs for Mind Genomics were created with the property that each of 60 vignettes comprised 2-4 elements, that a vignette could be absent elements from one or two questions but not from three questions, and that the 36 elements were statistically independent of each other. A vignette could have at most one element (answer) from any question, ensuring that a vignette would never present to the respondent pairs of elements which contradicted each other.
The final and most important feature was that the experimental design could be permuted [5]. Permutation means that the basic design could be changed, by having the elements vary; for one permutation an element could be assigned to code A1, whereas for another permutation the same element could be assigned to code A3. The permutation allowed the creation of hundreds of alternative designs, all similar mathematically, but with the elements having different codes. The elements remained within their groups, viz., an element in Question A always remained in that group, but its code changed. The permutation generated several hundred equivalent designs. The permutation made it unlikely that two respondents would ever evaluate the same combination of elements. Finally, the permutation allowed the researcher to explore a wide range of combinations, rather than having to ‘know’ the most promising area to assess. It is this ability to assess a wide range of combinations which makes the Mind Genomics processes a tool to explore in the absence of any knowledge whatsoever.
The design was structured so that the set of 60 ratings assigned to the 60 vignettes in that design (one respondent) could be analyzed by OLS (ordinary least-squares) regression.
For each vignette, the respondent was instructed to read the vignette as a complete entity, and rate the combination, using an anchored scale, as shown in Figure 2.
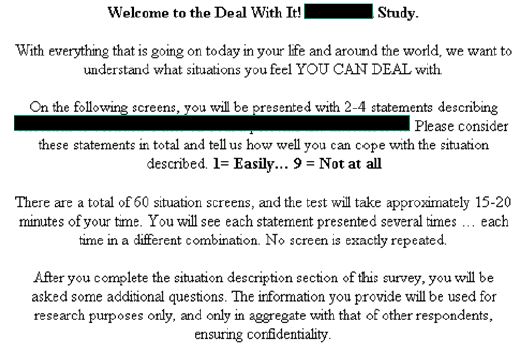
Figure 2: The instruction page
Step 4: Create a Detailed Self-profiling Questionnaire
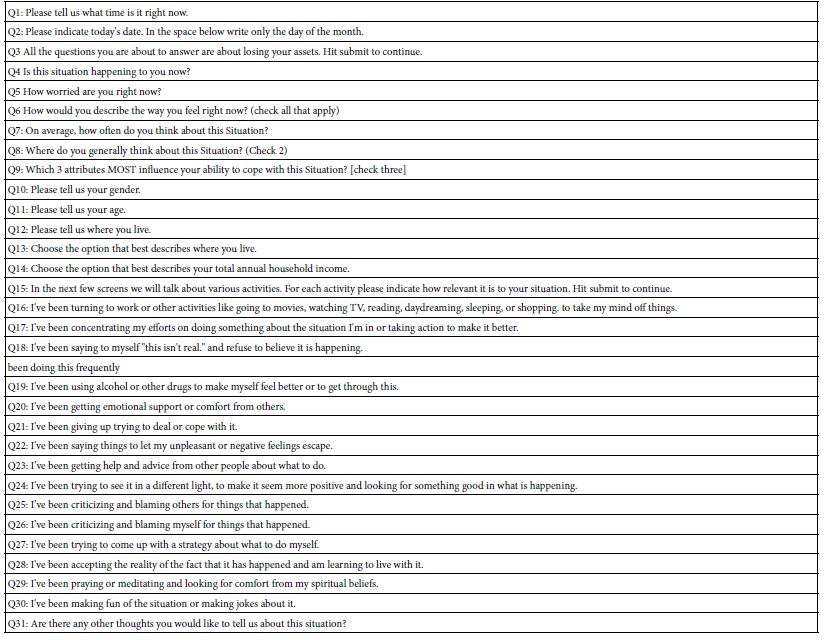
A hallmark of the It! studies was the extensive questionnaire, requiring information from the respondent about WHO the respondent is, WHAT the respondent believes/does, and WHEN the actual participation in the study occurred. Keep in mind that the It! studies were run in the early days of Mind Genomics, around 2000-2004, when the respondents were far more willing to participate in longer studies executed on the Internet. Thus, at that time, there was no issue with adding a few more minutes to the Internet-based interview in order to accommodate the extensive self-profiling questionnaire (Table 4).
Table 4: The self-profiling questionnaire
Step 5: Run the Studies
The studies were placed on a protected server in the United States, owned by Moskowitz Jacobs, Inc. Respondents in the panel owned by Open Venue, Ltd. Of Toronto, Canada, were invited to participate. These panelists had previously signed up to participate in on-line studies. All respondents lived in the United States, even though the panel provider, Open Venue, was Canadian. Throughout the past two decades, as internet-based research has proliferated, it has become increasingly easy to work with a panel provider in one country, who could source respondents in another country, while the researcher lived in a third country.
Analysis-Transforming Ratings, Creating Individual-level Models, Creating Summary Tables
The data from these studies generate a ‘wall of numbers.’ The easiest way to discover patterns is through a straightforward, four step analysis, which reduces the number of data points to those which are strong. It is a great deal easier to discern patterns with 1-5 strong performing elements (all others not shown) than it is to discern patterns with a number-dense array of 36 data points.
The analysis follows these steps:
- At the level of the individual respondent transform the original assigned 9-point rating into a new binary value. Ratings of 1-6 (can deal with it) are transformed to 0. Ratings of 7-9 (cannot deal with it) are transformed to 100. A vanishingly small random number is added to each transformed value, whether the transformation creates a 0 or a 100, respectively. The rationale for transforming the ratings into two numbers comes from the world of consumer research and polling, wherein it is not sufficient to report mean ratings from an anchored Likert Scale, like our 9-point scale, but also necessary to make practical, important decisions using the data. Managers often express discomfort when they work with Likert sales, mainly because they cannot straightforwardly interpret the scales and the statistics. A binary scale moves the result to a yes/no, an all-or-none, something that the managers finds more palatable to help drive action.
- At the level of the individual respondent, use the 60 ‘cases’, viz., data from the 60 vignettes (experimental design and transformed rating) to create an equation or a model representing the linear relation between the presence/absence of the 36 elements and the binary value of the transformed rating. The equation is expressed as: Binary Rating = k0 +k1(A1) + k2(A2)…k36(D9)
- The foregoing equation expresses the relation between the independent elements, which either appear in a vignette (coded as 1 in the regression analysis), or is absent from the vignette (coded as 0 for the regression analysis).
- The additive constant is the estimated proportion or probability of getting a value ‘100’ (viz., original rating of 7-9), in the absence of elements. Of course, by design all vignettes comprise a minimum of two and a maximum of four elements so there cannot be any vignettes without any elements. Nonetheless, the OLS (ordinary least squares) regression estimates the value of k0 for each respondent. We interpret the additive constant as a baseline for anxiety.
- The OLS regression now returns with data for each individual respondent. Whereas before we began with raw data comprising 60 rows for each respondent, the OLS regression returns with data comprising one row for each respondent, both a 60-fold reduction, and the source of insights as shown below. We now move to the second stage of analysis, working only with the output of the OLS regression, done at the level of each respondent.
- The new data, viz., second data matrix, comprises one row for each respondent. The row contains the study identification, the unique identification number for the respondent, the information about the respondent from the self-profiling questions (see Table 3). Following this information about the study and the respondent are 37 columns, the additive constant and the 36 columns, one column reserved for the coefficient of each element.
- We are now ready to create the third data matrix, which will be much simpler. Steps ‘E’ and ‘F’ reduced the data to a manageable format. One last step remains to make the data even easier to understand. We know from statistical analyses that for a coefficient to be ‘statistically significant’ (viz., the coefficient be different from 0), the magnitude of the coefficient for these designs must be approximately 7-9 or higher. Thus can recode each of the 36 coefficients for each respondent. When the original coefficient for a respondent is +10 or higher for an element the element we replace the coefficient by the number ‘100’. When the coefficient is less than 10 for the element (including negative numbers), we replace the coefficient by the number ‘0.’ In this way each respondent generates a series of 36 0’s or 100’s, showing which elements drive anxiety (viz., cannot deal with it.).
- Recall that the respondent completed the self-profiling questionnaire. It is straightforward now to sort the set of transformed profiles into groups, based upon the specific question in the-self profiling questionnaire. In turn, the data being sorted comprises the now-transformed profile of 36 coefficients, which are either 100 (original coefficient for the element being 10 or higher), or 0 (original coefficient for the element being lower than 10). Step G above explicated the transformation.
- The analysis can now move more quickly, using matrices comprising 0’s and 100’s, instead of a matrix of coefficients as estimated for each respondent (F, above). The final step creates averages for each of the 36 elements, for all respondents from a specified subgroup of individuals. The interpretation of the averages is straightforward. The average transformed coefficient for an element from a specified group of respondents is defined as the proportion of respondents in that group who felt that they just ‘cannot handle’ the anxiety (or other internal feeling), when they read the particular element embedded in a vignette.
- Recall that the additive constant can be interpreted as a ‘baseline’ level of anxiety, albeit a derived baseline, emerging from the OLS regression Thus, the average additive constant within a subgroup of respondents can be defined as the likely baseline of anxiety (viz. ‘I cannot deal with it’) for the topic itself for this particular group of respondents.
- Finally, the tables for the strong performing elements are deliberately shortened. For the total panel, only those elements are shown which generate an average of 51 or higher (viz., 51% or more of the respondents in the defined group ‘cannot handle it.’) For the key subgroups defined by the self-profiling classification we make the criterion more stringent, with a value of 55 or higher required to appear in the table. This stringent criterion eliminates most of the elements, allowing patterns to emerge more easily.
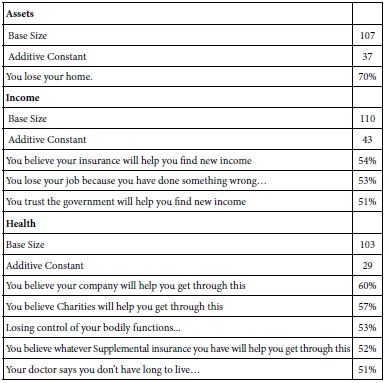
Total Panel
It is clear from Table 5 that only a few elements perform strongly for the total panel. The strongest performing element, viz. the most anxiety provoking, is ‘You lose your home’ (loss of assets), with a mean of 70% expressing strong anxiety. The only other strong element occurs, ‘You believe your company will help you get through this’ (loss of health), with a mean of 60% expressing strong anxiety. We will see the ongoing recurrence of these two elements as strong drivers of anxiety.
Table 5: Strong performing (viz., anxiety-provoking) elements from the total panel. The coefficients are the percent of respondents in the total panel whose coefficient is 51 or higher.
When looking at the strong performing elements, it is important to keep in mind that there is no way that the respondents could have ‘gamed the system.’ The respondent evaluated 60 vignettes, each vignette comprising 2-4 elements. Exit interviews with respondents doing these types of studies have, year after year, revealed that most people think they are guessing. Clearly they are not. They are simply responding at a so-called ‘gut level.’ And, the results are no surprise, although it is disconcerting to see the lack of trust of people in business. Yet,the headlines at the time of this writing (summer, 2022) talking about the ‘great resignation’ and the ‘silent resignation.’ People do not trust their employers to help them.
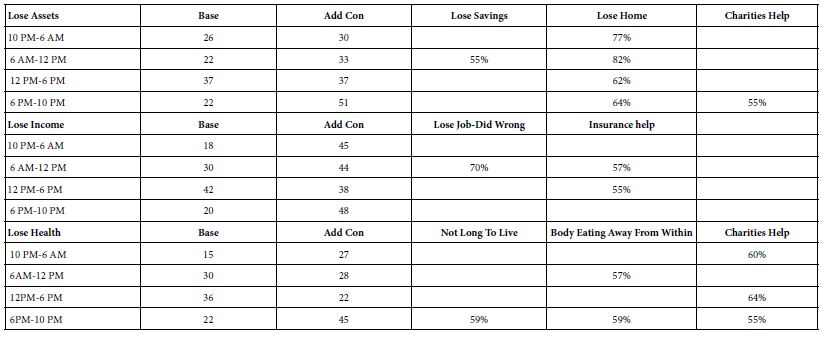
Time of Day When Respondent Participated in the Study
- The first question in the self-profiling questionnaire required the respondent to record the time of day. Table 6 shows that there are time-anxiety relationships, mostly in terms of the additive constant (Add Con). When considered as a baseline level of anxiety, the additive constant is lowest in the afternoon (12 PM-6 PM), and much higher in the evening (6 PM-10 PM). Worries about income are highest in the morning, worries about assets and health are lowest in the morning.
- In terms of the specific elements, the pattern is difficult to discern, except for one’s worry of the loss of one’s home, which is very frequent at all times of the day, but most frequent when the respondent participates in the late evening and during the morning.
Table 6: Strong performing (viz., anxiety-provoking) elements from respondents participating in the study at four defined time periods of the day. The coefficients are the percent of respondents in the total panel whose coefficient is 55 or higher.
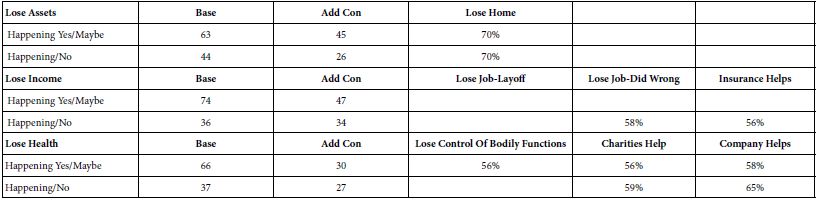
Immediacy of the Loss
- In the self-profiling questionnaire the respondent was instructed to select whether or not the respondent felt that the anxiety-provoking situation was happening or is possibly happening, versus not happening. The response ‘happening yes/maybe’ show different patterns than ‘happening/no.’ The additive constant showing the base level of anxiety for the topic is higher for those reporting ‘happening’ than for those reporting ‘not happening,’ but only for losing assets and for losing income. That is, the basic level of anxiety for monetary loss is higher when it is actually happening. In contrast, the thought of losing one’s health, whether happening or not, shows the same level of anxiety (Table 7).
- As one would expect, the specific elements driving strong anxiety responses (viz., ‘can’t deal with it’) differ by type of loss. The strong anxiety is the thought of losing one’s home. That is, 70% of the respondents report strong anxiety, viz., 70% of the respondents show coefficients for this element of +10 or higher.
- Finally, the thought of external sources of aid is also anxiety producing, not for losing assets but for losing income (relying on insurance aid causes anxiety), and losing health (relying on charities or on one’s company causes anxiety).
Table 7: Strong performing (viz., anxiety-provoking) elements from respondents who are experiencing the issue vs. respondents who are not experiencing the issue. The coefficients are the percent of respondents in the total panel whose coefficient is 55 or higher.
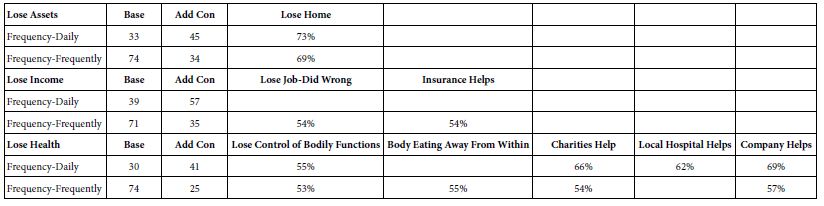
Frequency of Occurrence of the Specific Anxiety
- Our analysis focuses only on those who report experiencing the anxiety daily.
- Lose assets-shows a moderate additive constant. The element which drives anxiety is losing one’s home.
- Lose income-a higher additive constant of 47, but no strong performing elements.
- Lose health-a moderate additive constant of 41, but three strong performing elements based on ‘outside help’ (company, charities, local hospital), and one strong performing element based on the sickness (lose control of bodily functions) (Table 8).
Table 8: Strong performing (viz., anxiety-provoking) elements from respondents who experience the issue daily or frequently, respectively. The coefficients are the percent of respondents in the total panel whose coefficient is 55 or higher.
Geo-demographics of the Respondents
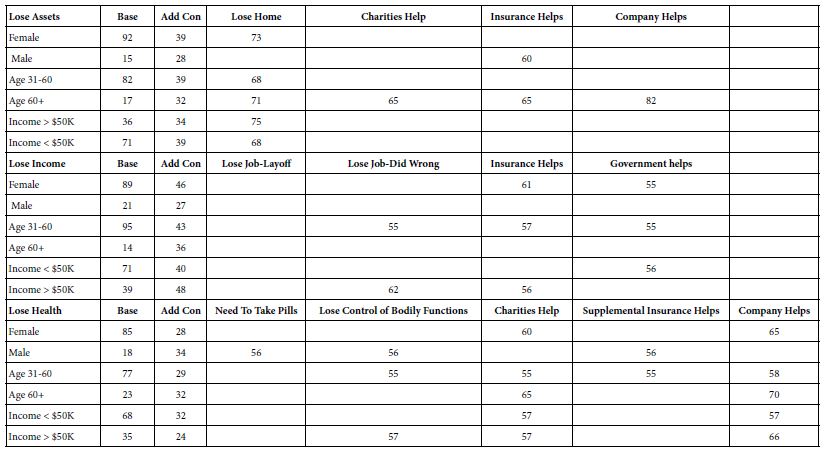
- Females show a higher additive constant than do males (viz., greater proclivity for anxiety) for loss of assets and loss of income, respectively. In contrast, males show a higher additive constant for loss of health.
- Younger respondents show a higher additive constant for loss of assets and loss of income, respectively. In contrast, older respondents show a slightly higher additive constant for loss of health.
- Higher-income respondents show a higher additive constant for loss of assets and loss of income, respectively. Lower income respondents show higher additive constant for loss of health.
- Respondents frequently find help distressing when that help is presented as coming from third parties (charities, insurance, one’s company, etc.) Respondents age 60+ find the help of one’s company quite distressing, both in the case of losing one’s assets (82% find the mention of company to drive anxiety), and in the case of losing one’s health (70% find the mention of company to drive anxiety) (Table 9).
Table 9: Strong performing (viz., anxiety-provoking) elements from respondents self-defined in terms of gender, age, and income, respectively. The coefficients are the percent of respondents in the total panel whose coefficient is 55 or higher.
Location of the Anxiety Occurrence
As part of the self-profiling classification, the respondent was instructed to select the one or two locations where the experience of anxiety occurs. The actual question was phrased as: Q8:Where do you generally think about this Situation? (Check 2)
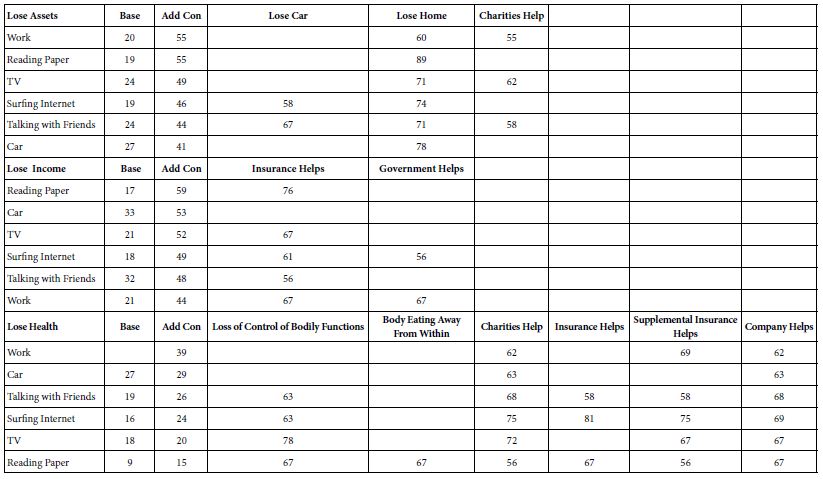
- Table 10 suggests that the basic level of anxiety differs by type of loss and by location. There is no clear pattern, other than loss of assets and loss of income are both high in various places, whereas loss of health is far lower, other than at work (viz., additive constant of 39 for work versus 29 or lower elsewhere).
- Table 10 shows notable differences in the ability to elements to drive anxiety, as well as differences in basic anxiety experienced, with different additive constants for the same location across three sources of anxiety. Recall that the additive constant is a measure of the basic proclivity of the respondent to experience anxiety when the loss or situation is stated in the vignette. For example, when the respondent is at work, the most severe anxiety is occasioned by the thought of losing one’s assets (additive constant = 55). When the respondent is at work, the thought of losing income is less anxiety provoking (additive constant = 44). Finally, when the respondent is at work the thoughts about losing health is the least anxiety-provoking (additive constant = 39).
- It is anxiety about the loss of one’s health which emerges in many different places, and triggered by the greatest number of elements. For losing assets and losing income anxiety is triggered by two or three elements, respectively. For losing health anxiety is triggered by six elements.
- The complexity emerging from Table 10 may require the reader to scan the table, so that the reader’s focus can allow the relevant patterns to emerge.
Table 10: Strong performing (viz., anxiety-provoking) elements from respondents self-defined in terms Where the anxiety is experienced. The coefficients are the percent of respondents in the total panel whose coefficient is 55 or higher.
Emotions Experienced after Participating in the Study
Question 6 in the self-profiling questionnaire instructed the respondent to introspect about her or his global feeling after having evaluated the 60 different vignettes. The respondent was allowed to check all that apply. Table 11 shows the number selecting each emotion, the additive constant for their proclivity to experience anxiety, and the elements most able to drive anxiety for the particular subgroup of respondents. As was the case for many of the other tables (except self-profiling geo-demographics shown in Table 9), each section of the table is sorted in descending order by additive constant.
Table 11: Strong performing (viz., anxiety-provoking) elements from respondents self-defined in terms of how the respondent feels after evaluating the 60 vignettes. The coefficients are the percent of respondents in the total panel whose coefficient is 55 or higher.
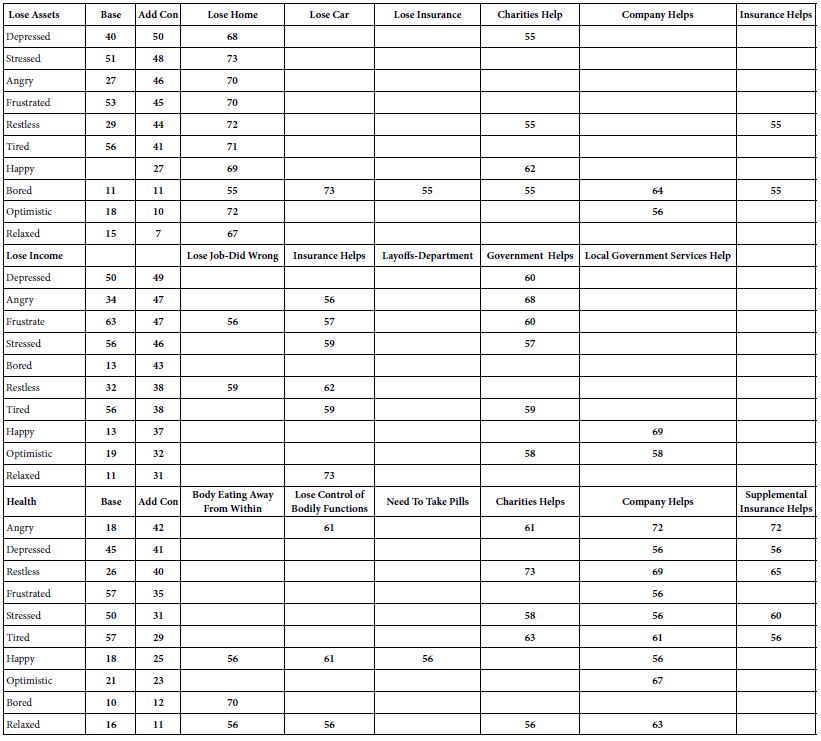
The first observation is that the rank order of additive constants makes sense, at least at the most general level. Those who check off ‘angry’ or ‘depressed’ show the highest additive constant. Those who check off optimistic and relaxed show the lowest additive constant. There are no surprises here, other than that the data appear to show consistency across different measures, in a way that would be hard to ‘game.’
The second pattern is the nature of the elements which drive anxiety.
- For losing assets the elements driving anxiety are help from charities, from company, and from insurance, respectively. These elements ‘jump’ out from individuals/emotions showing low additive constants. That is these elements disturb people who are otherwise not prone to feeling anxiety, reflected in the low additive constants.
- For losing income the emergent pattern differs. The strong drivers of anxiety are expectation of help from insurance, and expectation of help from the government. These elements drive anxiety, no matter what the respondent feels.
- For losing health anxiety is strongest when the messages are help from charities, from the company, and from supplemental insurance, no matter what the emotion felt, and no matter how high the additive constant (basic proclivity to anxiety).
The Person’s Self-chose ‘Relevant Responses’ to the Situation
Questions 16-30 in the self-profiling questionnaire instructed the respondent to check the activities that the respondent thought to be relevant for the particular anxiety-provoking situation which was the topic of the study. The question was phrased as: In the next few screens we will talk about various activities. For each activity please indicate how relevant it is to your situation. The phrasing did not direct the respondent to say what the respondent was actually doing, but rather what was thought to be relevant.
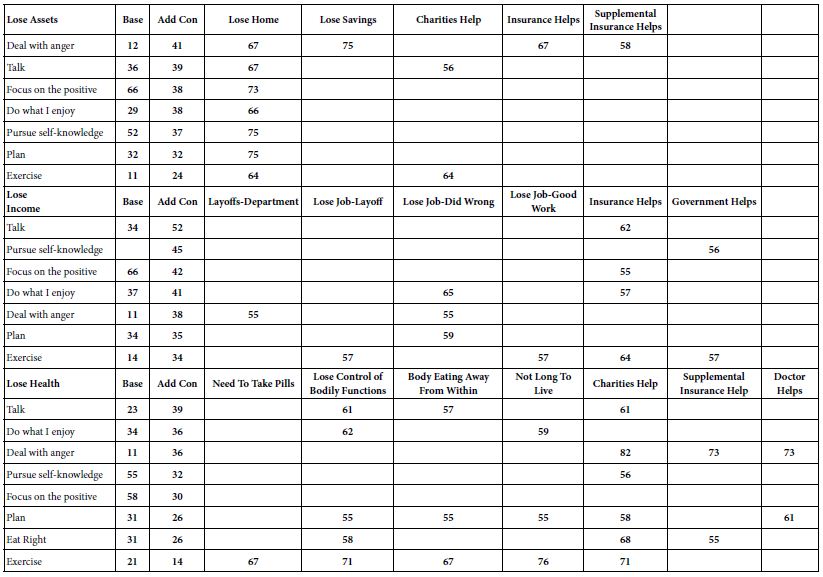
Table 12 shows that respondent differentiate among the relevant or appropriate responses to loss, at least based upon the additive constant. If we assume that the higher the additive constant represents the proclivity to anxiety for the specific loss, then the three losses engender different behaviors patterns of anxiety associated with the behaviors that the respondents feel to be ‘relevant’ in the wake of the loss.
- For loss of assets, the effort to deal with anger generates the highest additive constant (41), i.e., the highest proclivity to anxiety. Exercise generates the lowest additive constant (24).
- For loss of income, ‘talking’ generates the highest additive constant (52) whereas exercise generates the lowest additive constant (34).
- For loss of health, ‘talking’ again generates the highest additive constant (39) whereas exercise generates the lowest additive constant (14)
- There are different elements which drive anxiety. For losing assets it is clearly losing one’s home. For losing income it is clearly the mention of help from insurance, as well as losing one’s job because of one’s own mistakes. For losing health, it is loss of bodily functions as well as the dependence upon charity.
Table 12: Strong performing (viz., anxiety-provoking) elements from respondents self-defined in terms of what the respondent feels to be the relevant action to be taken given that loss occurs. The coefficients are the percent of respondents in the total panel whose coefficient is 55 or higher.
Discussion and Conclusions
An inspection of today’s scientific methods suggest that a great deal of the focus is placed on either filling ‘holes’ in the literature, or creating limited-scope hypotheses about a topic [6]. The ascendance of the hypothetico-deductive system, coupled with the increasing focus on inferential statistics to support hypotheses, mean that the studies become increasingly more focused, far more narrow. As a consequence, the scientific community has learned to deconstruct a topic such as responses to everyday anxiety provokers into small pieces, viz., testable hypotheses. An example might be that the most severe anxiety producer is the expected loss of one’s home, a statement that can be assessed by having the respondent rate the different losses in terms of severity. This is an attractive finding, one that can be tested, and which gives a ‘sense’ of how people think about anxiety. The finding is certainly better than simply saying that there are a number of anxiety producers, such as loss of home, loss of health, loss of income, and so forth.
When the researcher moves beyond the simple aspects, the one-at-a-time thinking, the traditional way of doing so have been to use qualitative methods, discussion, and observation (e.g., [7]). The researcher can get a sense of the nature of the way people cope with anxiety producing situations, e.g., by using one-on-one depth interviews with one or two people to discuss their feelings about the anxiety issue. Or, as if often the case, the researcher can use group discussions, where a group of individuals guided by a trained professional discusses a topic.
The contribution of Mind Genomics to the knowledge of anxiety is to move the approach to experimentation and collection of ancillary information about the respondent. Mind Genomics can determine whether defined subgroups of individuals show identifiable, interpretable patterns of responses to test stimuli. These groups are those emerging from using the self-profiling classification (Table 3) as a system for creating these subgroups. The results can be new insights into the mind of the person, responses generates to systematically controlled and varied verbal stimuli (viz., the elements in the vignettes).
The Role of the Additive Constant
As noted in the methods section, the additive constant is the ‘adjustment factor’ incorporated into the regression to correct for the fact that the regression model may not actually go through the origin. In terms of the underlying mathematics, the additive constant is the estimated value of the dependent variable when all of the independent variables are 0. In Mind Genomics terms, the additive constant is the estimated value of the binary rating (viz., 7-9, ‘cannot deal with it’, i.e., makes me anxious) when there are no elements present. We choose to call it the predisposition to express anxiety.
The additive constant emerges from the pattern of responses to the 60 different vignettes. Thus, it is virtually impossible to ‘game’ the Mind Genomics experiment, in order to provide a desired, pre-defined additive constant. Furthermore when we look at the change in the additive constant across different situations different emotions, and so forth, we find that for the most part the rank order of the additive constants makes intuitive sense. For example, those who have just participated in the experiment and are feeling happy or optimistic show a lower additive constant than those who have just participated in the same experiment, albeit with different combinations of elements. Thus the additive constant can be analyzed in and of itself as a basic metric of predisposition to anxiety.
The Role of the ‘Transformed Coefficients’
As noted in the analytic section, the data from each respondent were used to create an individual-level equation relating the presence/absence of the elements to the likelihood of having an anxiety-driven response (viz., 7-9, cannot deal with it). The individual coefficients were transformed so that all coefficients of 10 or higher (viz. element ‘drives’ anxiety response) were transformed to one number, the value ‘100.’ All remaining coefficients under the value 10 (whether positive, zero, or negative) were transformed to 0 (viz., element does not ‘drive’ a strong anxiety response for that individual). This transformation of the coefficient enables the researcher to average the transformed values. The average represents the proportion of respondents in the group who feel that the element is felt to ‘drive’ anxiety. For our analysis, the story emerges when we look only at those elements driving a majority of the respondents to respond that ‘I can’t deal with it’ (viz. coefficient of 10 or higher).
When we look across the elements and groups, we begin to get a sense of what elements are thought by respondents to drive anxiety. Most surprising is the exceptionally negative response to elements talk about the ‘help’ proffered by groups, including charities, government, and one owns company, respectively This disbelief in organized help and corporate help is worth further investigation because the disbelief seems cynical in the face of the oft-proclaimed desire of groups be of help ‘when the situation arises.’ One hears organization proclaiming their aid, actual and emotional, in times of need. The disbelief by respondents could be considered to be an artifact, casting doubt on the entire effort because the disbelief goes head to head with the organization messages. Yet, the disbelief is credible. The experimental design makes it again impossible to ‘game the system,’ and so the disbelief, the cynicism must be respected and investigated.
Contributions of Mind Genomics to Our Knowledge of People
The published academic literature deals with many types of losses that people sustain, and the response to them. The majority of these studies focus on specific issues, such as loss of jobs and failure to pay mortgage, but most frequently on the loss of health and what it entails [8-12]. These studies focus narrowly on the topic, looking at the issue in depth. By their very nature, the studies are narrow and limited, rather than being holistic. In contrast, Mind Genomics presents a ‘deep dive’ into the problem, albeit one mediated by the S-R (stimulus-response) method from experimental science. Mind Genomics provides an easy-to-develop scalable database, useful to measure the subjective degree of anxiety, as well as identify the possible triggers, executed in a way where the ‘experiment’ is less threatening because of its superficial similarity to the now common Internet-based survey.
Acknowledgment
The author would like to acknowledge the efforts of the late Hollis Ashman of the Understanding and Insight Group, Inc., for her efforts in putting together the 15 It! studies, under the auspices of It! Ventures, LLC. It was through Hollis’ efforts that the studies were designed, executed, and initially reported during the years 2003 to 2006.
References
- Kushner HS (2007) When Bad Things Happen to Good People. Anchor.
- Bloom H (1997) The Anxiety of Influence: A Theory of Poetry. Oxford University Press, USA.
- Ketonen EE, Visajaani S, Lonka K, Salmela-Aro K (2022) Can you feel the excitement? Physiological correlates of students’ self-reported emotions. British Journal of Educational Psychology 12534. [crossref]
- Moskowitz HR (2012) ‘Mind Genomics’: The experimental, inductive science of the ordinary, & its application to aspects of food & feeding. Physiology & Behavior 107: 606-613. [crossref]
- Gofman A, Moskowitz H (2010) Isomorphic permuted experimental designs and their application in conjoint analysis. Journal of Sensory Studies 25: 127-145.
- Kell DB, Oliver SG (2004) Here is the evidence, now what is the hypothesis? The complementary roles of inductive & hypothesis-driven science in the post-genomic era. Bioessays 26: 99-105. [crossref]
- Traina G, Feiring E (2020) ‘There is no such thing as getting sick justly or unjustly’–a qualitative study of clinicians’ beliefs on the relevance of personal responsibility as a basis for health prioritisation. BMC Health Services Research 20: 497. [crossref]
- Abumrad NN, Frexes-Steed M (1990) What getting sick means. Journal of Parenteral and Enteral Nutrition 14: 157S-163S. [crossref]
- Budetti J, Schoen C, Simantov E, Shikles J (2000) Risks for midlife Americans: Getting sick, becoming disabled, or losing a job and health coverage. New York: The Commonwealth Fund.
- Clarke DM (2007) Growing old and getting sick: maintaining a positive spirit at the end of life. Australian Journal of Rural Health 15: 148-154. [crossref]
- Dy S, Lynn J (2007) Getting services right for those sick enough to die. British Medical Journal 334: 511-513.
- Houle JN, Keene DE (2015) Getting sick and falling behind: health and the risk of mortgage default and home foreclosure. Journal of Epidemiology & Community Health 69: 382-387. [crossref]