Abstract
The efficacy of thermal inactivation for viruses may be studied in solutions (liquid or suspension inactivation) or surfaces (carrier inactivation). Thermal inactivation on surfaces is studied using prototype surfaces (carriers, such as glass or steel). The time kinetics of inactivation and the efficacy of inactivation at different temperatures may differ between surface and suspension heating, although side-by-side studies of suspension vs. carrier inactivation have rarely been performed. Thermal inactivation efficacy depends upon a number of factors, including the matrix in which the virus is suspended or dried on a surface, the specific liquid or surface in which the virus is to be inactivated, the type of virus, the temperature, and the time at temperature. In the present paper, we have evaluated the suspension and carrier inactivation of feline calicivirus (family Caliciviridae) and herpes simplex type 1 (family Herpesviridae). The side-by-side testing design allowed direct comparison of inactivation on carriers (glass and steel) versus inactivation in suspensions (culture medium and newborn calf serum). For both viruses, the time required to inactivate 1 log10 of virus (i.e., the D value) at 65°C was similar (4-7 min) in both carrier and suspension inactivation studies. At lower temperatures (46 and 56°C), the calculated D values were greater for suspension inactivation than for carrier inactivation, and for feline calicivirus than for herpes simplex type 1.
Keywords
Carrier inactivation, D value,Feline calicivirus,Herpes simplex virus type 1, liquid inactivation, Thermal inactivation
Introduction
Thermal (heat) inactivation is an important physical inactivation approach applied for pathogen reduction and has been used for viral inactivation in suspensions and, to a lesser extent, on contaminated surfaces. Pasteurization is an example of thermal inactivation applied to suspensions [1], as is high-temperature, short-time treatment [2]. Steam-in-place and hot water cleaning are examples of thermal inactivation of surfaces [3,4]. Is thermal inactivation in suspension more effective and does it have faster kinetics compared to inactivation on surfaces? Are lipid enveloped viruses such as herpes simplex virus type 1 (HSV-1) more susceptible to thermal inactivation than non-enveloped viruses such as feline calicivirus (FeCV)? For years the prevailing opinions on both of these questions have been in the affirmative. Very few systematic studies have been performed to answer these questions. The question of suspension vs. carrier inactivation by heat has not been addressed in enough side-by-side studies to allow conclusions to be made. While it is generally accepted that the animal parvoviruses (e.g., bovine parvovirus, canine parvovirus) are the most heat-resistant of the viruses [5], the assumption that non-enveloped viruses as a class are more resistant to thermal inactivation than enveloped virus has not been demonstrated unequivocally. The data collected for suspension heat inactivation [5] would seem to argue against this assumption.Thermal inactivation in suspensions is typically a first-order process, meaning that a plot of log10 inactivation is linear with respect to time at temperature [6,7]. Deviations from linearity may occur as a result of experimental error or inactivation of available remaining infectious virus [8]. For a first-order process, a decimal reduction factor (D) can be calculated. The D value is the amount of time required at any given temperature to inactivate 1 log10 of virus. If D values are obtained for at least three different temperatures, a plot of D value vs. temperature may be created [7]. The benefit of such a plot, which has the form of a power curve, is that estimates can be made of D values at non tested temperatures. For thermal inactivation of surfaces, the time kinetics can display non-linearity in plots of inactivation vs. time for the same reasons mentioned above for suspension heating. In addition, it may be more difficult to quench the heat inactivation on surfaces relative to suspensions. In any case, estimates of D values for either suspension or carrier thermal inactivation kinetics can be subject to experimental error. Conclusions regarding kinetics and efficacy should be made keeping this in mind, and the totality of the data should be considered when making conclusions and when estimating extent of inactivation at multiples of D and at non-empirically tested temperatures.
In the present paper, we have evaluated the suspension and carrier thermal inactivation of two model viruses. Feline calicivirus is a surrogate for human norovirus and has therefore received considerable attention in disinfectant efficacy [reviewed in 9] and thermal inactivation efficacy studies [reviewed in 5]. This is a non-enveloped virus in the Caliciviridae family. The second model virus is HSV-1, a member of the Herpesviridae family and an enveloped virus. This is used as surrogate for important animal herpesviruses such as pseudorabies virus and equine herpesvirus [10].
Methods
Viruses
Feline calicivirus (FeCV), strain F9, was propagated in CRFK cells (American Type Culture Collection CCL-94). The virus was diluted in Roswell Park Memorial Institute (RPMI) medium supplemented with 5% newborn calf serum (NCS, source: ThermoFisher Scientific, Waltham, MA) and added to T-75 flasks of the CRFK cells. The flasks were incubated at 36±2°C with 5±1% CO2 for 90 minutes to allow for viral adsorption, after which they were refed with growth medium. Incubation was continued at 36±2°C with 5±1% CO2 until all of the cells exhibited viral cytopathic effect (CPE). The flasks were frozen at -80°C and then thawed at room temperature. The medium from the flasks was collected and clarified by centrifugation at 2,000 rpm for 15 minutes, and the resulting supernatant was aliquoted and stored at -80°C until use. The certified titer of the stock FeCV was determined to be 7.05 log10 tissue culture infective dose50 per mL (TCID 50/mL) in CRFK cells. Herpes simplex type 1 (HSV-1), strain HF, was propagated in Vero cells (American Type Culture Collection CCL-81). The virus was diluted in Roswell Park Memorial Institute (RPMI) supplemented with 5% NCS and added to T-75 flasks of the Vero cells. The flasks were incubated at 36±2°C with 5±1% CO2 for 90 minutes to allow for viral adsorption, after which they were refed the growth medium. Incubation was continued at 36±2°C with 5±1% CO2 until ~80% of the cells exhibited viral CPE. The flasks were frozen at -80°C and then thawed at room temperature. The medium from the flasks was collected and clarified by centrifugation at 2,000 rpm for 15 minutes, and the resulting supernatant was aliquoted and stored at -80°C until use. The certified titer of the stock HSV-1 virus stock was determined to be 7.27 log10 TCID 50/mL in CRFK cells.
Carriers and liquid matrices
Glass carriers consisted of 4-in2 area of a sterile glass Petri dish. Steel carriers consisted of brushed stainless steel discs 1 cm in diameter. The Serum matrix consisted of undiluted NCS,while the Medium matrix consisted of RPMI medium containing 2% NCS for FeCV and HSV-1.
Evaluation of heat inactivation (duplicate replicates)
Virus was spread (Figure 1) onto the glass carriers (0.4 mL virus suspension) or steel carriers (0.05 mL virus suspension) and allowed to dry at room temperature (20–21°C) per ASTM International (ASTM) standard E1053 [11]. For liquid inactivation, 0.2 mL of virus suspension was added to 1.8 mL of NCS or RPMI in glass tubes per ASTM standard E1052 [12]. Carriers containing virus were placed into a hot-air oven (Isotemp™ General Purpose, Fisher Scientific Catalog No. 151030509) set at one of three test temperatures (46°C, 56°C, and 65°C) for 5, 20, or 60 minutes. The relative humidity of the oven was not measured. Glass tubes containing virus/RPMI or virus/NCS solutions prepared as described above were placed into a hot air oven set at one of the test temperatures (46°C, 56°C and 65°C) for 5, 20, or 60, 120, or 180 minutes. The relative humidity of the oven was not measured. Following the heating times, 4 mL of neutralizer (NCS) were added to the virus film on the glass or steel carriers and used to remove the film from the surface with cell scrapers. The liquid heat inactivation conditions were neutralized following heating by addition of 2 mL of cold neutralizer.Post-neutralization samples were serially diluted, and selected dilutions were inoculated onto the proper host cells for each virus (8-wells per dilution in 96-well plates). A virus recovery control (VRC) was included to determine the relative loss in virus infectivity as a result of drying and neutralization. Virus was applied to the carriers (Glass or Steel) or added to liquids (NCS or RPMI) and held at room temperature (20±1°C) for the longest contact time evaluated (60 or 180 minutes). The various 96-well plates were incubated at 36±2°C with 5±1% CO2 for 7–8 days (FeCV and HSV-1). Following incubation, the plates were scored for CPE. The 50% tissue culture infective dose per mL (TCID 50/mL) was calculated using the Spearman-Kärber formula [13]. The titers for the VRC were then compared to titers for the corresponding heat-treated carrier/matrix type to calculate the reduction in infectivity caused by heat treatment [Figure 1].
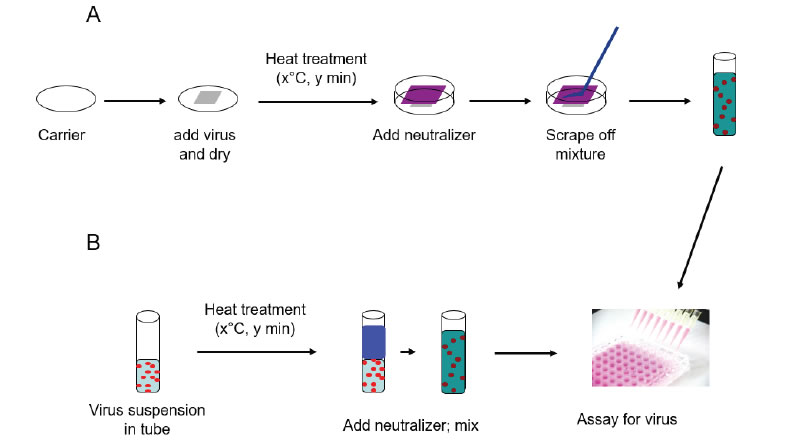
Figure 1. Schematic representation of surface and suspension inactivation methodology (from reference [8]).
Calculation of D and z values and power function analysis
Decimal reduction (D) values were estimated from the most linear portions of the inactivation vs. time curves for the various set temperatures (not shown). The plots included both replicate values for any given temperature and time point, therefore represent an analysis of the pooled replicate data, with a single D value being generated. Rapid deviation from linearity in these plots was noted as complete inactivation of virus occurred rapidly at the higher temperatures. We acknowledge that a certain degree of error is associated with the D value estimation process. Such errors do not detract from the validity of the comparisons to be made between carrier and liquid inactivation results, since comparison of the raw inactivation vs. time results obtained leads to similar conclusions.The z value (°C per log10 change in D) for a given data set was obtained from plots of log10D vs. temperature (not shown), evaluated using the linear regression function of Excel. The z value is obtained as 1/slope (m) from the linear fit equation (Eq. 1):
![]()
where y = log10D, x = temperature, m = slope, and b = y-axis intercept.
Plots of D vs. temperature were evaluated using the power function of Excel to obtain the line fit equation (Eq. 2): ![]() (Eq. 2) where y = D, x = temperature, and a and b are constants unique to each line fit equation. This equation allows one to extrapolate the D value at any given inactivation temperature, and can also be rearranged to solve for temperature at any given D value, as shown in (Eq. 3):
(Eq. 2) where y = D, x = temperature, and a and b are constants unique to each line fit equation. This equation allows one to extrapolate the D value at any given inactivation temperature, and can also be rearranged to solve for temperature at any given D value, as shown in (Eq. 3): ![]() (Eq. 3) allowing one to estimate the inactivation temperature required to achieve a desired D value [7].
(Eq. 3) allowing one to estimate the inactivation temperature required to achieve a desired D value [7].
Results
Feline calicivirus
The thermal inactivation of FeCV was studied in carrier studies (Glass and Steel), and in suspension studies (RPMI and NCS). This virus is a small, non-enveloped virus that is considered to display medium resistance to physicochemical inactivation [14]. Temperatures of 46, 56, and 65°C were evaluated in two replicate trials each. The mean values from the replicates are displayed in Table 1. The extent of inactivation on carriers was minimal at up to 60 minutes heating time at 46°C. At this temperature, the inactivation achieved in suspension failed to reach even 1 log10. At 56°C, significant (>2 log10) inactivation occurred on carriers by 20 min, but not in suspension heating. In that case, 60 min heating was required. At 65°C, the time kinetics and extent of inactivation at the various times were similar for carrier and suspension inactivation [Table 1].
Decimal reduction (D) values were estimated from the initial linear portions of the inactivation vs. time curves at each temperature (Table 2). In the case of the 46°C trials for suspension heating, the D values had to be estimated on the basis of the first-order inactivation vs. time curves for these trials (plots not shown). While not ideal, these estimates allowed comparison between the carrier data and the suspension data, and enabled us to plot the relationship between temperature and D (Figure 2) [Table 2]. The plots in Figure 2 can be interpreted as follows: the resulting power function fit lines may be viewed as surfaces along which any temperature and D value pair is associated with 1 log10 inactivation of the virus [7]. The extrapolation of D to non-empirical temperatures, which may also be done by means of the calculated z values (Table 2), is quite easy and straightforward using the power function coefficients and Eq. 2 (Methods section). Also apparent from examination of Figure 2 is that at lower temperatures (especially 46°C), much longer heating times are required to cause 1 log10 inactivation in suspension, while at 65°C, inactivation is very rapid in both suspension and carrier heating [Figure 2].
Figure 2. Relationship between D and temperature for FeCV inactivation in suspension (●, NCS; ▲, RPMI) or on surfaces (○, Glass; Δ, Steel).
As FeCV has often been used as a surrogate for human norovirus, a calicivirus of considerable food safety interest, there have been several reports of inactivation of FeCV by suspension heating [15-20]. As these reports included sufficient detail and an experimental design allowing for calculations of D values from at least three different temperatures, it was possible to calculate power function coefficients from each study and therefore to create a plot comparing directly the D vs. temperature relationships (Figure 3). Note that the plot in Figure 3 does not display the temperatures actually tested empirically in the literature studies, rather it displays the D values at 46, 56, and 65°C calculated from the power function coefficients and Eq. 2. The greatest experimental error, and therefore the highest level of variability, is associated with the D values calculated for the lower temperature (46°C). Nevertheless, the plots are qualitatively similar in appearance and each study demonstrates rapid inactivation of FeCV at 65°C [Figure 3].
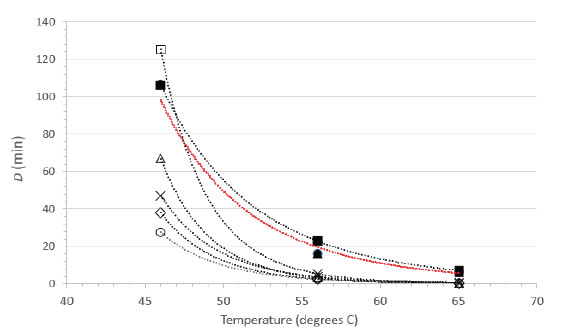
Figure 3. Relationship between D and temperature for FeCV inactivation in suspension. Data from the current study (●, RPMI; ▲, NCS) are compared with FeCV suspension inactivation data from the literature (○, Duizer, et al. [15]; ◊, Buckow, et al. [17]; ×, Bozkurt, et al. [20]; Δ, Bozkurt, et al. [19]; □, Cannon, et al. [16]; ■, Gibson and Schwab [18]). The line in red color represents the overlapping power fit lines for our studies in NCS and RPMI.
Herpes simplex virus type 1
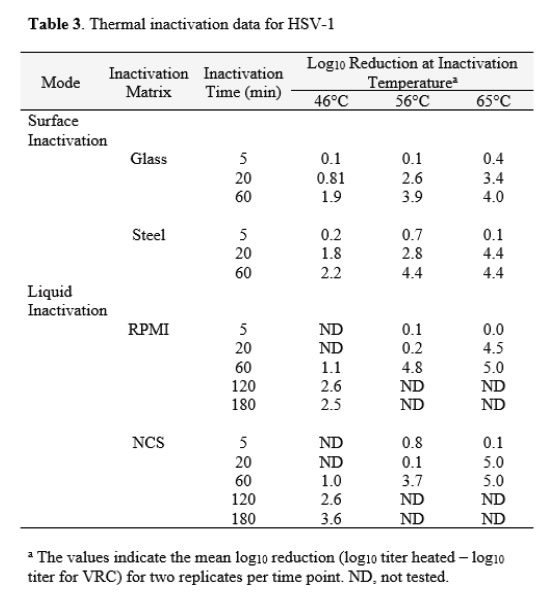
The thermal inactivation of HSV-1 was studied in carrier studies (Glass and Steel) and in suspension studies (RPMI and NCS). This virus is a large enveloped virus that is considered to display medium resistance to physicochemical inactivation [14]. Temperatures of 46, 56, and 65°C were evaluated in two replicate trials each. The mean values from the replicates are displayed in Table 3. Extended time points were used in the study of inactivation in suspension at 46°C to enable estimation of D values at that temperature, as no evidence of first-order kinetics were observed at times less than 60 minutes.The extent of inactivation on surfaces was approximately first-order through 60 min of heating time on carriers at 46°C. At this temperature, the inactivation achieved in suspension failed to reach even 1 log10, and as mentioned above, gave no evidence of linearity of inactivationvs. time though 60 min. At 56°C, significant (>2 log10) inactivation occurred on carriers by 20 min, but inactivation did not occur at this time and temperature in suspension heating. In the case of suspension heating, 60 min was required. At 65°C, the time kinetics and extent of inactivation at the various times were similar for carrier and suspension inactivation [Table 3].
Decimal reduction (D) values were estimated from the linear portions of the inactivation vs. time curves at each temperature (Table 4). The D estimates allowed comparison between the carrier data and the suspension data, and enabled us to plot the relationship between temperature and D (Figure 4). As observed with FeCV, the data in Table 4 and the plots in Figure 4 show that at lower temperatures (especially 46°C), much longer heating times are required to cause 1 log10 inactivation in suspension, while at 65°C, inactivation is very rapid in both suspension and carrier heating [Table 4 & Figure 4].
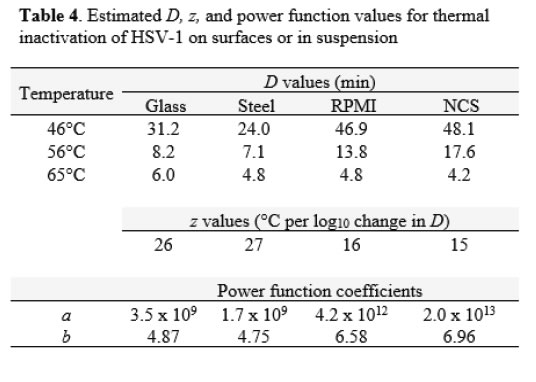
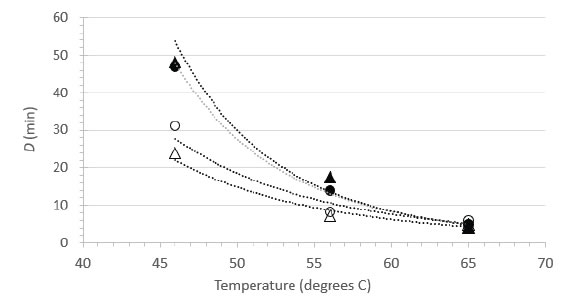
Figure 4. Relationship between D and temperature for HSV-1 inactivation in suspension (▲, NCS; ●, RPMI) or on surfaces (○, Glass; Δ, Steel).
Herpes simplex virus type 1 is available in most virology laboratories and is often used as surrogate for other herpesviruses. We were able to locate a previous study by Plummer and Lewis [21] that examined the suspension heat inactivation of HSV-1 and another human herpesvirus, cytomegalovirus. As this report included sufficient detail and an experimental design allowing for calculations of D values from at least three different temperatures, it was possible to calculate power function coefficients from each study and therefore to create a plot comparing directly the D vs. temperature relationships (Figure 5). Note that the plot in Figure 5 does not display the temperatures actually tested empirically in Plummer and Lewis [15], rather it displays the D values at 46, 56, and 65°C calculated from the power function coefficients and Eq. 2. The greatest experimental error, and therefore the highest level of variability, is associated with the D values calculated for the lower temperature (46°C). The plots are qualitatively similar in appearance and each study demonstrates rapid inactivation of the herpesviruses at 65°C [Figure 5].
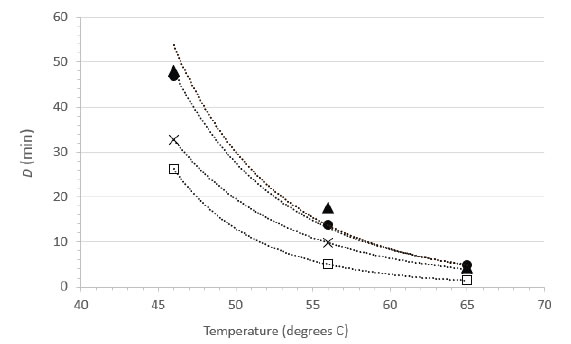
Figure 5. Relationship between D and temperature for herpesvirus inactivation in suspension. Data from the current study for HSV-1 (●, RPMI; ▲, NCS) are compared with suspension inactivation data from the literature (×, HSV-1 data from Plummer and Lewis [21]; □, cytomegalovirus data from Plummer and Lewis [21]).
Discussion
Prevailing opinion is that viruses are less susceptible to heating when dried on surfaces than when suspended in solutions, and that dry heat efficacy is related to residual moisture or relative humidity [22-26]. As mentioned previously, there are only relatively few studies [8, 25] that have actually evaluated thermal inactivation on surfaces and in suspension in a side-by-side study design. There are a number of factors that can determine thermal inactivation efficacy, such as presence of an organic load, the specific virus tested, the specific times and temperatures evaluated, and the methodology used for quenching the heating and recovering the infectious virus. A side-by-side study design is useful for eliminating as many confounding factors as possible, thereby enabling a more accurate comparison of inactivation ion surfaces vs. in suspension.Bräuniger et al. [25] examined the inactivation of bovine parvovirus in suspension vs. in the lyophilized state (the authors referred to this as dry heating). Thermal inactivation of a powder of varying moisture content is not exactly the same as the thermal inactivation of virus dried upon a hard surface. The authors reported that the parvovirus was more readily inactivated in suspension than in the lyophilized state with higher residual moisture (2%), while longer heating times were required for inactivation of the virus in lyophilized materials with lower moisture content (1%). In our own studies [8] with poliovirus type 1 and adenovirus type 5, the D values measured at 46°C displayed the greatest difference between the surface and suspension inactivation approaches, with values ranging from 14.0-15.2 minutes (surface) and from 47.4 -64.1 minutes (suspension) for poliovirus. The corresponding values for adenovirus 5 were 18.2-29.2 minutes (surface) and 20.8-38.3 minutes (suspension). At 65°C, the decimal reduction values were more similar (4 to 6 minutes) for the two inactivation approaches. The results with poliovirus and adenovirus [8] suggest that the specific virus under test is a determinant of the steepness of the D vs. temperature curve. This is supported by the results in our present study, where FeCV displayed markedly longer D values at 46°C in suspension inactivation vs. surface inactivation. The differences between D values at 46°C for HSV-1 inactivated on surfaces vs. in suspension were not as striking.
What exactly determines the shape of the D vs. temperature curve? It is apparent from studying the thermal inactivation data for a broad variety of viruses reported by a variety of investigators (reviewed in [5]) that in all cases, the plot of D vs. temperature has the appearance shown in Figures 2-5. Specifically, the data points typically are fit very closely using the power function displayed in Eq. 2). The D vs. temperature relationship is merely a transformation of the log10D vs. temperature relationship which has been used historically in calculating the z value (°C per log10 change in D). It is not surprising, therefore, that deviations from linearity for log10D vs. temperature plotsfrom a given study are associated with poorer power function fits for the D vs. temperature curves generated from the same inactivation results. In either case, it is the experimental error associated with the inactivation (log reduction) measurements and the subsequent error associated with the calculated D values which causes the deviations from expected line fit. The steep portion of the D vs. temperature curve that is observed at the lower temperatures evaluated for a virus is associated with the greatest degree of experimental variability, as shown in Figures 3 and 5. A flattening out of the curve is typically observed at higher temperatures. From a mechanism of inactivation point of view, we have proposed previously [8] that the steep portion of the curve may represent reaching a threshold temperature required for capsid opening. Once this threshold temperature has been reached, relatively small incremental increases in temperature result in dramatic decreases in the time required for 1 log10 inactivation. Differences between surface and suspension heat inactivation of viruses observed at the lower end of the D vs. temperature plot might then correspond to differences in extent or kinetics of heat exchange between the two inactivation approaches.
Conclusion
In the case of thermal inactivation of viruses, the results of suspension inactivation studies should be extrapolated to inactivation of viruses on surfaces with caution. It is not clear which approach represents the worst-case condition, and the more that we study surface vs. suspension heat inactivation in side-by-side studies, the more apparent it is becoming that generalities should not be made. Differences in the specific virus tested, in the presentation of the virus to the heat, in organic matrices which may or may not offer protection to the viruses, and in diffusion of the thermal energy through the liquid or virus film may impact the results. Such differences may favor inactivation in one or the other of the suspension or carrier formats.
References
- Pirtle EC, Beran GW (1991) Virus survival in the environment. Rev Sci Tech Off Int Epiz 10: 733-748.(Crossref)
- Tomasula PM, Kozemple MF, Konstance RP, Gregg D, Boettcher S, et al. (2007) Thermal inactivation of foot-and-mouth disease virus in milk using high-temperature, short-time pasteurization. J Dairy Sci90: 3202-3211.(Crossref)
- Thomas PR, Karriker LA, Ramirez A, Zhang JQ, Ellingson JS, et al. (2015) Evaluation of time and temperature sufficient to inactivate porcine epidemic diarrhea virus in swine feces on metal surfaces. J Swine Health Prod 23: 84-90.
- Zentkovich MM, Nelson SW, Stull JW, Nolting JM, Bowman AS (2016) Inactivation of porcine epidemic diarrhea virus using heated water. Vet Anim Sci1-2: 1-3.
- Nims RW, Plavsic M (2013) Intra-family and inter-family comparisons for viral susceptibility to heat inactivation. J Microb Biochem Technol5: 136-141.
- Quist-Rybachuk GV, Nauwynck HJ, Kalmar ID (2015) Sensitivity of porcine epidemic diarrhea virus (PEDV) to pH and heat treatment in the presence or absence of porcine plasma. Vet Microbiol181: 283-288.(Crossref)
- Nims R, Plavsic M (2013) A proposed modeling approach for comparing the heat inactivation susceptibility of viruses. Bioprocess J 12: 25-35.
- Zhou SS, Wilde C, Chen Z, Kapes T, Purgill J, et al. (2018) Carrier and liquid heat inactivation of poliovirus and adenovirus. Disinfection. InTech. doi:10.5772/ intechopen.76340
- Nims R, Plavsic M (2013) Inactivation of caliciviruses. Pharmaceuticals6: 358-392.(Crossref)
- Woźniakowski G, Samorek-Salamonowicz E (2015) Animal herpesviruses and their zoonotic potential for cross-species infection. Ann Agric Environ Med 22: 191-194.(Crossref)
- ASTM E1053. Test method to assess virucidal activity of chemicals intended for disinfection of inanimate, nonporous environmental surfaces.
- ASTM E1052. Standard test method to assess the activity of microbicides against viruses in suspension.
- Finney DJ (1964) Statistical Methods in Biological Assay. (2ndedn), London: Griffen.
- United States Pharmacopeia (2016)<1050.1>Design, Evaluation, and Characterization of Viral Clearance Procedures.
- Duizer E, Bijkerk P, Rockx B, de Groot A, Twisk F, et al. (2004) Inactivation of caliciviruses. Appl Environ Microbiol 70: 4538-4543.(Crossref)
- Cannon JL, Papafragkou E, Park GW, Osborne J, Jaykus L-A, et al. (2006) Surrogates for the study of norovirus stability and inactivation in the environment: A comparison of murine norovirus and feline calicivirus. J Food Prot69: 2761-2765.(Crossref)
- Buckow R, Isbarn S, Knorr D, Heinz V, Lehmacher A (2008) Predictive model for inactivation of feline calicivirus, a norovirus surrogate, by heat and high hydrostatic pressure. Appl Environ Microbiol 74: 1030-1038.(Crossref)
- Gibson KE, Schwab KJ (2011) Thermal inactivation of human norovirus surrogates. Food Environ Virol3 : 74-77.
- Bozkurt H, D’Souza D, Davidson PM (2013) Determination of the thermal inactivation kinetics of the human norovirus surrogates, murine norovirus and feline calicivirus. J Food Prot76: 79-84.(Crossref)
- Bozkurt H, D’Souza DH, Davidson PM (2014) A comparison of the thermal inactivation kinetics of human norovirus surrogates and hepatitis A virus in buffered cell culture medium. Food Microbiol4: 212-217.(Crossref)
- Plummer G, Lewis B (1965) Thermoinactivation of herpes simplex virus and cytomegalovirus. J Bacteriol 89: 671-674.(Crossref)
- McDevitt J, Rudnick S, First M, Spengler J (2010) Role of absolute humidity in the inactivation of influenza viruses on stainless steel surfaces at elevated temperatures. Appl Environ Microbiol76: 3943-3947.(Crossref)
- Sauerbrei A, Wutzler P (2009) Testing thermal resistance of viruses. Arch Virol154: 115-119.(Crossref)
- Dekker A (1998) Inactivation of foot-and-mouth disease virus by heat, formaldehyde, ethylene oxide and ϒ-irradiation. Vet Rec 143: 168-169. (Crossref)
- Bräuniger S, Peters S, Borchers U, Kao M (2000) Further studies on thermal resistance of bovine parvovirus against moist and dry heat. Int J Hyg Environ Health 203: 71-75. (Crossref)
- von Rheinbaben F, Wolff MH (2002)Virus Disinfection Manual. (Pg: 1-499) Springer Berlin Heidelberg,Heidelberg, Germany.
- Boschetti N, Wyss K, Mischler A, Hostettler T, Kemph C (2003) Stability of minute virus of mice against temperature and sodium hydroxide. Biologicals31: 181-185.(Crossref)