Abstract
In two separate experiments, groups of 50 respondents evaluated vignettes comprising systematically varied combinations of elements, experiment 1 dealing with the content of magazines, experiment 2 dealing with the features of an e-book reader. The vignettes were evaluated on 9-point Likert scales. Equations relating the presence or absence of the 36 elements in each experiment revealed unusually high coefficients. Clustering the patterns of coefficients revealed two mind-sets for the magazine contents, three mind-sets for the e-book reader. The mind-sets were not diametrically opposite, in the way the clustering would show for most products. Rather, the mind-sets suggested different patterns of preference, instead of preference/rejection. The argument is made that for many products with positive features, mind-set segmentation will reveal groups differing in the order of preference, with most features liked, rather than revealing the more typical finding that the mind-sets exhibit strong and opposite patterns of acceptance/rejection.
Introduction
The 21st century abounds in media, formerly just printed and broadcast, now electronic. Over the past decades readers have been introduced to the benefits of e-readers, virtually small computers created for the presentation of written material of many sorts, from books presented as searchable files, to pictures, presentations, to audio books, and the like. At the same time, the 21st century abounds in the printed word, on traditional media, such as newspapers, magazines, books, and so forth.
The focus of the two studies reported here was on the response to magazines (study #1), and to e-book readers (study #2), from the point of view of first- and second-year college students entering the world of higher education. The idea was to find out what features they thought would be relevant to people, and in turn, how people felt about combinations of these features in small vignettes (descriptions of offerings) and evaluated by respondents.
The academic literature as well as the business literature focuses on who reads magazines [1] and who uses e-book readers and the reasons [2-6]. The studies on media give one a sense of looking from the outside in, from the point of view of a third-party observer trying to make sense of a situation and reporting on the various features of situation. The observer is describing what she or he sees, and the potential organizing patterns which might be emerging, based what is observed, and the intuition of the observer. There is a sense of the ‘inside of the mind’, but not a feeling of immediacy, the type of immediacy when one reads a description of a product or service, and feels an excitement, a sense of ‘that’s just what I want.’
Rationales for the Two Studies Reported Here
The original studies were conducted as part of a set of studies at Queens College, (CUNY, NY), by students turned experimenters. The focus was on exploring the world of the everyday. One remarkable event emerged from the two studies. The study magazines were perceived by many of the respondents as fairly boring. Many of the elements were simply uninteresting, and in fact 22 of the respondents did not end up liking anything in that was being offered. In contrast, all the elements in the e book reader were considered interesting. Thus, it was of interest to compare the two.
The Mind Genomics process makes what was a typical questionnaire into an experiment. The questionnaire and the experiment both try to uncover what respondents feel to be important. The questionnaire works by presenting the respondent with a single set of stimuli, messages or elements presenting different ideas, and analyzing the ratings. The stimuli may be of the same type, presenting alternatives of a single idea, or the stimuli may be of entirely different categories of messages. In contrast, Mind Genomics can be said to an experiment in which the respondent rates combinations of messages, simulating a typical reality [7-9].
The approach is illustrated by a series of steps, each step comparing the two studies.
Step 1: Select the Topic, the Questions, and the Answers (elements)
Mind Genomics works with the experience of the everyday. It is critical, therefore, to select a delimited topic, and create a story framed by questions, in the manner that a story might be related by a person. The questions provide the structure to move the story forward. The story need not be the type of story with a plot. Rather, the story merely needs to provide a set of smaller ‘sub-topics’, aspects of the main topic, but aspects that can be dealt with by simple stand-alone phrases which ‘describe.’ The topic will be introduced to the respondent, so the respondent knows to what the test stimuli pertain. Th questions are never shown to the respondent, but simply serve as an aid to creating the answers, the elements, which will be shown to the respondent in test combinations.
Table 1A shows the structure of topic, questions, and answers for the magazine, something with which people were very familiar at the time of the study, in 2012. The topic was particularized to a subscription to the magazine, rather than interest in general in the magazine. The elements would be looked at in the light of a call to action, to subscribe or not to subscribe to the magazine.
Table 1A: Questions and answers (elements) for the magazine
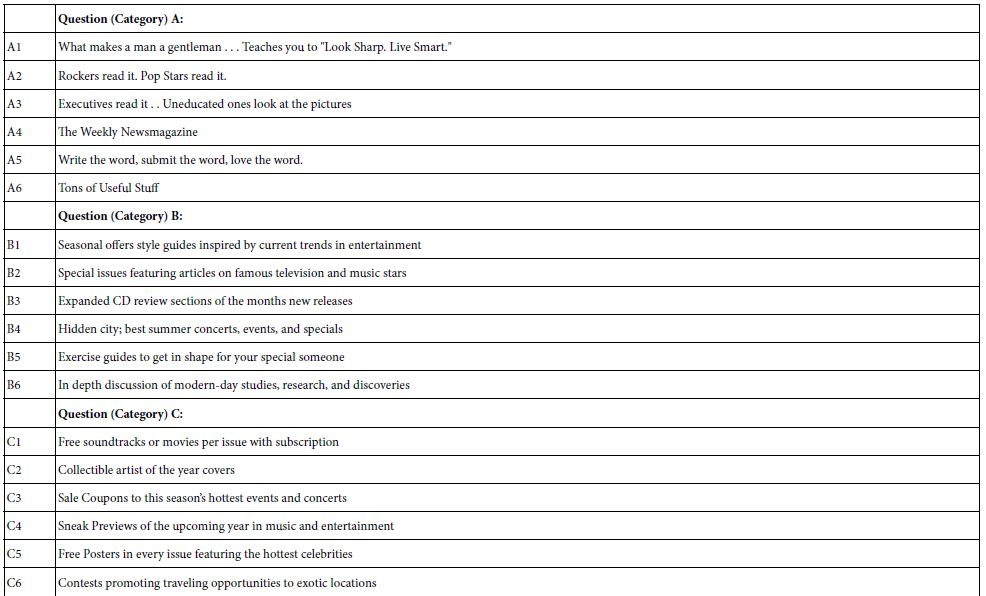
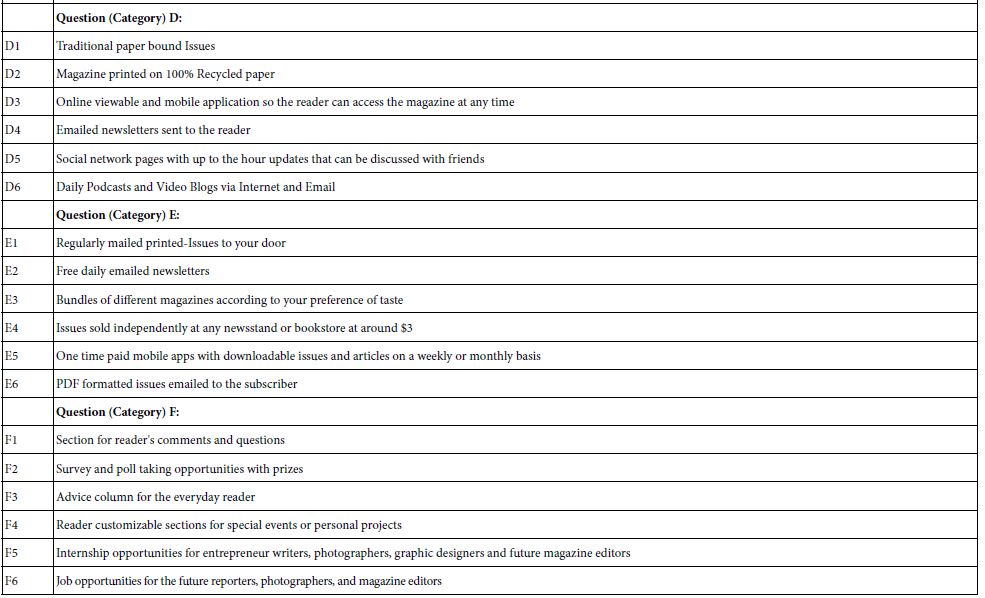
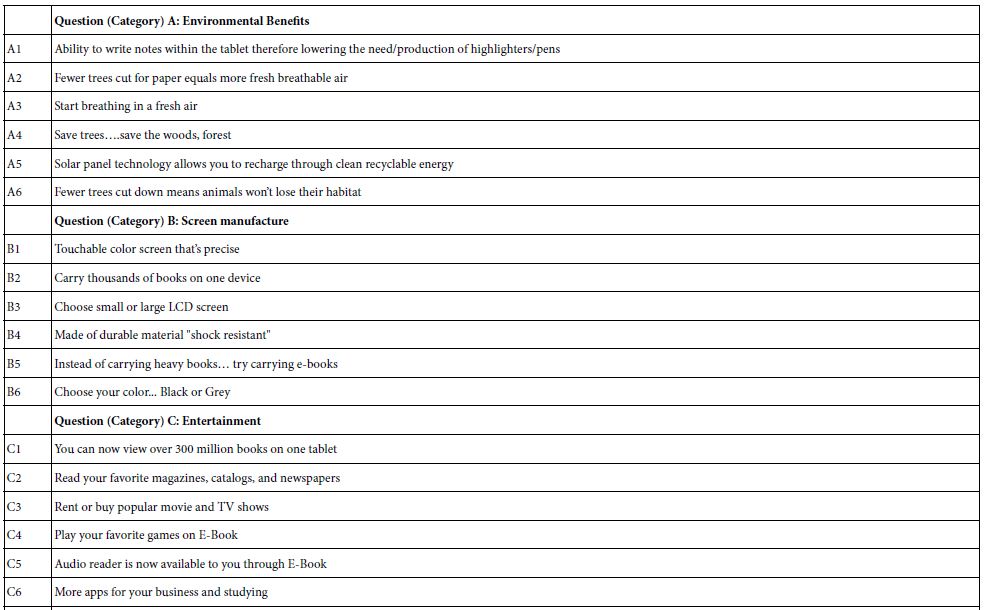
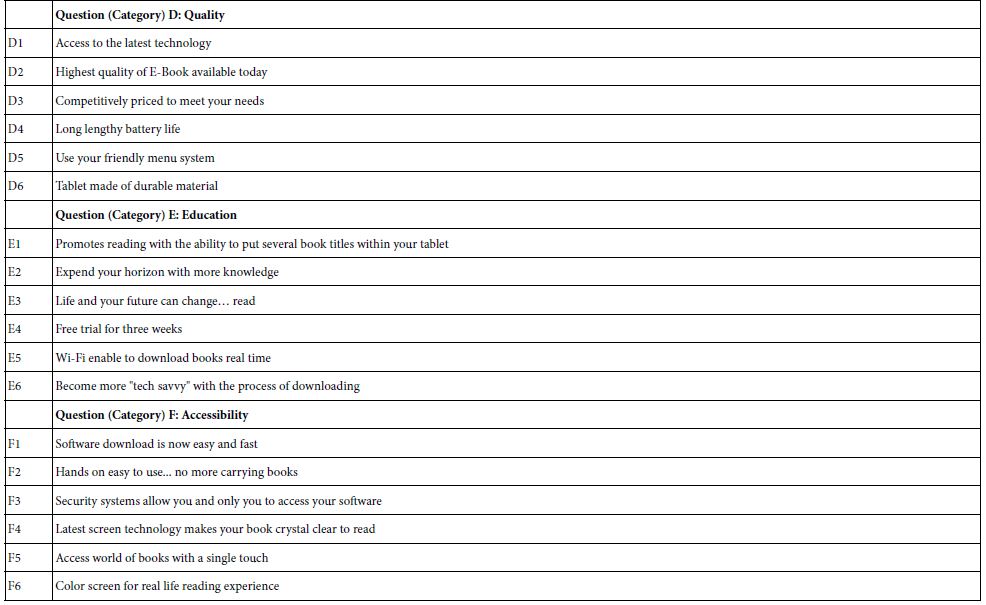
Table 1B shows the structure of topic, questions, and answers for the E-reader. At the time of the study, E-readers were coming into vogue. Amazon had introduced the Amazon Kindle series, E-book readers, so the product idea was becoming better known. Technology was evolving quickly. The focus of the study was features and capabilities of the product.
Table 1B: Questions and answers (elements) for the E-Book Reader.
Allowing people to collaborate, especially students who are as yet unfettered by the cynicism of adults, generates ideas which run the gamut. The elements shown in Tables 1A and 1B emerged from students, not from professional copyrighters, not from professional ‘creatives’ whose job it is to come up with winning ideas. The Mind Genomics system encourages the exploration of new ideas, often ideas in the mind of young people. It will be interesting to measure how well these ideas perform. they are certainly different from many of the tried-and-true ideas proffered as the output of professionally moderated creative session. The performance will be measured empirically below
Step 2: Combine the Elements into Short, Easy to Read Vignettes, Using Experimental Design
Mind Traditional efforts to teach the ‘scientific method’ are founded on the belief that a variable must be isolated, and studied, but only after all of the possible variation, the ‘noise’ around the variable has been eliminated, either by suppressing the noise (testing the element by itself i the simplest form), and/or by averaging out the noise (e.g., testing with dozens or even hundreds of people, so that the individual variation averages out).
Mind Genomics was founded on the basic tenet judgment data of real-world stimuli should be done in a way which best resembles the real world, namely mixtures.,,, namely identify the variables to be tested, combine them in a way which resembles th type of compound stimulus which one encounters in nature. By combining the different elements in structured way, using an experimental design, which mixes and matches the different independent variable, one presents the respondents with more realistic test stimuli. We encounter mixtures all the time and react to them. Thus, the mixtures tested by the respondents are more similar to what the person would face. The key difference is that the experimental design permits the research to deconstruct the reaction to this ‘combination’ into the contributions of the components, the variables of interest.
The requirements for a Mind Genomics experimental design are that the elements should appear equally often, that the vignettes be ‘incomplete’ (viz., some vignettes are absent elements or answers from a question), that the elements be statistically independent of each other, and the experimental design be valid down to a base size of one respondent. Finally, the experimental design be permutable, so that by permuting elements or answers in a single question new combinations emerge, based upon the same design structure [10].
It is important to note that with the foregoing approach, each respondent evaluates a different set of 48 vignettes, prescribed by the underlying experimental design (called the 6×6 design; six questions, six answers or elements per question). With 50 or so respondents, there are 50×48 or 2400 vignettes evaluated by the respondents, most of which are different from each other. In that way the Mind Genomics system is metaphorically like the MRI machine, which takes pictures of the same tissue from different angles and combines these pictures by computer to arrive at a single 3-dimensional image of the underlying tissue.
The output of the experimental design appears in Figure 1A, showing a vignette for the magazine, and Figure 1B showing a vignette for the e-book reader.
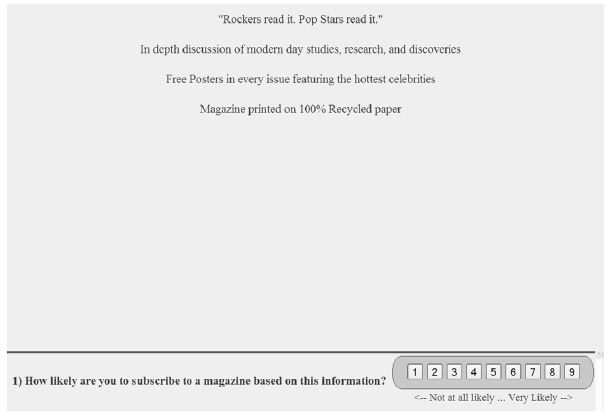
Figure 1A: Example of a four-element vignette for the magazine study
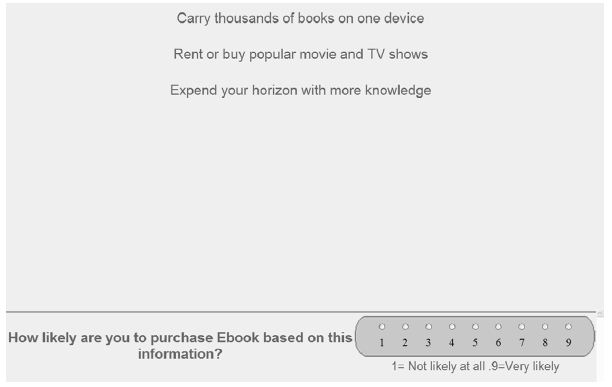
Figure 1B: Example of a 3-element vignette for the e-book reader
Step 3: Execute the Mind Genomics Study on the Internet
Beginning in the late 1990’s, a great deal of consumer research migrated to the web, to the internet. Companies found that the data generated by web-based interviews seemed to be just as valid as data generated by in-person interviews and mailed-out paper questionnaires. Establishing web-interviews as a valid way, and indeed far less expensive way, to obtain data gave a boost to interviews which need technology embedded in their backbone. Min Genomics is one of the approaches which proposed, because each respondent was to evaluate a unique set of elements. The only practical way was to have a computer combine the elements in ‘real time’, following the underlying 3expeirmental design. The process became streamlined over time. The respondent would log in, following a link, be presented with an orientation screen, and then a set of systematically varied combinations, created ‘in real time’, at the site of the respondent’s computer.
Figure 2A shows the orientation screen for the magazine study, Figure 2B shows the orientation screen for the e-reader study. The respondents were recruited by an online panel provider, Turk Prime, Inc. which provided respondents in the United States. The compensation to the respondents was set by Turk Prime, Inc. as part of their internal policies. These policies as well as the identification of the respondents, were not available through the service. The only guarantee was that the respondents were vetted by Open Venue Ltd., part of their panel.
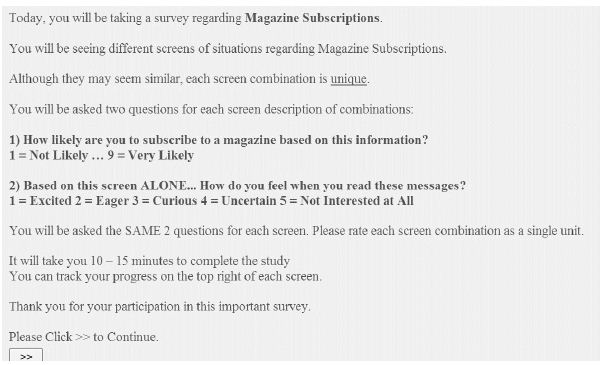
Figure 2A: Orientation for the magazine study
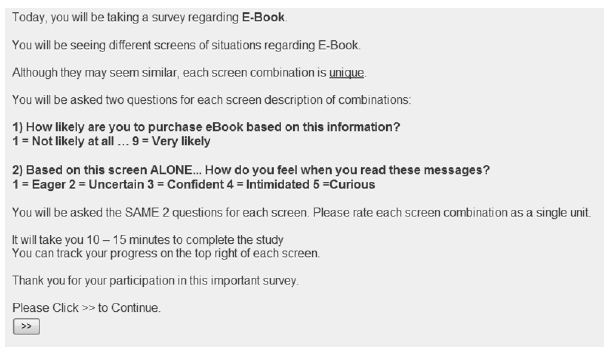
Figure 2B: Orientation screen for the e-reader study
Figures 2A and 2B show the orientation screen. Very little information is given regarding the purpose of the study, and the rationale for selecting the elements. Just the topic is given. The rest of the screen provides information about the number of question (two), and the type (scalar, Likert Scale for Question 1, presented here; selection of emotion for each vignette, not presented here).
The orientation screen goes out of its way to reassure the respondent that all the screens are different from each other, and that the study will take 10-15 minutes. These two reassurances were put in after the early experience on the Internet, when respondents kept saying upon exist that the concepts they evaluated seemed to have many repeats (not possible with the design), and that they wanted to know how long the interview would be. Rather than giving a precise time, it was deemed better to give them a reasonable range of 10-15 minutes. Most respondents finished earlier.
Observations of respondents doing these types of studies in a central location revealed that the respondents often begin by trying to ‘outsmart’ the research, trying to figure out the appropriate answer. With single elements rated, this outsmarting or gaming the system is possible. With 48 different combinations, however, it is impossible for the respondent to game the system. The respondent may begin with an effort to outsmart the system, but almost universally the respondent relaxes, and simply answers in what the respondent feels is an uninterest way, barely paying attention. That tis precisely the right state for the respondent, because in that state the answers come from the heart, without being edited to be politically correct.
Step 4 – Acquire the Data and Prepare It for Analysis
Each respondent evaluated 48 difeferent vignettes, consturcted according to an experimental deesign. The respondent first rated the vignette in terms of interest using a 9-point category or Likert Scale (subscribe fo the magazine, purchase for the e-book reader). The respondent then ratedthe vignette in terms of emotion experience after reading the vignette. Those data are not presented here.
The foundations of Mind Genomics lie in the fields of experimental psychology, consumer research, and statisitics, respectively. Experimental psychologists do not usually convert the data from the Likert Scales, preferring the granularity, which allows statistical analysis to uncover more statically significant effects using tests of difference. In contrast,, users of Mind Genomics data, typically managers want to use the data for decision making (e.g., use/not use; go/don’t go). It is important for them to interpret the data to make their decision. All too often, the manager presented with averages across people from a projecting using Likert Scalesw will begin the interaction by asking a question like ‘what does a 6.9 average on the rating scale ‘mean’, and what should i do?’
The tradition in consumer research and in Mind Genomics, followed here, transforms the Likert sale to a two point scale, 0 and 1 or 0 and 100, repectively. They two transformed scales, 0-1, 0-100, are different expessions of the same data, but present the data either with decimals (0-1), or without decimals (0-100), We chose the 0/100 tranfomration, Ratings of 1-6 were coded 0, ratings of 7-9 were coded 100, and a vanishingly small random number (<10–5) was added to make sure the transformed rating would always have variation acfrosss the 48 vignettes for a single respondent. This prophylatic measure ensure that one could use regression modeling at the level of the individual respondent, even in those cases when the respondent confined the ratings to one region, viz., 1-6 or 7-9 respectively.
Step 5 – Create Individual Level Models, through Regression, Relating the Presence/Absence of the Elements to the Transformed Response
It is at Step 5 that the real analysis begins, an analysis which is virtually mechanical in nature, yet which repeatedly shows how the consumer mind makes decisions. The data were prepared in at Step 4. Step 5 uses OLS (ordinary least squares) multiple regression to relate the presence/absence of the 36 elements to the transformed rating. The equation is expressed as:
Binary Transformed Rating = k0 + k1(A1) + k2(A2)….k36(F6)
For those respondents whose ratings were all between 1 and 6, the coefficients were all near 0 an the additive constant was around 0 as well. For those respondents whose rating whose ratings were all between 7 and 9, the coefficients again were all near 0, and the addiive consatn was around 100. Out of 52 respondents, 22 respondent showed this pattern for magazine, none showed this pattern for e-book reader. The data from these 22 respondents were eliminated from the database, leaving only respondents who showed variation in their transformed binary response.
Step 6 – Cluster the Respondents into Either Two Groups (Magazine) or Three Groups (e-Book Reader)
Step 6 attempts to divide the respondents in a study into clusters, doing so that the the respondents in a clusters are ‘similar’ to each other, while at the same time the pattern of the 36 averages of the coefficients are very different between two clusters or very different across three clsuters. The process can be done very easily using k-means clustering [11]. The clustering program returns with the assignment of each respondent to exactly one of the two clusters (for magazines), or one of the three clusters (for e-book readers). Afterwards, run one equation for all the respondents in a study, and two separate equations for all respondents in each of the two mind-sets (magazine), three separate eqations for all respondents in each of the three mind-sets (e-book reader).
The clustering procedures are mathematics-based, attempting to bring some definable order into what might otherwise be a blooming, buzzing confusion, in the words of noted Harvard psychologist, William James. The clusters themselves do not have any concrete reality, but simply represent intuitively reasonable ways to divide objects. Clustering can be done on anything, as long as the measure(s) are comparable across the different objects.
When we look at the clusters, recognizing that we are dealing with a mathematically based system, our judgment should be based on at least two criteria. The first criterion is parsimony. We know that we will get perfect clustering if each of our respondents becomes her or his own cluster. That would defeat the purpose. The idea is to create as few clusters as possible, to be as parsimonius as possible, even at the cost of some ‘noise’ in the system which makes the clustering far less than perfect. Thus, the first rule is the fewer the number of clusters, the better. The second criterion is interpretability, that the clusters should each tell a story. One may want the story to be tight, meaning more clusters, and less parsimony. Or one may allow the story to be less tight, with more open issues, but with more parsimony, viz., fewer clusters. It is always a trade-off; more parsimony versus more interpretability. There is no right answer. In this study, the effort will be towards parsimony, given the range of possible elements that can fit either in a magazine or an e-book reader [12].
One last issues remains to be mentioned. That issue the nature of the variables (elements) considered in the clustering. The traditional approach in Mind Genomics has been to use the coefficients of all of the elements, but not to use the additive constant. There is always the potential that the clustering might be unduly affected by the nature of the elements selected. With 36 elements, one would hope that the elements deal with different aspects in equal ways. But what happens, for example, if most of the elements deal with usage, and only a few elements deal with product features? Would that generate the same clusters were the elements to be configured differently, with only a few elements dealing with usage, and most elements dealing with product features? In other words, is the mind-set segmentation affected by the distribution of the topics dealt with in the study?
To answer the foregoing question, the nature of the variables used in clustering, each study was analyzed twice, AFTER the respondents with all coefficients around the value 0 were eliminated from the data. The first clustering was done with the original 36 coefficients. Both studies comprised featured six sets of six elements each, so the clustering was similar.
The second analysis reduced the dimensionality of the 36 elements using principal components factor analysis [13]. Even though the 36 elements were statistically independent of each other by design, the pattern of 36 cofficients shows substantial co-variations, simply because the elements were similar, generated similar patterns. The PCA isolated eight factors for the magazine subscription, and 15 factors for the e-book reader. The nature of the factors is not important. Rather, the factors are statistically independent of each other. The factors were rotated by Quartimax to make the data matrix as simple as possible. Each respondent was then located in the 8-dimensional factor space for the magazine, or the 15-dimensional factor space for the e-book reader. After the factor spaces were creatd, the clustering was done again, with two mind-sets extracted for the magazine
Step 7: Interpreting the Results – Magazine
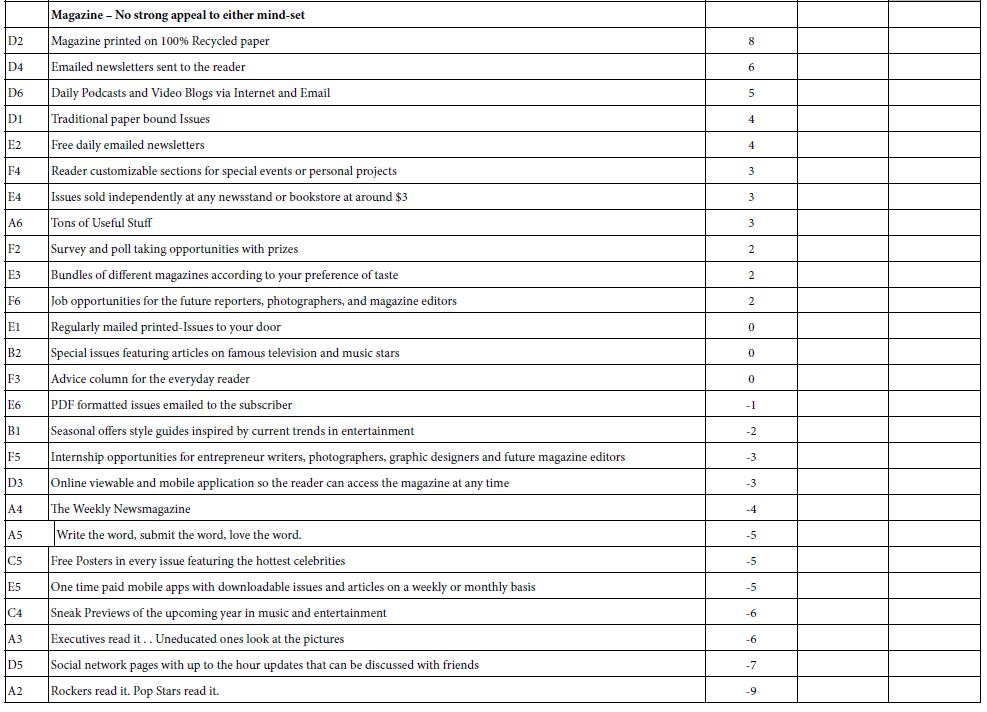
Table 2A shows the results for the magazine based upon the clustering into two groups. Three groups did not produce any clearer result. The “Total Panel” data shows all coeficients, positive and negative. For these results, we show only the very strong positive coefficients, 15 or higher.
Table 2A: Coefficients for the magazine, for total and two mind-sets, based on using all 36 elements for clustering.
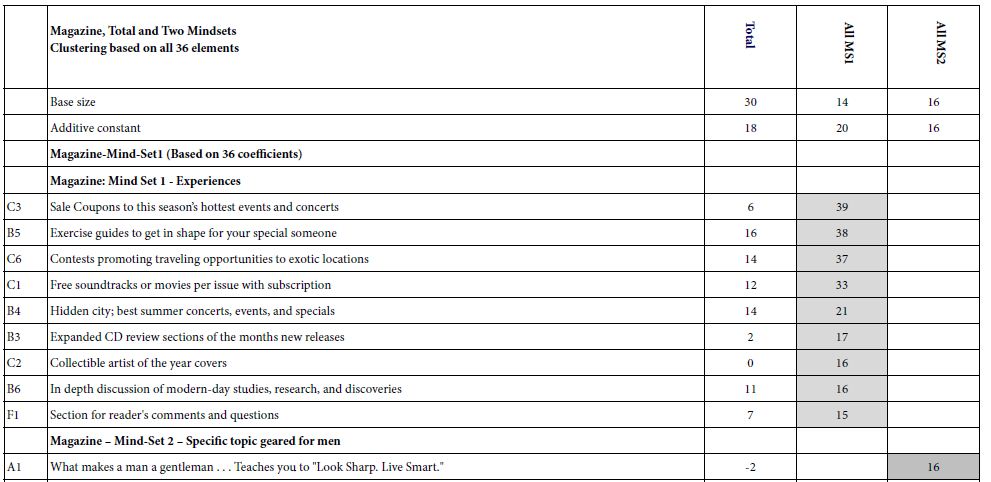
The three groups, Total, Mind-Set 1 and Mind-Set 2 generate similar, low values for the additive constant, 16-20. The additive constant is the conditional probability of a person wanting to subscribe to the magazine in the absence of elements. The underlying experimental design ensured that each vignette would comprise 3-4 elements, never zero elements. The additive constant is a convenient parameter, estimating the intercept, the likely score in terms of ‘top 3’ that would be obtained in the impossible case of a vignette with no elements.
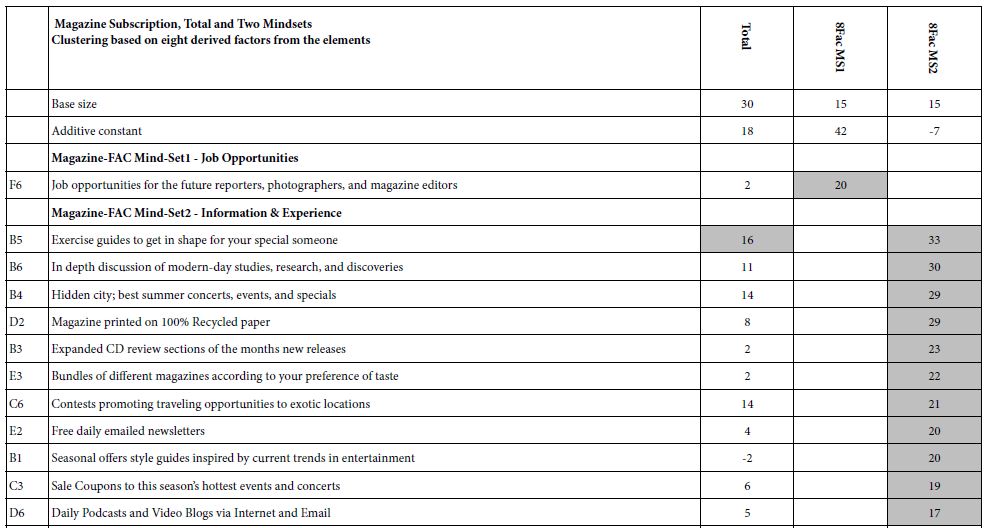
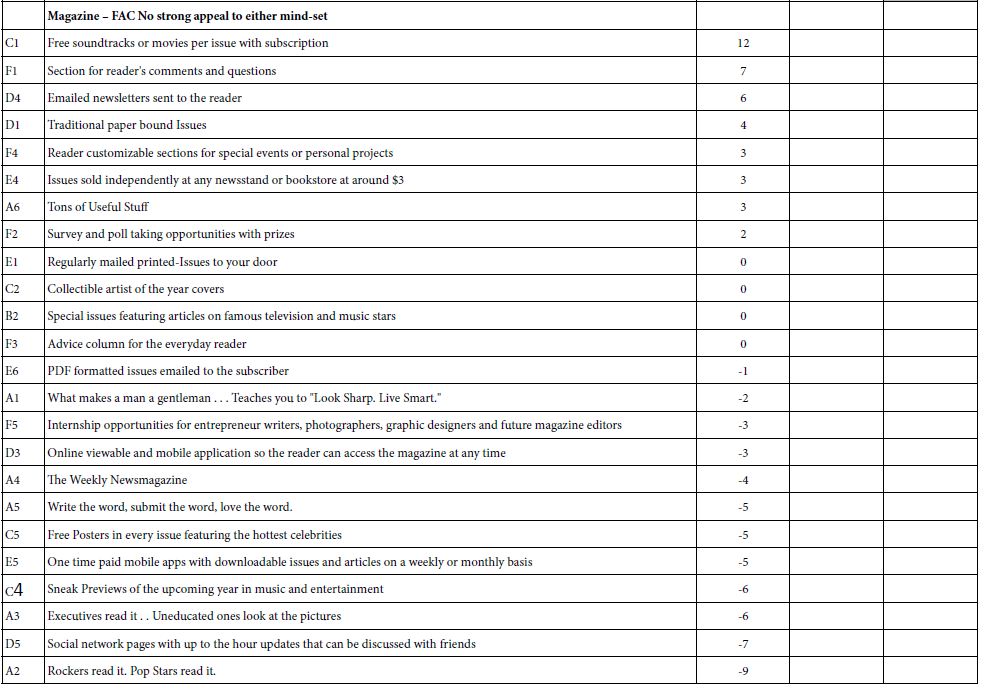
Table 2B shows the same type of analysis, this time based on the factors of the respondents on eight independent factors (dimensions), rather than on 36 elements.Comparing the two types of segmentation, first based on all 36 elements and the second based on the elements after factor analysis, it is clear the the clustering generates clearer results when the original data is used, confirming the insights of others focused on thepractical uses, opportunities, and pitfalls encountred in clustering [14,15]. In reality, Table 2A, based on all 36 elements, suggests one major mind-set, those interested in experiences. The other mind-set barely enters the picture, only with one element, which scores near the bottom cutoff. Table 2B shows the same pattern as well [16].
Table 2B: Coefficients for the magazine, for total and two mind-sets, based on using all eight factors for clustering, factors derived from the 36 elements.
The final notworthy finding in this study of magazine content is the unusually large number of very strong elements, nine of thirty-six, one quarter, having coefficients of +15 or higher. This is an unusual finding, and may well be attributed to the creative abilities of younger people, ages 17-23, focusing on what is important to them. What is important is the specific, the concrete, the focused feature, not the grand abstraction that a marketer or ‘creative’ in an agency would propose as a coherent, summarizing theme. The responents want specifics.
Step 8: Interpreting the Results – E-Book Readers
Table 3A shows the results for the E-book reader based upon the clustering into three groups. Unlike the findings for the magazine, the three mind-sets for the E-Book Reader made sense. Once again we see low additive constants. When we divide the respondents into mind-sets based either upon the original 36 elements or upon the 15 factors emerging, we see two very low additive constants, and low additive constant around 27.
Table 3A: Coefficients for the magazine, for total and three mind-sets, based on using all 36 elements for clustering.
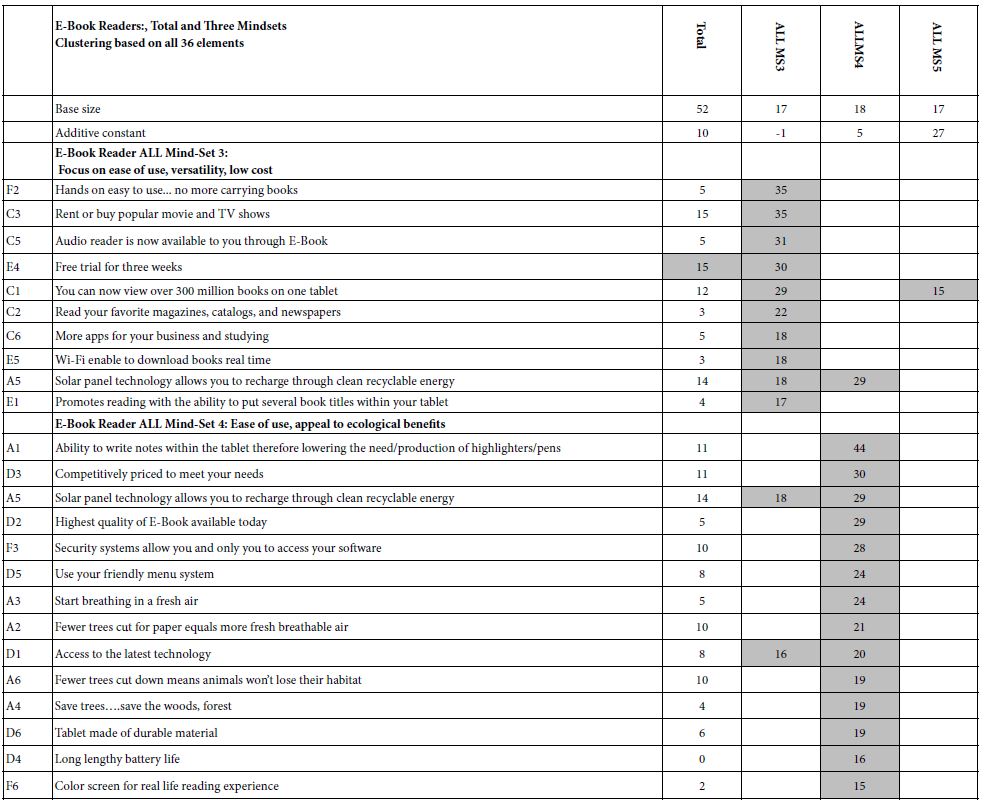
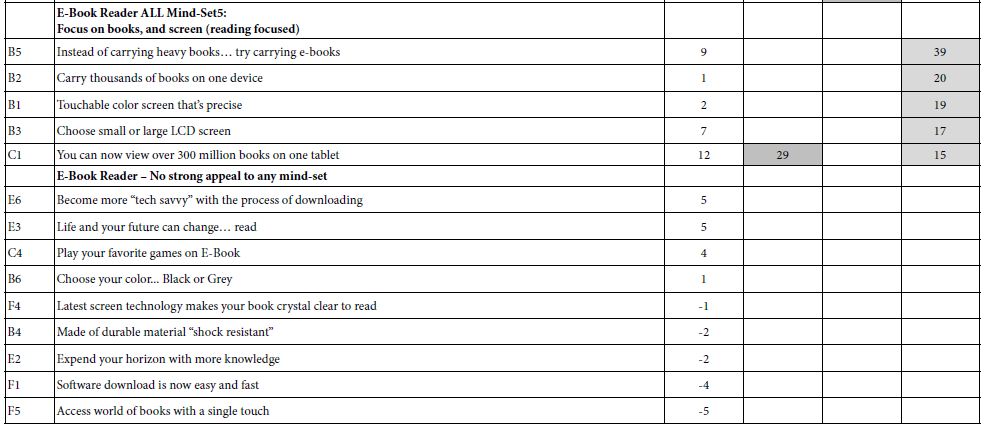
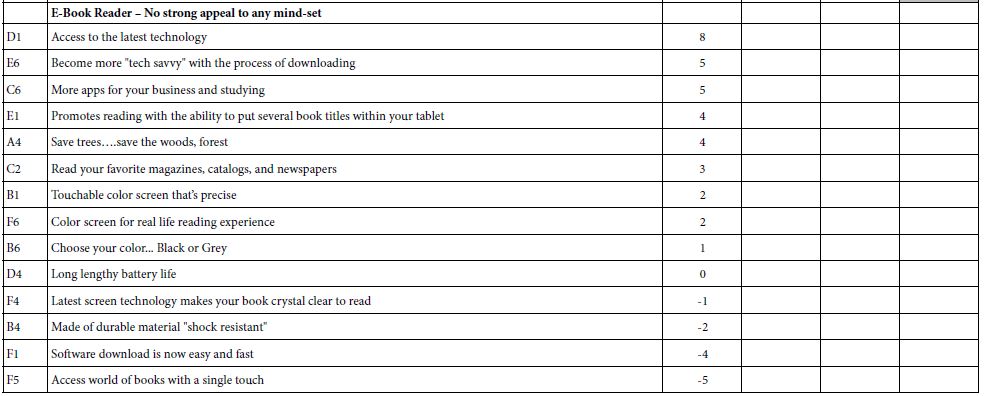
Table 3B: Coefficients for the magazine, for total and three mind-sets, based on using all 15 factors for clustering, factors derived from the 36 elements.
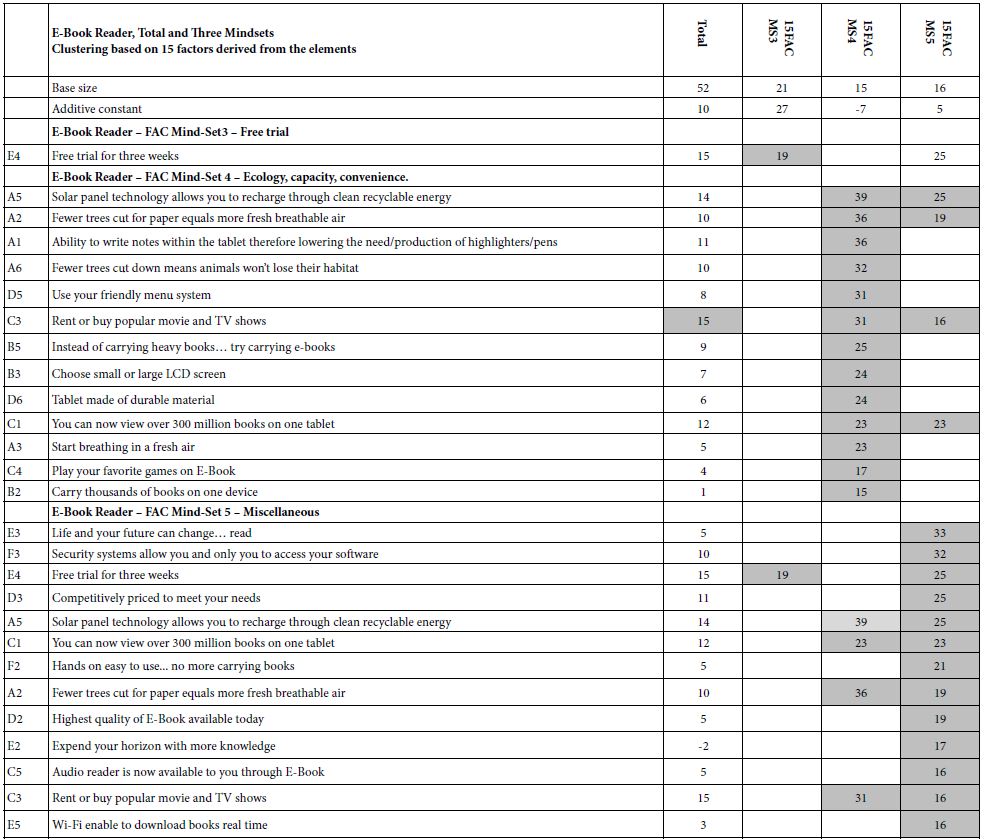
Like the results for magazines in Tables 2A and 2B, we find that some coefficients are quite high, some of the highest ever recorded for a Mind Genomics study. The hypothesis proferred in the previous section may still hold, viz., that having young, colleage-age students, create the elements is the secret to strong performing elements. It may be that the students think in a more concrete, feature-oriented way, a way which generates a great deal more interest than professional creatives who may think of ‘grand solutions’, rather than of specific features. It may also be that the topic of e-book readers is by its nature simply far more interesting, and au courant
Discussion and Conclusion
Why High Coefficients?
The most surprising outcome from these two studies is the emergence of elements with exceptionally high coefficients. The studies were run in 2012, a decade ago, but that does not provide an explanation for the strong positive coefficients. Hypotheses about in the absence of fact. We have only two examples. What are common about them is that the elements are provided by young people (ages 18-21) rather than by professionals, viz., the so-called highly paid ‘creatives’ in the marketing companies and advertising agencies. and the topics talk to presentations of information, capabilities given to the reader or the user That is, the elements are fundamentally ‘interesting’ to the reader, not just simply recitations of what is. There is a sense of ‘excitement’, perhaps because we are talking about items with clearly interesting, people-oriented features. There are no elements dealing with ‘good practices’, elements that might be necessary in an offering but elements which really do not convince.
The notion that the topic is interesting certainly has merit in the world of Mind Genomics. Most Mind Genomics studies deal with social or medical issues, issues that are not ‘interesting,’ nor issues that people would pay for. Social problem, medical problems are issues about which one gathers information. The elements in this study are used to excite a buyer to buy the product. There is no sense of elements put in because they are legally necessary, or for completeness as one of recommended best practices.
Polarized versus Non-polarized Mind-sets
As noted above, the unusually high coefficients emerging from the total panel for some elements , and the exceptionally high coefficients emerging several times from the separate mind-sets, suggest that we are dealing with a new type of preference pattern, not frequently seen in Mind Genomics, but one easy to recognize. We are dealing with what one might call the ‘pizza phenomenon’. Most people love pizza. It is the toppings which differentiate people. For most people it’s a matter of order of preference, which varies from person to person. The result is that the total panel generates strong liking of the pizza, with the differentiator being the rank order of preference of the topping. There are people who actively dislike certain toppings, but for the most part the mind-sets that would emerge from a study of pizza and those representing different rank orders of items already liked.
In contrast to the above, the pizza phenomenon, where the mind-sets are simply patterns of liking of the same elements, there are those situations where the person likes one element but hates another This pattern is very different from the pizza pattern. The pattern is more similar to the pattern of likes and dislikes of flavors. Flavors themselves strongly polarize people. Some people love a certain flavor, whereas others hate the flavor. One hears those words again and again.
Let’s move this analogizing to the topics of e-book readers and magazine subscriptions. For the most part the coefficients are positive. There are relatively few elements which are strongly negative. There are no moderately negative elements for the e-book reader. Here are the most negative elements for the magazine
C4 Sneak Previews of the upcoming year in music and entertainment -6
A3 Executives read it . . Uneducated ones look at the pictures -6
D5 Social network pages with up to the hour updates that can be discussed with friends -7
A2 Rockers read it. Pop Stars read it. -9
The patterns emerging for both the magazine (less so) and the e-book reader (more so) is that the creation of a product, especially one with electronic features (the e-book reader) is most likely to generate higher coefficients, than, for example a study on shopping for, using, or servicing the product.
Developing a Culture of Iteration
There is a culture in business which promotes experimentation, but does not prescribe what the experiment should be. The data presented here from students, rather than from experts, show a much greater ‘success’ in early stage experimentation. We see a great number of strong performing elements, yet many elements are still moderate performers. The results give hope that the number of strong positives can increase. With repeated efforts there should be more strong performing elements.
In business the process would be different. In most businesses the unspoken norm to ‘manage for appearances.’ That is, in business, people all too often manage each other, rather than managing for the best results. Bringing that observation to the world of Mind Genomics, the typical business approach would be to spend a long time preparing for the study, making sure that the elements are ‘just right’, and conducting the Mind Genomics experiment with several hundred people, to ensure that ‘the results are solid.’ This approach of ‘letting the perfect be the enemy of the good’ ends up generating one well-prepared Mind Genomics study. The effort is expended in the wrong way. The effort should be on iterating, with small Mind Genomics experiment, each with 50 respondents, each done in the space of no more than 24 hours. The study here, run by students, relative amateurs in the world of business, shows the power of ‘just doing it.
Appendix
The effort to create this system generated a patented approach (REF), available now world-wide, on an automated basis, for a reduced size (4 questions, 4 answers or elements). The system is essentially free, except for minor processing charges on a per respondent basis to defray the maintenance. The website is www.BimiLeap.com
References
- Witepski L (2006) When is a magazine not a magazine? Journal of Marketing 2: 34-37.
- Behler A, Lush B (2010) Are you ready for e-readers? The Reference Librarian 52: 75-87.
- Griffey J (2012) E-readers now, e-readers forever!. Library technology reports 43: 14-20.
- Massis BE (2010) E-book readers and college students. New Library World 111: 347-350.
- Thayer A, Lee CP, Hwang LH, Sales H, Sen P, et al. (2011) The imposition and superimposition of digital reading technology: the academic potential of e-readers. In Proceedings of the SIGCHI Conference on Human Factors in Computing Systems 29: 17-26.
- Williams MD, Slade EL, Dwivedi YK (2014) Consumers’ intentions to use e-readers. Journal of Computer Information Systems 54: 66-76.
- Milutinovic V, Salom J (2016) Introduction to basic concepts of Mind Genomics. In: Mind Genomics. Springer, Cham 1-29.
- Moskowitz H, Rappaport S, Moskowitz D, Porretta S, Velema B, et al. (2017) Product design for bread through mind genomics and cognitive economics. In: Developing New Functional Food and Nutraceutical Products. Academic Press 249-278.
- Moskowitz HR, Gofman A (2007) Selling Blue Elephants: How to Make Great Products that People Want Before They Know They Even Want Them. Pearson Education.
- Gofman A, Moskowitz H (2010) Isomorphic permuted experimental designs and their application in conjoint analysis. Journal of Sensory Studies 25: 127-145.
- Kanungo T, Mount DM, Netanyahu NS, Piatko CD, Silverman R, et al. (2002) An efficient k-means clustering algorithm: Analysis and implementation. IEEE Transactions on Pattern Analysis and Machine Intelligence 24: 881-892.
- Gere A, Moskowitz H (2021) Assigning people to empirically uncovered mind-sets: A new horizon to understand the minds and behaviors of people. In Consumer-based New Product Development for the Food Industry. Royal Society of Chemistry 132-149.
- Widaman KF (1993) Common factor analysis versus principal component analysis: Differential bias in representing model parameters?. Multivariate Behavioral Research 28: 263-311.
- Aldenderfer MS, Blashfield RK (1984) Cluster Analysis, Sage Publications, Beverly Hills, CA.
- Fiedler J, McDonald JJ (1993) Market figmentation: Clustering on factor scores versus individual variables. Paper Presented to the AMA Advanced Research Techniques Forum.
- Huhmann BA, Brotherton TP (1997) A content analysis of guilt appeals in popular magazine advertisements. Journal of Advertising 26: 35-45.