Abstract
Over the past 25 years of studying type 2 diabetes mellitus, a working hypothesis has emerged to move the development of precision medicine for type 2 diabetes mellitus forward. Earlier studies using amplified genomic DNAs for genomic-wide searches of human genes have led many investigators astray. However, a recent study has taken a different approach, using next-generation RNA sequencing, revealing an essential down-regulation of two genes, TPD52L3 and NKX2-1. The current compendium focuses on describing all of the important priciples to clarify the hypothesis from the beginning: insulin sensitivity and glucose effectiveness, genetics, free fatty acids, cell membranes, atomistic glucose and glucose transport, β-cell functions, membrane flexibility and (pre-) diabetes type 2.
Furthermore, this study sheds light on the importance of considering membrane flexibility in the context of type 2 diabetes and questions the potential risk associated with using the term ‘insulin resistance’.
Keywords
Type 2 diabetes mellitus; Insulin sensitivity; Glucose effectiveness; Genetics; Free fatty acid; Cell membrane; Glucose transport; β-cell function; membrane flexibility
Introduction
While Falta and Boller introduced the concept of “insulin resistance” in their seminal work published in 1931, it was not until 1933, when MacBryde noted that scholars had not reached a consensus on its definition, leading to gaps in research and clinical care. Despite remarkable advancements in medicine, these gaps continue to exist, even after nine long decades [1,2]. Over the years, accumulating data on insulin resistance have been published, enabling reconsideration of its meaning. Another unresolved problem relates to the diabetes susceptibility loci in and around the CDKAL1, CDKN2A/CDKN2B, HHEX, KCNJ11, SLC30A8, and TCF7L2 genes, suggesting that the single-nucleotide polymorphisms within or near these genes most likely do not alter their expression or function [3]. A recent study reported that common variant studies of type 2 diabetes mellitus have identified more than 700 risk loci for type 2 diabetes, half of which have been discovered in the past three years [4]. The question is: Are we on the right track? Indeed, genes are normally copied exactly during chromosome duplication. Rarely, however, mutations occur in genes to give rise to altered forms, most –but not all– of which function less well than the wild-type alleles. One study, based on next-generation RNA sequencing, found that an inherited mitochondrial defect, reducing the mitochondrial respiratory chain complex activity, as well as a defect associated with alterations in lipid storage played a critical role in the onset of type 2 diabetes mellitus. Against the background of the above considerations, this type 2 diabetes mellitus compendium furnishes an overview of recent advances in biochemistry and molecular biology in the context of type 2 diabetes mellitus. The compendium will help physicians and/or students of medicine gain an in-depth understanding of the molecular mechanisms of this disease.
Insulin Sensitivity and Glucose Effectiveness
Computational modeling of glucose and insulin kinetics following intravenous glucose challenge has demonstrated that individuals with type 2 diabetes mellitus show significant reductions in insulin sensitivity (SI) and insulin-independent glucose removal rate (SG) compared with normoglycemic individuals (Table 1) [5]. Insulin sensitivity essentially reflects the ability of insulin to enhance the effect of glucose to normalize its own concentration, and glucose effectiveness refers to the ability of glucose, independent of a dynamic insulin response, to enhance net glucose disappearance. Thus, these individuals exhibit reduced responsiveness to circulating insulin as well as reduced glucose effectiveness.
Table 1: Measures of glucose effectiveness and insulin sensitivity for a two- compartment minimal model
|
Units |
Control subjects |
Type 2 diabetes individuals |
P value |
Δ (%) |
Tracer |
| SG | |||||
| h-1 | 0.41 ± 0.04 | 0.33 ± 0.02 |
< 0.001 |
19.5 |
13C |
| h-1 | 0.52 ± 0.05 | 0.37 ± 0.02 |
< 0.001 |
28.8 |
2H |
| average |
24.1 |
||||
| SI | |||||
| pmol x L-1 x h-1 | 0.0082 ± 0.0012 | 0.0036 ± 0.0006 |
< 0.001 |
56.1 |
13C |
| pmol x L-1 x h-1 | 0.0098 ± 0.0013 | 0.0042 ± 0.0008 |
< 0.001 |
57.1 |
2H |
| Average |
56.6 |
Data are based on the reference data listed by Weijers [5]. SG: glucose effectiveness; SI: insulin sensitivity
In the latter condition, glucose ⎼ independent of changes in the insulin concentration ⎼ is less able to facilitate its own uptake through a mass action effect and suppress its own release. A prospective study investigated the development of type 2 diabetes in normoglycemic offspring of parents who had type 2 diabetes. The study revealed that the offspring exhibited significant defects in both glucose effectiveness and insulin sensitivity more than a decade before disease development [6]. Moreover, a key feature in type 2 diabetes is an essentially larger defect in insulin sensitivity (56.6%) compared with glucose effectiveness (24.1%). What do these findings imply?
Genetics
In the ongoing research on the genetic basis of type 2 diabetes, earlier studies using amplified genomic DNAs for genome-wide searches of human genes have led many investigators astray. However, a recent study has taken a different approach, using next-generation RNA sequencing to examine genome-wide changes in gene expression in the skin of patients with type 2 diabetes, compared to non-diabetic patients [7]. This new study identified two previously unknown genes significantly downregulated in indivividuals.
The previous findings revealed that tumor protein D52-like3 (TPD52L3), a gene in the gene metabolism category, exhibited the most significant downregulation with a value of 3.7 × 10⁻⁹ in the studied group, which consisted of individuals with type 2 diabetes. There is no established link between the gene TPD52L3 and type 2 diabetes or wound healing. However, a study involving exogenous expression of human TPD52 in cultured cells demonstrated a notable increase in lipid droplets [8]. Lipid droplets serve as storage organelles for excess fatty acids within adipocytes, which are fat cells. Tumor protein D52 is the founding member of the TP52-like protein family representing four paralogous mammalian genes, i.e. TPD52, TPD52L1, TPD52L2, and TPD52L3 [8,9]. When analyzing TPD52 and TPD52L3 genes, researchers found that the two sequencers shared 63 identical positions and 42 similar positions, resulting in an overall homology of 67.9% (Figure 1) [10]. Indeed, based on the high sequence homology with TPD52L3, it appears plausible that the primary function of TPD52L3 is lipid storage in adipose cells. A reduction in TPD52L3 expression could increase the release of free fatty acids into the bloodstream. The difference in the unsaturation index (number of cis carbon-carbon double bonds per 100 fatty acyl-chains) between the released free fatty acids from human white fat cells and the serum-free fatty acids in the healthy controls (85.5 versus 191.9, respectively) is significant [5]. The release of these saturated free fatty acids leads to a considerable decrease in the unsaturation index of erythrocytes and vascular membranes. As a result, the membrane flexibility of these cells is reduced. The decrease in membrane flexibility, in turn, negatively impacts the rate of glucose transport across the cell membrane, initiating the onset of type 2 diabetes.
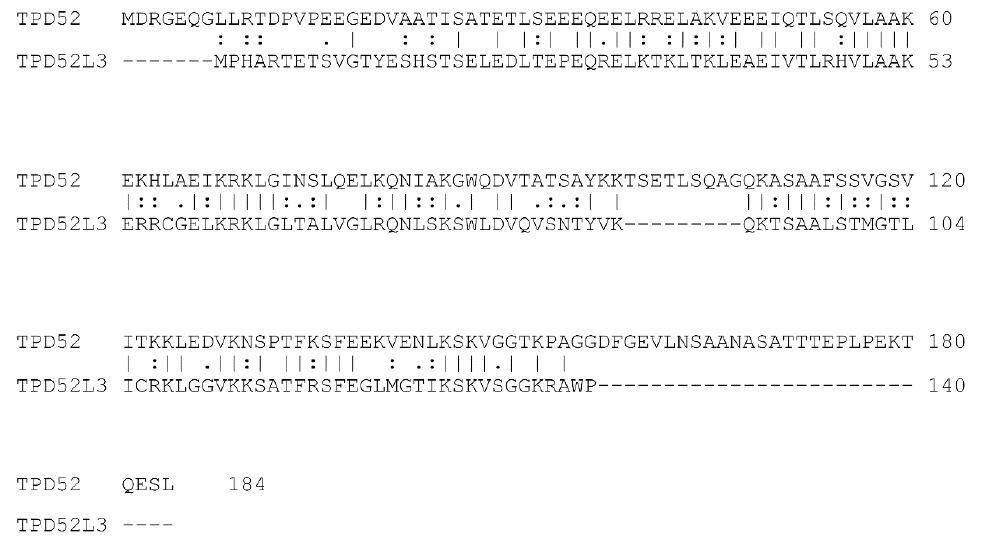
Figure 1: Alignment of the human TPD52 (upper row) and the human TPD52L3 (lower row) protein sequences. Amino acid residues are indicated by single letters. Vertical lines indicate identical residues and colons/dots indicate highly/weakly conserved residues.
In the second scenario, the most downregulated gene in the gene regulation category was NKX2-1, and it exhibited a down regulation value of 3.7 × 10⁻⁹ [7]. NKX2-1, a transcription factor, is associated with reduced mitochondrial respiratory chain complex activity, resulting in decreased ATP production, among other cellular functions [11]. This idea supports a study’s data proposing that the dysregulation of intramyocellular fatty acid metabolism in the offspring of individuals with type 2 diabetes is linked to an inherited defect in mitochondrial oxidative phosphorylation [12]. The β-oxidation of fatty acids plays a crucial role in compensating and restoring ATP production by increasing plasma-free fatty acids through hydrolysis. However, this increase in free fatty acids results in significant decrease in the unsaturation index of serum free fatty acids. Consequently, the reduction in the unsaturation index leads to decreased membrane flexibility and lowers the rate of glucose transport across the cell membrane, ultimately initiating the onset of type 2 diabetes. Notably, reduced mitochondrial activity is recognized as one of the key characteristics of type 2 diabetes [13].
Free Fatty Acids
After four billion years of evolution, the earliest protocells evolved to ‘modern’ cells enclosed by membranes consisting of phospholipids, the chief constituents of biological membranes. Glycerol-based phospholipids are the major class of naturally occurring phospholipids. Typically, a phospholipid consists of glycerol-3-phosphate, with a saturated fatty acid at position 1 and an unsaturated fatty acid at position 2 of the glycerol. Saturated fatty acids possess essentially linear alkyl chains with no double bonds. On the other hand, double bonds in unsaturated fatty acids are nearly in the cis configuration, which creates a bend in the fatty-acid chain. Molecules such as palmitoleic acid (C16:1) and oleic acid (C18:1) are bent at the cis double bond, and the two chain parts form an angle of 133 degrees [14,15]. This bend has important consequences for structure and functionality of biological membranes because, while saturated fatty acids are able to pack closely together, unsaturated fatty acids prevent such close packing.
Type 2 diabetes mellitus, gestational diabetes mellitus, and impaired glucose tolerance are characterized by elevated plasma free fatty acid levels [16,17]. This is confirmed by findings that the percentages of docosahexaenoic acid (C22:6 n-3) and arachidonic acid (C20:4 n-6), released from white adipocytes, are decreased by approximately 110-fold and 9-fold, respectively, compared with the human serum pool, and the unsaturation index of released free fatty acids from human white adipocytes is markedly lower than the unsaturation index of serum free fatty acids in healthy controls (85.5 and 191.9, respectively) [5]. Therefore, an increased release of free fatty acids from adipose tissue into the blood circulation elevates the plasma concentration of saturated fatty acids. Hence, a shift from unsaturated to saturated fatty-acyl chains in phospholipids of erythrocyte membrane and vascular endothelium is a hallmark of type 2 diabetes mellitus [18]. Borkman et al. in 1993 suggested that decreased insulin sensitivity is associated with decreased concentration of polyunsaturated fatty acids in skeletal-muscle phospholipids, raising the possibility that changes in the fatty-acid composition of muscle modulate the action of insulin [19].
Cell Membranes
Phospholipid bilayers form spontaneously and rapidly, when phospholipids are added to water. As evident in Figure 2, two acyl chains (the hydrocarbon chain region) yield a roughly cylindrical molecule with an area (A) that can pack in parallel arrays to form extended sheets of membranes composed of a mosaic of proteins and phospholipids in a fluid phospholipid matrix [20].
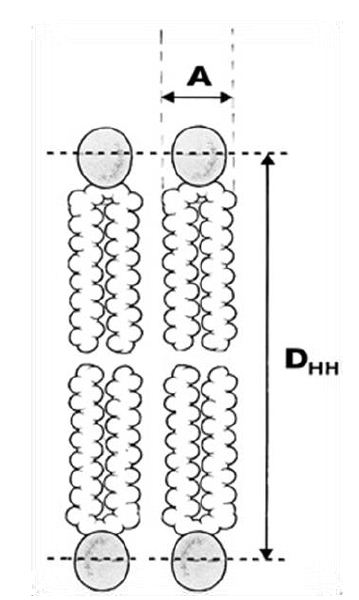
Figure 2: The most basic structural result obtained from x-ray scattering from oriented bilayers in model phospholipid membrane systems is the area (A) per lipid molecule (the cross-sectional area of the cylindrical part of the phospholipid). DHH represents the membrane bilayer thickness.
The driving force behind this aggregation phenomenon is the weak, noncovalent bond (van der Waals force) between a pair of carbon atoms, which can be calculated with the Lennard-Jones potential [21]. The interaction energy (U) is related to the distance (r) between two carbon atoms, as illustrated graphically in Figure 3. This graph suggests that the minimum energy principle favors a carbon-carbon distance of about 4 Å, which is the most stable distance between the centers of two carbon atoms, with a minimum interaction energy of -0.77 kJ/mol. Furthermore, when the carbon atoms in two acyl chains of a phospholipid diverge, their interaction energy decreases as a function of distance r approximately with the sixth power, and when they approach each other, their interaction energy increases as a function of distance r approximately with the sixth power. Thus, the flexibility of a lipid bilayer is largely determined by the amount of weak noncovalent forces of carbon–carbon interactions, i.e., the number of -C=C- double bonds along the phospholipid unsaturated acyl chains.
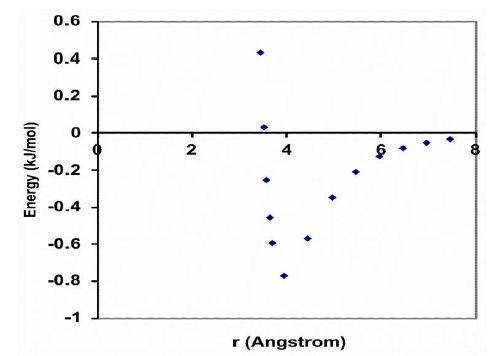
Figure 3: The van der Waals interaction energy profile as a function of the distance (r) between the centers of two carbon atoms. The energy is calculated using the empirical equation U=B/r12 – A/r6. Values for the parameters B=11.5 ⨯ 10-6 kJnm12/mol and A=5.96 ⨯ 10-3 kJnm6/mol for the interaction between two carbon atoms.
The unsaturation index is widely recognized as a useful parameter for describing the flexibility of a biological membrane. It is calculated by multiplying the mean number of cis double bonds per lipid acyl chain by 100 [22]. Therefore, an increase in saturated fatty acids of membrane phospholipids, as observed in erythrocytes, results in a decrease in membrane flexibility and is marked by a decrease in the unsaturation index. A number of studies of fully hydrated, fluid phase, model phosphatidylcholine bilayers have shown that introducing one or more carbon-carbon cis double bonds into the saturated acyl chains will increase the cross-sectional area A by about 18% and decrease the attraction energy by about 34% (Table 2) [23].
Table 2: Experimental data of fully hydrated fluid phase phosphatidylcholine lipid bilayers
|
DLPC |
DMPC |
DPPC |
DOPC |
PDPC |
||
| Fatty acid structure |
[C12:0)]2 |
[C14:0]2 |
[C16:0]2 |
[C18:1]2 |
C16:0,C22:6 |
|
| Temperature (C°) |
30 |
30 |
50 |
30 |
30 |
|
| Area A per lipid molecule (Å)2 |
63.2 |
60.6 |
64.0 |
72.5 |
74.8 |
|
| Mean Area A sat. unsat. (Å)2 |
62.6 |
73.6 |
||||
| Mean -C=C- interchain dist.(Å) |
4.48 |
4.84 |
||||
| Mean interact. energy U (kJ/mol) |
-0.59 |
-0.39 |
||||
| UI |
0 |
0 |
0 |
100 |
300 |
Data are based on the original data listed by Weijers [40].
DLPC: Dilauroylphosphatidylcholine; DMPC: Dimyristoylphosphatidylcholine; DPPC: Dipalmitoylphosphatidylcholine; DOPC: Dioleoylphosphatidylcholine; PDPC: Palmitoyl-Docosahexaaenoic-Phosphatidylcholine; –C=C⎼: Carbon-Carbon double bound; UI: Unsaturation Index.
An important different method, compared to the number of studies of fully hydrated, fluid phase, model phosphatidylcholine bilayers, for quantifying the mechanical properties of a single cell, has recently developed, in which a spherical cell is aspirated into a micropipette aspiration channel with a controlled suction pressure [24]. The micropipette pressurization of giant diacylphosphatidylcholine bilayers demonstrated that poly-cis unsaturated chain bilayers are thinner and more flexible than saturated/monounsaturated chain bilayers. However, the most striking result was the major increase in bending flexibility, which occurred when two or more cis double bonds were present in one or both chains of the lipid [25].
Atomistic Glucose and Glucose Transport
Glucose tissue uptake is performed by different specific glucose transporters. Glucose transporter proteins are integral membrane proteins containing 12 membrane-spanning helices. The glucose channel of a glucose transporter comprises eight helices that are immersed in a box formed by the remaining four helices [26]. The cross-section of this box has a mean surface area of 1,100 Å2, which covers an area of about 17 molecules of a phosphatidylcholine bilayer with saturated fatty acyl chains. Thus, the insertion of a glucose transporter molecule across a phospholipid cell membrane requires flexibility of the bilayer membrane.
β-Cell Functions
Variations in the lipid composition of cell membranes can profoundly impact the function of proteins embedded with them. Even small changes in the lateral pressure of a bilayer membrane can lead to significant alterations in the conformational distribution of the embedded proteins [27]. In type 2 diabetes mellitus, the redistribution process in membrane phospholipids can be triggered by a deficiency in cis carbon-carbon double bonds, compared to healthy individuals. A reduction in the area A of lipid molecules in the cell membranes leads to decreased flexibility. This reduction in flexibility can hinder the movement and conformational changes of proteins embedded in the membrane glucose transporters.
The collected information enables an exploration of ‘insulin resistance’ in the pathophysiology of type 2 diabetes. During the prediabetic phase, a crucial aspect of type 2 diabetes etiology is a decrease in unsaturation index of membrane phospholipids observed in erythrocytes compared to healthy controls. This reduction in the unsaturation index lowers flexibility of β-cell membranes, leading to a slower transmembrane glucose transport via GLUT2 in the β-cells. Consequently, the insulin granules inside the β-cells contain reduced insulin. Thus, instead of attributing the condition solely to ‘insulin resistance’, the primary factor behind decreased glucose levels within the β-cells and subsequent lower insulin production is the reduction in membrane flexibility.
Following the synthesis of monomer insulin within the β-cell, six monomer insulin molecules come together to form stable hexamers with a molecular weight of 36,000 [28]. These hexamers are then enclosed within mature intracellular vesicles and transported at any time to the β-cellʼs plasma membrane. A fusion pore is created upon the fusion of the intracellular vesicle membrane with the β-cell plasma membrane, releasing monomer insulin molecules into the bloodstream. Given the relative large size of the monomer insulin molecule (30Å wide and 35Å high), compared to the glucose molecule (overall size 10Å), both the vesicle membrane and the β-cell plasma membrane require significantly flexibility [29,30]. In individuals with type 2 diabetes, a reduction in the unsaturation index results in decreased membrane flexibility, leading to a slower rate of transmembrane insulin transport in the bloodstream. This phenomenon is in accordance with the data of individuals with type 2 diabetes, showing a reduction in insulin sensitivity by 57.9% and a much lower reduction in glucose effectiveness by 26.2% (Table 1). Thus, instead of using the term ‘insulin resistance’, the key issue lies in reducing flexibility in vesicle and β-cell plasma membranes, which impacts insulin release.
Membrane Flexibility and (Pre)diabetes Type 2
Table 3 records the biochemical outcomes of control individuals and individuals with prediabetes or type 2 diabetes mellitus. A study demonstrated that compared with healthy controls, individuals with gestational diabetes mellitus showed reductions in total polyunsaturated fatty acids (31.9 vs. 37.5; Δ=-14.9%), arachidonic acid (11.0 vs. 12.8; Δ=-14.1%), and unsaturation index (137 vs. 163; Δ=-15.8%) [31]. Another study revealed that compared with healthy controls, individuals with impaired glucose tolerance showed reductions, in total polyunsaturated fatty acids (25.8 vs. 30.7; Δ= -16.0%), arachidonic acid (11.1 vs. 12.5; Δ= – 11.2%), and unsaturation index (113 vs. 130; Δ= – 12.6%) [32]. Furthermore, a study found that compared with healthy controls, individuals with type 2 diabetes without retinopathy showed reductions in total polyunsaturated fatty acids (31.9 vs. 38.0; Δ= – 16.1%), arachidonic acid (11.3 vs. 13.0; Δ= -13.1%), and unsaturation index (134 vs. 155; Δ= – 13.6%) [33], whereas individuals with type 2 diabetes with retinopathy showed even lower values, compared to healthy controls, in total polyunsaturated fatty acids (29.5 vs. 38.0; Δ= – 22.4%), arachidonic acid (9.7 vs. 13.0; Δ= -25.4%), and unsaturation index (128 vs. 155; Δ= – 17.4%) [33].
Table 3: Erythrocyte acyl composition in phospholipids of control individuals, individuals with gestational diabetes, with impaired glucose tolerance, with type 2 diabetes without and with retinopathy, and type 2 diabetic men (study group).
|
Total SFAs (%) |
Total MUFAs (%) |
Total PUFAs (%) |
C20:4 n-6 (%) |
UI |
|
| GDM | |||||
| Controls (n=61) |
33.6 |
15.9 |
37.5 |
12.8 |
163 |
| Patients (n=53) |
37.7 |
18.0 |
31.9 |
11.0 |
137 |
| Δ (%) |
+12.2 |
+13.2 |
-14.9 |
-14.1 |
-15.8 |
| IGT | |||||
| Controls (n=42) |
42.4 |
22.6 |
30.7 |
12.5 |
130 |
| Patients (n=28) |
44.8 |
24.6 |
25.8 |
11.1 |
113 |
| Δ (%) |
+5.6 |
+8.8 |
-16.0 |
-11.2 |
-13.1 |
| Type 2 diabetes ret.(-) | |||||
| Controls (n=18) |
42.1 |
18.8 |
38.0 |
13.0 |
155 |
| Patients (n=14) |
44.2 |
21.7 |
31.9 |
11.3 |
134 |
| Δ (%) |
+5.0 |
+15.4 |
-16.1 |
-13.1 |
-13.6 |
| Type 2 diabetes ret.(+) | |||||
| Controls (n=18) |
42.1 |
18.8 |
38.0 |
13.0 |
155 |
| Patients (n=46) |
46.9 |
21.3 |
29.5 |
9.7 |
128 |
| Δ (%) |
+11.4 |
+13.3 |
-22.4 |
-25.4 |
-17.4 |
| Type 2 diabetes (study group) | |||||
| Controls (n=14) |
44.0 |
20.2 |
28.8 |
11.1 |
126 |
| Patients (n=21) |
42.9 |
20.6 |
31.6 |
14.3 |
141 |
| Δ (%) |
-2.5 |
+2.0 |
+9.7 |
+28.8 |
+11.9 |
Ex-posed calculations performed by the author are based on the original data listed by Min et al. [31,32], Koehrer et al. [33], and Pelikánová et al. [40]. SFA: saturated fatty acid; MUFA: monounsaturated fatty acid; PUFA: poly-unsaturated fatty acid; UI: unsaturated index; C20:4 n-6: arachidonic acid. The values of gestational diabetes mellitus and impaired glucose tolerance are the means of phosphatidylcholine and phosphatidyletanolamine values. The values of type 2 diabetes mellitus with retinopathy are the means of mild, moderate, and severe diabetic retinopathy values [33].
These results imply that a decrease in the unsaturation index in individuals with prediabetes or type 2 diabetes mellitus has the potential to translate into an increase in attractive forces between the mutual membrane phospholipid acyl chains, which redistributes the lateral pressure profile of the cell membrane [27]. This redistribution induces alterations in mechanical and biochemical properties of the glucose transport channel proteins, i.e., it reduces the pore diameter, which in turn, reduces the rate of glucose transport across the cell membrane, and therefore causes the onset of type 2 diabetes mellitus [10].
These findings are substantiated by two surprising facts. First, Shulman et al. studied muscle glycogen synthesis in subjects with type 2 diabetes mellitus and matched controls using in vivo carbon-13 nuclear magnetic resonance spectroscopy [34-36]. They noted that the muscle glycogen synthesis rates in subjects with type 2 diabetes were about 50% lower of the rates observed in controls. The same group of researchers investigated, under hyperglycemic-hyperinsulinemic conditions, the pathway: transmembrane glucose transport into the muscle cell, conversion of intracellular glucose into glucose-6 phosphate, and then, after two more intermediates, the addition of the latter through glycogen synthase to the glycogen polymer. They concluded that their experimental results are consistent with the hypothesis that the transmembrane glucose transport into the muscle cell is the rate-controlling step in insulin-stimulated muscle glycogen synthesis in patents with type 2 diabetes, and the delivery of insulin is not responsible for the insulin resistance. This idea is in agreement with a constriction of the glucose channel within the three-dimensional structure of glucose transporter-4, which reduces the rate of transmembrane glucose-transport in type 2 diabetes [37]. Second, epidemiological evidence suggests that human plasma free fatty acid levels are generally elevated during the course of a pregnancy, probably with vital functions on fetal energy metabolism [38,39]. It is not unlikely that this increase also leads to an additional reduction in membrane flexibility and increases the amount of maternal glucose as an additional source of energy for the fetus.
The problem with the hypothesis is the lack of evidence of the healing power of an increase in unsaturation index in relation to type 2 diabetes. There is, however, an overlooked study with a surprising result. In 1991, Pelikánová et al. described, among others, a study group of 21 men with mild-to-moderate type 2 diabetes and 14 control men matched for age, sex, bodyweight, and dietary intake [40]. In this study, type 2 diabetes was defined by the criteria of the National Diabetes Data Group. The individuals were enrolled within 1 year after diagnosis, treated only with a diet, were less than 45 years of age and free of signs of atherosclerotic complications, and had a BMI < 30 kg/m2 [41]. The amount of saturated fatty acids in the diet was lower for the type 2 diabetes individuals than for the healthy controls (35.4 ± 12.2 g/d vs. 47.7 ± 10.8 g/d). Table 3 presents the ex-post calculations based on the original data of erythrocyte phospholipids, described by Pelikánová et al. [40]. The salient points in the data of the individuals in the study group show essential increases, compared with healthy controls, in the total polyunsaturated fatty acids (31.6 vs. 28.8; Δ=+9.7% ), arachidonic acid (14.3 vs. 11.1; Δ=+28.8%), and unsaturation index (141 vs. 126, Δ=+11.9%).
For the first time in the type 2 diabetes literature, individuals with mild-to-moderate type 2 diabetes have been treated successfully with diet alone in combination with a rise in the arachidonic acid level. The authors of the Pelikánová-study suggested that the increase in arachidonic acid level could be diet-induced or represent an increased incidence of atherosclerotic complications. A third option, however, arises in the use of arachidonic acid as a supplement in training adaptations among resistance-trained males [42]. However, the crucial biochemical outcome of this study concerns, independent of the provenance of arachidonic acid, the experimental result of an increase, compared with healthy controls, in the number of carbon-carbon double bonds in the cell membranes of the 21 men of the study group. This increased the unsaturation index, which is intricately linked to a rise of membrane flexibility and therefore led to an additional increase in the rate of glucose transport across the cell membrane. In addition, the increase in membrane flexibility resulted in an improved transmembrane insulin transport from pancreatic β-cells into the blood circulation. The influence of arachidonic acid on membrane flexibility is particularly important because arachidonic acid with four carbon-carbon double bonds is an important molecule in the field of membrane flexibility.
The most important steps of the hypothesis are diagrammatically illustrated in Figure 4 and predict that using RNA sequencing, the most essentially downregulated regulation-related gene, NKX2-1, and the most essentially downregulated metabolism-related gene, TPD52L3, cause an increase in plasma saturated free fatty acid levels, which leads to a decrease in the membrane unsaturation index and thereby reduces the rate of transmembrane glucose transport, resulting in type 2 diabetes mellitus. The reliability of the ideas is supported by the understanding of the observations that, first, the reduced glycogen synthesis rate in subjects with type 2 diabetes mellitus was about 50% of the rate observed in healthy controls; second, the normoglycemic offspring of parents, who had type 2 diabetes, exhibited significant defects in both insulin sensitivity and insulin-independent glucose removal rate; and third, the key feature of type 2 mellitus is an essentially larger defect in insulin sensitivity compared with glucose effectiveness.
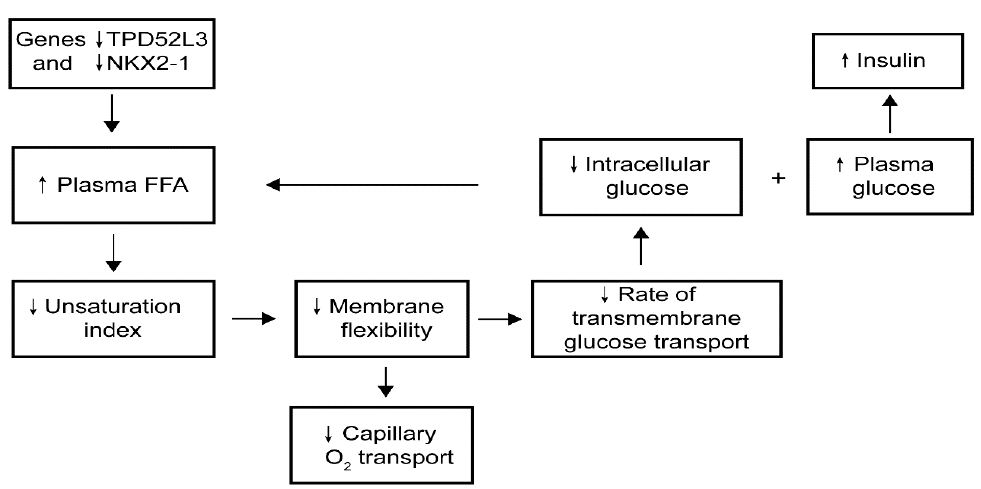
Figure 4: Hypothetical pathway of the development of type 2 diabetes
Attention to this hypothesis was very tastefully articulated by late Denis McGarry in his article “What if Minkowski had been ageusic…” [43]. He argued that hyperglycemia and insulin resistance might be better explained when viewed in the context of underlying abnormalities of lipid metabolism.
Obesity and Type 2 Diabetes
Obesity is a chronic metabolic disease that has become the main risk factor for various non-communicable diseases, in particular, type 2 diabetes. Obesity has been reported to account for 80-85% of the risk of developing type 2 diabetes, while recent research suggests that obese people are up to 80 times more likely to develop type 2 diabetes than those with a BMI of less than 22 [44]. The concentration of free fatty acids is elevated in obese individuals [45]. The increased release of free fatty acids from adipose tissue into the blood circulation elevates the plasma concentration of saturated fatty acids because the unsaturation index of released free fatty acids from human white adipocytes is markedly lower than the unsaturation index of serum free fatty acids in healthy controls (85.5 versus 191.9, respectively). This phenomenon causes a shift from unsaturated to saturated fatty-acyl chains in phospholipids of erythrocyte membrane and vascular endothelium with all the associated consequences (Figure 4). There is no question of suggesting that free fatty acids cause insulin resistance, as suggested by Boden, but a decrease in the unsaturation index reduces the pore diameter of the glucose transporter protein, which in turn, reduces the rate of glucose transport across the cell membrane [45].
Insulin Resistance
The findings presented above propose a potential solution for the importance of ‘insulin resistance’ in the pathogenesis of type 2 diabetes. Specifically, the significant downregulation of NKX2-1 and TPD52L3 appears to be the main cause of the reduction in cis carbon-carbon double bonds of phospholipid membranes. This reduction decreases the cross-sectional area A of the cylindrical part of the phospholipid molecule. As a result, there are increased attractive forces between the phospholipid acyl chains, causing a redistribution of lateral pressure in cell membranes. This, in turn, induces a cross-sectional contraction of all Class1 GLUT proteins, ultimately leading to a lower rate of transmembrane glucose transport. The idea aligns with observations from biophysical and structural studies, highlighting the critical role of interactions between membrane proteins and lipid molecules in their folding and stability [46-48]. Clinically, the results of a study by the Diabetes Prevention Program Research group, are quite exciting. They indicate that among high-risk individuals, lifestyle intervention resulted in a 50% reduction in the incidence of type 2 diabetes development, while metformin led to a 31% reduction, compared to placebo [49]. This valuable insight into treating type 2 diabetes according the Diabetes Prevention Program Research group deserves wider recognition and attention.
The consistent findings from various studies strongly support the conclusion that lifestyle change treatment can effectively compensate for the loss of membrane flexibility by inducing an increase in the membrane unsaturation index. Therefore, it is advisable to incorporate the assessment of the unsaturation index into the treatment protocol. By doing so, we can better address the needs of individuals with type 2 diabetes and work towards normalizing membrane flexibility. Furthermore, it is essential to reconsider the notion of ‘insulin resistance’. The original interpretation that cells do not respond to insulin is inaccurate. Instead, the correct understanding is that the amount of carbon-carbon double bonds of cell membrane regulates the rate of glucose transport. Thus, the concept of ‘insulin resistance’ loses relevance, especially considering the significant role of membrane flexibility in glucose transport.
Conclusions and Future Recommendations
The proposals of the Diabetes Prevention Program Research group remain the method of choice for the treatment of type 2 diabetes. The key to lifestyle modification consists of increasing the patient’s unsaturation index level, which would promote a phospholipid shift from saturation to unsaturation, and thus reduce the incidence of type 2 diabetes. Clinical evidence has demonstrated that all of the 21 men in the study group managed their disease by increasing the level of the unsaturation index without taking metformin. Based on the considerations described above, one could conclude that considerable clinical benefit would accrue by the essential concept: saturated fatty acids makes the human cell membrane more rigid, while unsaturated fatty acid increases its flexibility, which ultimately postpones the onset of type 2 diabetes mellitus.
Two different techniques quantifying the mechanical properties of cell membranes came to the same conclusions: an increase in carbon-carbon double bonds by poly-cis unsaturated chain bilayers creates more membrane flexibility than saturated/monounsaturated chain bilayers.
A substantial difference can be made in extending the quality of type 2 diabetes mellitus treatment by introducing the unsaturation index assessment, because the regulation of membrane flexibility represents a great step forward in the development of precision medicine for type 2 diabetes mellitus.
The investigation of the genetic origin of type 2 diabetes mellitus must be moved from chemistry of DNA to chemistry of RNA.
Physical activity, as a part of standard lifestyle intervention, needs to be accompanied by the following official instructions throughout the disease period:
– Increase the rate of glucose transport and insulin transport across cell membranes through caloric restriction and walking 3 to 3.5 miles per hour, for at least 150 minutes per week.
– Replace “insulin resistance” by “reduction in membrane flexibility”.
Conflict-of-Interest
The author declares that the research was conducted in the absence of any commercial of financial relationships that could be constructed as a potential conflict of interest.
References
- Falta W, Boller R (1931) Insulärer und Insulinresistenter Diabetes. Klin Wochenschr 10: 438-443.
- Fernandez ML, Murillo AG (2022) Dietary treatments to reduce insulin resistance and inflammation in type-2 diabetic patients. Med Res Arch 10.
- Weijers RNM (2009) Risk loci for type 2 diabetes – Quo vadis? Clin Chem Lab Med 47: 383-386. [crossref]
- DeForest N, Majithia AR (2022) Genetics of type 2 diabetes: implications from large-scale studies. Curr Diab Rep 22: 227-235. [crossref]
- Weijers RNM (2016) Membrane flexibility, free fatty acids, and the onset of vascular and neurological lesions in type 2 diabetes. J Diabetes Metab Disord 15: 13. [crossref]
- Martin BC, Warram JH, Krolewski AS, Bergman RN, Soeldner JS, et al. (1992) Role of glucose and insulin resistance in development of type 2 diabetes mellitus: results of a 25-year follow-up study. Lancet 340: 925-229. [crossref]
- Takematsu E, Spencer A, Auster J, Chen PC, Graham A, et al. (2020) Genome wide analysis of gene expression changes in skin from patients with type 2 diabetes. Plos One 15: e0225267. [crossref]
- Chen Y, Frost S, Byrne JA (2016) Dropping in on the lipid droplet-tumor protein D52 (TPD52) as a new regulator and resident protein. Adipocyte 5: 326-332. [crossref]
- Cao Q, Chen J, Zhu L, et al. (2006) A testis-specific and testis developmentally regulated tumor protein D52 (TPD52)-like protein TPD52L3/hD55 interacts with TPD52 family proteins. Biochem Biophys Res Commun 344: 798-806.
- Weijers RNM (2020) Identification of the downregulation of TPD52-Like3 gene and NKX2-1 gene in type 2 diabetes mellitus via RNA sequencing. Arch Diab & Obes 3: 277-281.
- Coon EA, Ahlskog JE, Patterson MC, Niu Z,Milone M (2016) Expanding phenotypic spectrum of nkx2-1-related disorders-mitochondrial and immunologic dysfunction. JAMA Neurol 73: 237-238. [crossref]
- Petersen KF, Dufour S, Befroy D, Garcia R,Shulman GI (2004) Impaired mitochondrial activity in the insulin-resistant offspring of patients with type 2 diabetes. N Engl J Med 350: 664-671. [crossref]
- Sivitz WI, Yorek MA (2010) Mitochondrial dysfunction in diabetes: from molercular mechanisms to fuctional significance and therapeutic opportunities. Antioxid Redox Signal 12: 537-577. [crossref]
- PubChem Compound Database; CID=445638. Available from: (https://pubchem.ncbi.nlm.nih.gov/compound/palmitoleic_acid/)
- PubChem Compound Database; CID=445639. Available from: (https://pubchem.ncbi.nlm.nih.gov/compound/oleic_acid/)
- Bergman RN, Ader M (2000) Free fatty acids and pathogenesis of type 2 diabetes mellitus. Trends Endocrinol Metab 11: 351-356. [crossref]
- Villafan-Bernal JR, Acevedo-Alba M, Reyes-Pavon R, Diaz-Parra GA, Lip-Sosa DL, et al. (2019) Plasma levels of free fatty acids in women with gestational diabetes and its intrinsic and extrinsic determinants: systematic review and meta-anlysis. J Diabetes Res 2019: 7098470. [crossref]
- Weijers RNM (2012) Lipid composition of cell membranes and its relevance in type 2 diabetes mellitus. Curr Diabetes Rev 8: 390-400. [crossref]
- Borkman M, Storlien LH, Pan DA, Jenkins AB, Chisholm DJ, et al. (1993) The relation between insulin sensitivity and the fatty-acid composition of skeletal-muscle phospholipids. N Engl J Med 328: 238-244. [crossref]
- Singer SJ, Nicolson GL (1972) The fluid mosaic model of the structure of cell membranes. Science 175: 720-731. [crossref]
- Levitt M (1974) Energy refinement of hen egg-white. J Mol Biol 82: 393-420. [crossref]
- Baur LA, O’Conner J, Pan DA, et al. (1999) Relationships between maternal risk of insulin resistance and the child’s muscle membrane fatty acid composition. Diabetes 48: 112-116.
- Weijers RNM (2020) Fundamentals about onset and progressive disease character of type 2 diabetes mellitus. World J Diabetes 11: 165-181. [crossref]
- Li Y-J, Yang Y-N, Zhang H-J (2019) A microfluidic micropipette aspiration device to study single-cell mechanisms inspired by the principle of Wheatstone Bridge. Micromachines 10: 131. [crossref]
- Rawicz W, Olbrich KC, McIntosh T, Needham D, Evans E (2000) Effect of chain length and unsaturation on elasticity of lipid bilayers. Biophys J 79: 328-339. [crossref]
- Salas-Burgos A, Iserovich P, Zuniga F, Vera JC, Fischbarg J (2004) Predicting the three-dimensional structure of the human facilitaitive glucose transporter Glut1 by a novel evolutionary homology strategy: insights on molecular mechanisms of substrate migration, and binding sites of glucose and inhibitory molecules. Biophys J 87: 2990-2999. [crossref]
- Cantor RC (1997) Lateral pressures in cell membranes: a mechanism for modulating of protein function. J Phys Chem 101: 1723-1725.
- Blundell TL, Cutfield JF, Cutfield SM,Dodson EJ,Dodson GG, et al. (1972) Three-dimensional atomic structure of insulin and its relationship to activity. Diabetes 21: 492-505. [crossref]
- Weiss M, Steiner DF, Philipson LH, Feingold KR,Anawalt B, et al. (2014) Insulin biosynthesis, secretion, structure, and structure-activity. Bookshelf ID: NBK279029. [crossref]
- LaMorte WW (2016) From molecules to man, a perspective on size; Boston University School of Public Health.
- Min Y, Ghebremeskel K, Lowy C, Thomas B,Crawford MA (2004) Adverse effect of obesity on red cell membrane arachidonic and docosahexaenoic acids in gestational diabetes. Diabetologia 47: 75-81. [crossref]
- Min Y, Lowy C, Islam S, Khan FS, Swaminathan R (2011) Relationship between red cell membrane fatty acids and adipokines in individuals with varying insulin sensitivity. Eur J Clin Nutr 65: 690-695. [crossref]
- Koehrer P, Saab S, Berdeaux O,Isaïco R,Grégoire S, et al. (2014) Erythrocyte phospholipid and polyunsaturated fatty acid composition in diabetic retinopathy. PLos One 9: e106912. [crossref]
- Shulman GI, Rothman DL, Jue T,Stein P,DeFronzo RA, et al. (1990) Quantitation of muscle glycogen synthesis in normal subjects and subjects with non-insulin-dependent diabetes by 13C nuclear magnetic resonance spectroscopy. N Engl J Med 322: 223-228. [crossref]
- Shulman RG, Bloch G, Rothman DL (1995) In vivo regulation of muscle glycogen synthase and the control of glycogen synthesis. Proc Natl Acad Sci USA 92: 8535-8542. [crossref]
- Roden M, Price TB, Perseghin G,Petersen KF,Rothman DL, et al. (1996) Mechanism of free fatty acid-induced insulin resistance in humans. J Clin Invest 97: 2859-2865. [crossref]
- Weijers RNM (2014) Membrane flexibility and cellular energy management in type 2 diabetes, gestational diabetes, and obesity. EMJ Diabet 2: 65-72. [crossref]
- Duttaroy AK, Basak S (2021) Maternal fatty acid metabolism in pregnancy and its consequences in the feto-placental development. Front Physiol 12: 787848. [crossref]
- Sivan E, Boden G (2003) Free fatty acids, insulin resistance, and pregnancy. Curr Diab Rep 3: 319-322. [crossref]
- Pelikánová T, Kohout M, Válek J, Base J, Stefka Z (1991) Fatty acid composition of serum lipids and erythrocyte membranes in type 2 (non-insulin-dependent) diabetic men. Metabolism 40: 175-180. [crossref]
- National Diabetes Data Group (1979) Classification and diagnosis of diabetes mellitus and other categories of glucose intolerance. Diabetes 28: 1039-1057. [crossref]
- Roberts MD, Iosia M, Kerksick CM,Taylor LW,Campbell B, et al. (2007) Effects of arachidonic acid supplementation on training adaptations in resistance-trained males. J Int Soc Sports Nutr 4: 21. [crossref]
- McGarry JD (1992) What if Minkowski had been ageusic? An alternative angle on diabetes. Science 258: 766-770. [crossref]
- Leitner DR, Frühbeck G, Yumuk V,Schindler K,Micic D, et al. (2017) Obesity and type 2 diabetes: two diseases with a need for combined treatment strategies – EASO can lead the way. Obes Facts 10: 483-492. [crossref]
- Boden G (2008) Obesity and free fatty acids. Endocrinol Metab Clin North Am 37: 635-646. [crossref]
- Bond PJ, Sansom MS (2006) Insertion and assembly of membrane proteins via simulation. J Am Chem Soc 128: 2697-2704. [crossref]
- Lee AG (2003) Lipid-protein interactions in biological membranes: a structural perspective. Biochim Biophys Acta 1612: 1-40. [crossref]
- Lee AG (2004) How lipids affect the activities of integral membrane proteins. Biochim Biophys Acta 1666: 62-87.
- Knowler WC, Barrett-Conner E, Fowler SE, Hamman RF, Lachin JM, et al. (2002) Diabetes Prevention Program Research Group. Reduction in the incidence of type 2 diabetes with lifestyle intervention or N Engl J Med 346: 393-403. [crossref]