Abstract
Glimepiride, a second generation of sulfonylureas, is used in treating diabetes mellitus. The monograph does not include digestive enzymes, such as pancreatin, in the description of its dissolution tests. Because its aqueous solubility values in literature are inconsistent, this study firstly determined it. In order to gain insight how a glimepiride tablet acted in the gastrointestinal tract, a three stage dissolution study tested two commercial tablets. Pancreatin powder was added versus not added in the beginning of Buffer Stage 1. HPLC quantified samples at 228 nm. The US Similarity Factor ratified that (a) similar between commercial Products A and B release profiles (f2 ≥ 50), and (b) different in drug releases between dissolution media containing versus not containing pancreatin. This study also found that the drug amount in the dissolution medium containing pancreatin decreased from 22 h to 24 h, while the same decline was not observed in the control group. Drug decomposition occurred in the pancreatin group was further expedited. After UV spectrophotometric scan and HPLC characterization of the 24 h dissolution samples, a small un-identified chromatographic peak was recorded at 235 nm and 240 nm respectively. This study highlights how endogenous mediated enzymes affects the free concentrations of lipophilic drugs.
Keywords
Glimepiride, Pancreatin, Three-stage dissolution, FDA similarity factor f2, Release kinetics, Solubility descriptor
Introduction
For oral drug delivery to be successful, the aqueous solubility of the drug compound in the GI system should be either known from literature or assessed in the lab to determine if modifications are needed. Lipase is produced primarily in the pancreas. There is no lingual lipase in human [1]. The activity of the gastric lipase is not low. It is also stable in acid pH. Actually, its maximum activity is at pH 5, which is the immediate fed stage pH for many cases. The pH of a fed stomach lowers thirty min or so after food intake due to the secretion of gastric acid by parietal cells, which aids in food digestion, absorption of minerals, and control of harmful bacteria. Gastric lipase is stable in acid pH, but is not as active after the gastric pH is lowered. After being mixed with gastric lipase, powerful gastric juice and 2-4 h of peristaltic contractions (mechanical digestion churn), approximately 30% of fats/triglycerides in the food bolus is broken down into diglycerides and fatty acids in partially digested food mass (known as chyme). When the chyme passes to the small intestine, pancreatic lipase is secreted by pancreas into the duodenum through the duct system of the pancreas to continue the fat digestions [1]. The third lipase is hepatic lipase, which is produced by the liver [1]. Hepatic lipase is a lipolytic enzyme that contributes to the regulation of plasma triglyceride levels, but not in the intestinal lumen [2]. Over the past 50 years, dissolution testing has also been employed for different purposes, such as a quality assurance/quality control procedure, in research and development to detect the influence of critical manufacturing variables and in comparative studies for in vitro–in vivo correlation [2]. However, most compendium monographs describing dissolution tests as a part of performance tests do not include digestive enzymes in the media. Many are defined as one-stage (single medium pH) tests to serve quality control purposes. However, the pH of the gastrointestinal medium is a digestion parameter. Thereby, multistage in vitro dissolution tests should also be conducted during the preformulation and formulation stages. This project aimed at the examination of how pancreatin may impact the release of a lipophilic drug from its oral dosage form with food intake. Glimepiride (a long-action second generation of sulfonylurea) was chosen as the model drug, because its side chains are known to be less polar. Glimepiride is usually administered by mouth once a day by taken with the first meal of the day. The current market products for glimepiride are in tablet dosage form with strength availability as 1-, 2-, 3-, 4-, 6- and 8-mg. Unfortunately, the aqueous solubility values of glimepiride in the literature are not consistent, ranging from partly miscible to < 0.004 mg/mL [3-6]. That was why we set to test its aqueous solubility followed by the exploration of the solubility in different physiological pH media. Since the oral cavity, stomach, and small intestine function as three separate digestive compartments with differing chemical environments, a three-stage in vitro dissolution study is believed to be superior to one stage to answer the scientific questions of this study “How pancreatin may impact the release of a lipophilic drug?”, although one pH stage dissolution contributes in quality control. The statement regarding the quantity of pancreatin and the test solution for the pancreatin to add may be found in USP43-NF38 Intestinal Fluid, Simulated, TS in Reagents and Reference Tables > Solution [7]. This test solution is prepared first by dissolving 6.8 g of monobasic potassium phosphate in 250 mL of water, mix, and add 77 mL of 0.2 N sodium hydroxide and 500 mL of water. Second, add 10.0 g of pancreatin, mix, and adjust the solution with either 0.2 N sodium hydroxide or 0.2 N hydrochloric acid to a pH of 6.8 ± 0.1. Last, dilute with water to 1000 mL [7]. Next, we searched for a protocol how to prepare each stage medium for the three-stage dissolution study and found the required description in Mesalamine Delayed-Release Tablets Monographs [7]. By doing so, the second project aim, which was to determine whether pancreatin impacts a highly lipophilic oral drug using in vitro dissolution study, became feasible. The dosage forms were two commercial glimepiride tablets in two different strengths, 2- and 4-mg. The percent of their in vitro drug release data was next entered an Excel worksheet according to the U.S. FDA Similarity Factor equation to compute into f2 values for comparison [8-10].
Materials
(a) Model Drug and its Commercial Products
Glimepiride (TCI, JPOSL-FH) powder was purchased from VWR (Radnor, PA). Amaryl 2-mg and 4-mg Tablets (Lot FT00, products of Sanofi-Aventis), and Glimepiride 2-mg and 4-mg Tablets USP (Lots P2100682 and P2101988, Products of Accord Healthcare) were purchased from Cardinal Health (Dublin, OH). Amaryl Tablets were coded as Product A, while Glimepiride Tablets USP was coded as Product B.
(b) Reagents and Supplies
Monobasic sodium phosphate (Ward’s Science, AD-20224), phosphoric acid (VWR, 18H104005), acetonitrile (OmniSolv, 59135), tribasic sodium phosphate (Alfa Aesar, 10220493), hydrochloric acid (VWR, 2017062956), sodium hydroxide (EMD, 49124919), pancreatin (Ward’s Science) were purchased from VWR.
Methods
Glimepiride Solubility Study
The Glimepiride aqueous solubility values found from four different literature are not consistent ranging from partly miscible to < 0.004 mg/ml. Besides, “partly miscible” and “very poor solubility” are not the terms used in Solubility Table (Table 1). Therefore, its aqueous solubility was determined first. Ten mg of glimepiride powder was added into a water tank containing 10 liters of purified water with occasional shaking for up to 48 h. Three 10-mL samples were taken from different content locations of the 10-L tank. Sample of 5 mL was transfer into a 10 mL syringe and filtered through 0.2-micron nylon membrane syringe filter prior to being subject to UV-Visible spectrophotometer (Cary 50, Agilent Technologies) and HPLC for analyses. The other 5 mL were kept in culture tube without filtration. All experiments were performed in triplicate.
Glimepiride High-Performance Liquid Chromatography
The HPLC assay was adopted from Glimepiride Tablets Monograph in USP43-NF38, 2022 [7]. Diluent was acetonitrile and water in 9:1 v/v. The stock solution was prepared as 1 mg/mL Glimepiride. Standard solutions for building between day and within-day standard curves were constructed by taking aliquots of stock solution and diluting them with Diluent to prepare into the six standard concentrations between 0.004, 0.02, 0.1, 0.2, 0.5 and 1 mg/mL, and acquired the AUC of each standard concentration. The averaged AUCs of the same standard concentrations (n=3) were construct into a grand calibration plot. However, a shorter standard curve was plotted from 0.004 to 0.1 mg/mL for use in this project due to the low drug strengths (2 mg and 4 mg). The LC systems was Agilent Technologies Series 1260 Infinity consisted of an auto-sampler, a thermostatic column compartment, a degasser, a variable wavelength detector, and a quaternary pump with Chemstation® software). After testing the peak shapes and retention times of three HPLC columns, chromatographic conditions adopting from USP Glimepiride Monograph [7] were eventually set as LiChrosorb RP18 column, column temperature 35°C, injection volume 20 μL, flow rate 1.2 mL/min, detection wavelength 228 nm, run cycle 12 min, dissolving 0.5 g of monobasic sodium phosphate in 500 mL of water, adjusting with 10% phosphoric acid to a pH of 2.1-2.7 and added 500 mL of acetonitrile to mix and serve as mobile phase.
Glimepiride UV-Visible Spectrophotometer
The wavelength ( λmax ) where glimepiride had the highest absorption was determined by scanning the samples taken from the 10 mg glimepiride dissolved in 10 liters of water for 48 h using UV-Visible spectrophotometer (Cary 50, Agilent Technologies). If glimepiride is not soluble in water, these samples would further mixed with acetonitrile in two different ratios (water and acetonitrile in 1:4 and 1:9 v/v) and scanned from 200 to 800 nm to see whether organic solvent aided in glimepiride solubility.
Three-Stage In Vitro Dissolution Study Stimulating Human Gastrointestinal Fluids and Transition Time
Three different performance tests are described in Glimepiride Tablet Monograph USP43-NF38. These tests are similar in: (1) use of Apparatus 2 (Paddle), (2) pH 7.8 phosphate buffer (singe medium stage), and (3) 75 rpm stirring rate at 37.0 ± 0.5°C, but are different in dissolution times (15 min, 45 min, and 20 min respectively) [7,8]. A single medium pH performance test is good for use in QA/QC, but is not possible to assess whether pancreatin influences glimepiride release from a tablet and dissolved in the various simulated gastrointestinal media. Three dissolution stages containing one Acid Stage and two Buffer Stages modified from Mesalamine Delayed-Release Tablets [7]. The rational is that pancreatin should be added in the beginning of Buffer Stage 1 to mimic the enzyme being secreted from the pancreas and discharged from pancreatic duct into duodenum. Glimepiride Tablets Monograph only stated to use the phosphate medium at 7.8 pH, which is not the pH value of Buffer Stage 1 [7]. The 3-stage dissolution test with pancreatin added at the beginning of Buffer Stage 1 used in this study as the experimental group is described briefly as following. The medium preparation for each of the three stages in application to the control group were the same as that of the experimental group except without the addition of pancreatin.
Medium Preparations and Progression of Dissolution Study
The Gastric Fluid – Simulated in Reagents and Reference Tables > Solutions > Test Solutions and Indicator Solutions > Test Solutions only describe how to prepare as pH 1.2 without further information regarding fasting versus fed state. So are the performance tests of several tablet and capsule monographs. Since the smallest volume to set for Distek Dissolution Apparatus was 500 mL, we assumed it was for fasting state. We, thereby, selected 750 mL 0.1 N HCl into a 1-liter dissolution vessel and warmed to 37.0 ± 0.5°C as a medium size postprandial condition. A glimepiride tablet either 2- or 4-mg was placed into the vessel medium. The paddle stirred at 75 rpm for 4 h. At the end of this 4-h, Buffer Stage 1 was initiated by adding 200 mL of 0.20 M Tribasic Sodium Phosphate to adjust the pH to 6.4, while the paddle continued to stir at 75 rpm. For each pancreatin containing group (also called as experimental group, or experimental medium), 10.88 g of pancreatin was added (after 200 mL of 0.20 M tribasic sodium phosphate was added and mixed the 750 mL of 0.1 N HCl well in a dissolution vessel) to simulate the small intestinal fluid when food chyme arrives the duodenum and pancreatin secretion is activated. The color turned from clear to yellowish cloud. Figure 1 used 1-L beaker instead of 1 L of dissolution vessel to display phosphate buffer pH 6.4 after 10.88 g of pancreatin was added as the experimental group. At the end of the 4-h Buffer Stage 1, sodium hydroxide 2 N (that was, 1.04 g NaOH with a sufficient amount of water to make into 50 mL solution) was further added to bring the total medium volume at 1000 mL and pH was 7.4 (Stage 2 Buffer). The dissolution apparatus continued to stir during the Buffer Stage 2 for 16 h to simulate large intestinal pH and transition time.
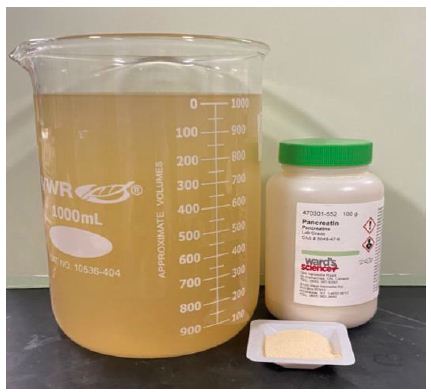
Figure 1: Pancreatin powder in the ordered container with label as well as in a weight boat (right), and the buffer stage 1 medium of an experimental group in the beaker (left). See text.
The sampling schedule was 2 h, 4 h (Acid Stage), 6 h, 8 h (as 2 h and 4 h during Buffer Stage 1, pH 6.4), 9 h, 22 h, and 24 h (at 1 h, 14 h and 16 h during Buffer Stage 2, pH 7.4). Five mL of dissolution medium were collected from each vessel at the designated sampling time and replenished with equal volume of blank (same medium of each stage, but contained no drug). The first 2 mL out of these 5 mL were filtered through a 0.22-micron syringe filter were discarded. The remaining 3-mL was continued to filter through the syringe filter, collected into a culture tube, and capped. One mL of such sample was later placed into a HPLC vial for analysis when a 24-h dissolution cycle ended. The recorded AUCs were converted into concentrations using an prebuilt standard curve averaged out of 3 runs (Section 3.2) and further computed into the dissolved amount (in mg) as well as the percent of drug release. The drug dissolution profiles were constructed with the averaged percent of release (n=3) in the Y coordinate (ordinate) plotted against the dissolution time (in h) in the X coordinate (abscissa).
Tablet Dissolution Study
The feature was a 2 x 2 x 2 factorial design with three main effects. The first number in 2 x 2 x 2 stands for “two payloads 2-mg vs. 4-mg”. The second number stands for “with vs. without pancreatin”. The third number of 2 x 2 x 2 stands for “Tablet Product A and Product B”. A pretest showed all four glimepiride tablets (Products A and B in 2-mg and 4-mg) sank to the bottom of a dissolution vessel after a tablet was dropped into a dissolution vessel. They neither rise nor were hit by stirring paddles during tests. Therefore, no tablet sinker or use of dissolution apparatus 1 (basket method) was required.
Glimepiride Powder Study
Glimepiride powder of 2 mg and 4 mg as controls were subject to in vitro dissolution study using USP Apparatus 2 (Distek Premiere, model, 5100) at 75 rpm, 37.0 ± 0.5°C. The medium preparations between the experimental group and control group, dissolution conditions and sampling schedule were at same as Section 3.4.1.
The U.S. FDA Similarity Factor f2 value
The equation of U. S. Similarity Factor, f2 value used to compare two dissolution profiles is available in Guidance for Industry Dissolution Testing of Immediate Release Solid Oral Dosage Forms as well as M9 Biopharmaceutics Classification System-Based Biowaivers [9-12]. The Similarity Factor f2 value, compared two dissolution profiles at a time using the following formula:
![]() (Equation 1)
(Equation 1)
f2 is the similarity factor;
n is the number of time points;
Rt is the mean percent reference drug dissolved at time t after initiation of the study;
Tt is the mean percent of test drug dissolved at time t after initiation of the study.
Two dissolution profiles are considered similar when the f2 value is ≥ 50.
The evaluation of the similarity factor is based on the following conditions [9]:
- A minimum of three-time points (zero excluded)
- The time points should be the same for the two products
- Mean of twelve individual values for every time point for each product.
- No more than one mean value of ≥ 85% dissolved for any of the products.
- To allow the use of mean data, the coefficient of variation should not be more than 20% at early time points (up to 10 minutes) and should not be more than 10% at other time points.
- Two dissolution profiles are considered similar when the f2 value is ≥ 50. When both test and reference products demonstrate that ≥ 85% of the label amount of the drug is dissolved in 15 minutes, comparison with an f2 test is unnecessary, and the dissolution profiles are considered similar [9-12].
Results
Glimepiride Solubility and Descriptor Determination
After the three samples being collected from the 10-L tank containing 10 mg of glimepiride and 10 L of water which was allowed to dissolve up to 48 h in each experiment (Section 3.1) and subject to HPLC analysis, only a very small drug peak at limit of quantification (LOQ) magnitude out of the three sample injections was recorded (Figure 1a). The retention time of this small peak (Figure 2a) corresponds to that of the glimepiride peaks in a 0.04 mg/mL standard sample (8.6 min, Figure 2c). But the other two samples taken from the 10-L tank containing 10-mg glimepiride in 10-L water that did not show chromatographic peaks, we thereby took 1 mL out of the 5 mL unfiltered sample to dilute with 9 mL acetonitrile and then filtered to examine whether glimepiride was present but not soluble enough in water. A small but clear peak from each of these two injections was recorded (AUC < 3, Figure 2b). The retention times of these peaks also corresponded to the retention time of the glimepiride standard sample chromatogram at 0.04 mg/mL (8.6 min, Figure 2c). All solubility experiments were performed in triplicates.
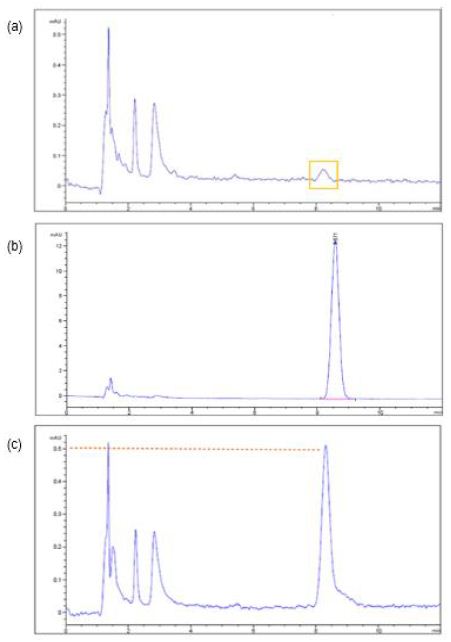
Figure 2: The chromatograms of glimepiride aqueous solubility study illustrated that (a) a very small peak at the limit of quantification (LOQ) was recorded from one out of three sample chromatograms after 10 mg of glimepiride was placed into 10 L of water (no acetonitrile) for 48 h. (b) The drug peak appeared after a sample which did not showed drug peak in Figure (a) was further diluted with 9 parts of acetonitrile. (c) A 0.04 mg/mL standard sample prepared according to compendium LC method which Diluent was acetonitrile and water in 9:1 ratio.
Next task was to determine the term of glimepiride in the Description and Solubility Tablet (Table 1). The glimepiride aqueous solubility may now elucidate as “10 mg (0.01 g) of glimepiride requires more than 10 L (10,000 g) of water to dissolve.” The calculation showed
![]() (Equation 2)
(Equation 2)
Based on one part of solute requires over 1 million part of solvent to dissolve, the descriptive terms in Description and Solubility (Table 1), glimepiride belongs to the category of “practically insoluble in water”.
Table 1: Description and solubility [7]
|
Descriptive Term |
Parts of Solvent Required for 1 Part of Solute |
| Very Soluble |
<1 |
| Freely soluble |
1-10 |
| Soluble |
10-30 |
| Sparingly soluble |
30-100 |
| Slightly soluble |
100-1000 |
| Very slightly soluble |
1000-10,000 |
| Practical insoluble |
>10,000 |
High Performance Liquid Chromatography
A grand standard curve was built based on averaging the AUCs of three individual standard curves from 0.004, 0.02, 0.1, 0.2, 0.5 to 1 mg/mL. Due to the low strengths of the tablets (2 mg and 4 mg) investigated in up to 1 L of dissolution medium in this project, a working range standard curve (containing 0.004, 0.02 and 0.1 mg/mL) was further plotted. The trendline was
AUC=55550 x Concentration (mg/mL) + 2.5394 R²=1 (Equation 3)
In Vitro Dissolution Results of Two Commercial Tablets in Two Strengths
The AUC collected from 7 sampling chromatograms in the 3-stage in vitro dissolution studies of two tablet groups (Products A and B) and 2 strengths (2 mg and 4 mg) were computed into percent of release as Mean ± SD using the aforementioned work range standard curve in Session 4.1 (0.04, 0.02 and 0.1 mg/mL) plus correction factor adjusted for volume withdrawal at each sampling point (Table 2). These percent of release were also plotted against time (in h) into X-Y plot with SD bars (Figure 3). Figures 3a to 3d showed that the percent of glimepiride releases in the experimental groups (pancreatin-containing) were lower than the control groups during the Buffer Stage 2 (pH 7.4 from 9 h to 22 h) in both tablets, Products A and B of the same strength. The differences between experimental and control groups are greater in 2 mg tablets (Figure 3a and 3c) than in 4 mg tablets (Figures 3b and 3d). Furthermore, the release decreased from 22 h to 24 h in the experimental group, but the release increased from 22 h to 24 h in the control group (Figure 3). Bar charts of the glimepiride dissolution in 0-8 h, 8-9 h, 9-22 h, and 22-24 h sampling intervals of Products A and B (not cumulative from 0 h to 24 h) were next constructed into bar charts (Figure 4). The percent increased or decreased in Figure 4 are among the four intervals of 0-8 h, 8-9 h, 9-22 h, and 22-24 h, not like the cumulative percent of release being reported in Figures 3. The FDA Similarity Factor, f2 values, were further computed.
Table 2: Comparison of 24-h in vitro glimepiride release in percent (Mena ± SD, n=3) from 2-mg and 4 mg commercial Tablets A and B (a) 2 mg, and (b) 4 mg without versus with pancreatin added in the beginning of Buffer Stage 1.
| A |
Tab A 2 mg |
Tab B 2 mg |
|||||
| Dissolution Stage |
Time (h) |
Without Pancreatin |
With Pancreatin |
Without Pancreatin |
With Pancreatin |
||
| Acid |
0 |
0 |
0 |
0 |
0 |
||
| (0.1 N HCl) |
2 |
0 |
0 |
0 |
0 |
||
|
4 |
0 |
0 |
0 |
0 |
|||
| Buffer 1 |
6 |
16.6 ± 10.4 |
27.3 ± 16.2 |
31.3 ± 5.0 |
29.1 ± 2.8 |
||
| (pH 6.4) |
8 |
37.4 ± 8.9 |
46.5 ± 5.5 |
36.9 ± 2.6 |
31.2 ± 3.7 |
||
| Buffer 2 |
9 |
112.6 ± 11.9 |
97.9 ± 41.4 |
112.2 ± 13.2 |
69.1 ± 5.7 |
||
| (pH 7.4) |
22 |
119.3 ± 11.8 |
120.5 ± 8.7 |
119.8 ± 13.2 |
106.7 ± 6.2 |
||
|
24 |
111.1 ± 7.8 |
109.9 ± 1.66 |
123.9 ± 12.8 |
76.7 ± 23.5 |
|||
| B |
Tab A 4 mg |
Tab B 4 mg |
|||
| Dissolution Stage |
Time (h) |
Without Pancreatin |
With Pancreatin |
Without Pancreatin |
With Pancreatin |
| Acid |
0 |
0 |
0 |
0 |
0 |
| (0.1 N HCl) |
2 |
0 |
0 |
0 |
0 |
|
4 |
0 |
0 |
0 |
0 |
|
| Buffer 1 |
6 |
16.2 ± 1.3 |
17.3 ± 1.8 |
10.9 ± 1.6 |
10.9 ± 4.0 |
| (pH 6.4) |
8 |
17.6 ± 1.0 |
19.4 ± 1.0 |
17.4 ± 1.8 |
23.0 ± 6.7 |
| Buffer 2 |
9 |
89.8 ± 2.3 |
77.3 ± 19.3 |
90.5 ± 3.6 |
66.9 ± 20.8 |
| (pH 7.4) |
22 |
96.1 ± 4.0 |
101.7 ± 11.6 |
101.1 ± 4.9 |
97.3 ± 7.2 |
|
24 |
102.9 ± 2.6 |
85.9 ± 17.4 |
104.8 ± 7.9 |
90.5 ± 11.6 |
|
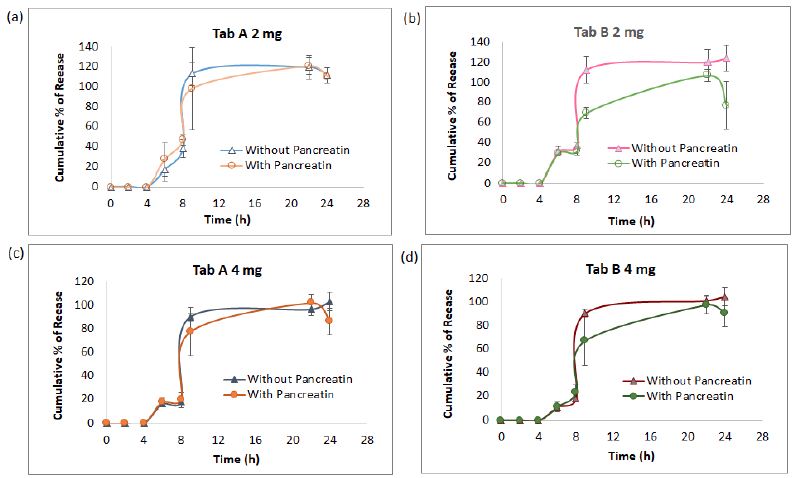
Figure 3: The dissolution kinetic profiles in three medium pH stages of pancreatin and no pancreatin groups diverged at 2-mg strength starting 8 h (a and b) , however, this difference narrowed at 4-mg strength in Product A as well as in Product B (c and d). The most significant point was at 9 h samples, which was 1 h after the medium pH adjusted from 6.4 to 7.4.
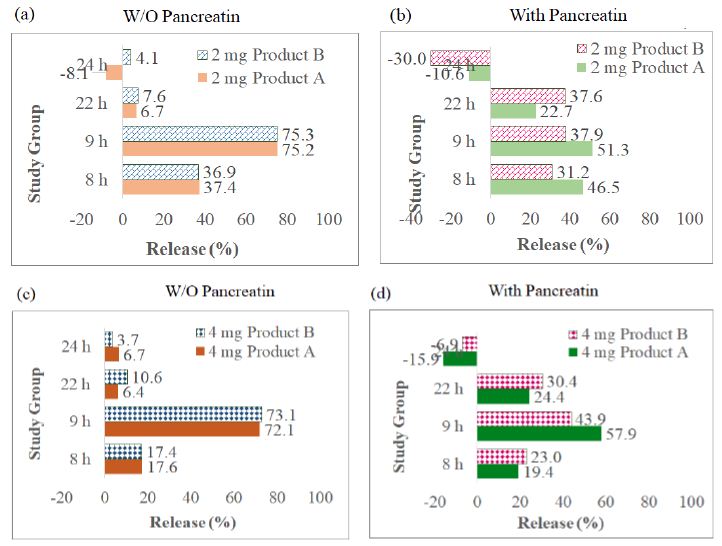
Figure 4: Bar charts of the glimepiride dissolution percent in 0-8 h, 8-9 h, 9-22 h, and 22-24 h, four sampling durations of Products A and B (differed from the cumulative percent in Figure 4): (a) 2-mg tablets (Products A and B) in control group (pancreatin was not added in Buffer Stage 1), (b) 2-mg tablets in experimental group, (c) 4-mg tablets in control group, (d) 4-mg tablets in experimental group.
The USP Similarity Factor, f2 Values
The f2 values which compared two groups of the same strength at a time were computed according to Equation 1 and their results are listed in Table 3. Both Products A and B are FDA-approved products. The experimental group data were plotted as the test group in Equation 1, and the control group data as the reference group. Time point, n, were from 1 to 7. The second column from the left side of Table 3 compared the differences between 2 mg Product A and 2 mg Product B in the control medium (without pancreatin) while the third column compared the 2 mg Products A and B in experimental medium (with pancreatin). The fourth and fifth columns compared the differences of 4 mg Products A and B in control medium (without pancreatin) and in experimental medium (with pancreatin). The results of Table 3 indicated Products A and B are similar in dissolution profiles (all f2 values in seven sampling points were ≥ 50).
Table 3: FDA similarity factor: comparison made between Products A and B while keeping strength and medium preparation the same.
|
2 mg Product A vs. Product B |
4 mg Product A vs. Product B |
|||
|
Time (h) |
WO Pancreatin |
With Pancreatin |
WO Pancreatin |
With Pancreatin |
|
2 |
100.0 |
100.0 |
100.0 |
100.0 |
|
4 |
100.0 |
100.0 |
100.0 |
100.0 |
|
6 |
73.5 |
74.3 |
83.3 |
83.3 |
|
8 |
68.6 |
69.9 |
77.3 |
75.6 |
|
9 |
60.8 |
64.3 |
65.2 |
66.9 |
|
22 |
57.3 |
59.9 |
60.6 |
61.7 |
|
24 |
55.3 |
58.5 |
58.1 |
59.4 |
Product A as test tablet, while Product B as reference tablet
In Vitro Dissolution Results of Drug Powder in Pancreatin Presence vs. Not Presence
We desired to find out whether the drug released from commercial tablets and present in the dissolution medium containing pancreatin was impacted by the excipients incorporated into making tablets. In this section, we took 4 mg of glimepiride powder into a dissolution vessel to conduct 3-stage dissolution study as the procedures described in Section 4.3 for commercial tablets. The resultant XY plots of glimepiride drug powder dissolution is listed as Figure 5. For the experimental group, HPLC did not record AUC during Acid Stage and Buffer Stage 1 until the glimepiride (drug powder alone) dissolved in Buffer Stage 2 medium for 22 h, which was much slower (Figure 5) than the commercial tablet or commercial tablets about 20-25% were released and dissolved by the end of Buffer Stage 1 (8 h, Figure 3). In the experimental group, glimepiride powder dissolved 29.8 ± 4.9% at 22 h, but decreased to 25.90 ± 6.5% at 24 h when pancreatin was added in the beginning of Buffer Stage 1. In the control group (without pancreatin), glimepiride powder dissolved was 30.5 ± 6.7% at 22 h and further increased to 30.8 ± 7.1% at 24 h (Figure 3). Never the less, t-test indicates this difference in the 24 h samples between the experimental and control groups was not significant (p=0.46) reflecting the solubility of glimepiride drug powder was very low in 0.1 N HCl as well as in phosphate buffer pH 6.4.
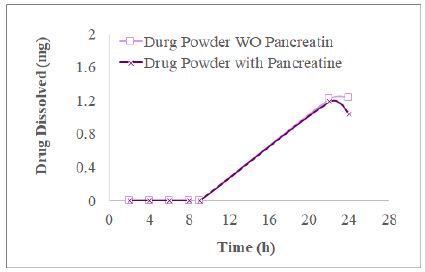
Figure 5: The profiles of 4 mg glimepiride powder in three stage dissolution study displayed that the glimepiride release amount decreased from 22 h to 24 h in the group with pancreatin being added in Buffer Stage 1, but not in the control group (no addition of pancreatin) (n=3).
Checking for wavelength other than 228 nm in Buffer Stage 2 (pH 7.4 Phosphate Buffer) Containing verses Not Containing Pancreatin
The experimental medium (containing pancreatin) of Products A and B showed the trend of the percent of glimepiride decreased from 22 h to 24 h dissolution samples, we further subjected the 24 h glimepiride powder dissolution sample containing pancreatin to UV Spectrophotometric scans. The results confirmed that there were absorbance in the experimental group (containing pancreatin) at 235 nm and 240 nm in addition to the drug peak at 228 nm. We next inject the 24-h drug powder experimental samples to HPLC after syringe filtration. An unidentified peak was recorded at 235 nm and 240 nm, respectively (Figures 6a and 6b).
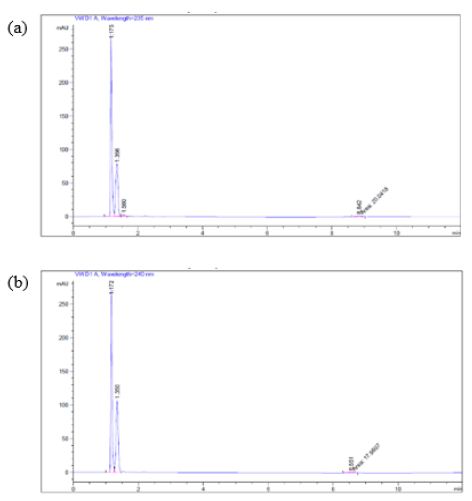
Figure 6: When a 24-h sample (pH 7.4) was subjected to HPLC using (a) 235 nm, and (b) 240 nm as suggested by UV spectrophotometric scans, a small unidentified peak was recorded at the retention time of 8.8 min (a) and 8.55 min (b) respectively.
Discussion
Standard Preparations of Glimepiride Monograph and Glimepiride Tablets Monograph
The standard preparations in Glimepiride Monograph and Glimepiride Tablets Monograph in USP-NF 2022 are different. The Diluent to prepare Glimepiride standard solution is described as acetonitrile and water (4:1), while the Diluent prepared sample solution in Glimepiride Tablets Monograph Assay is acetonitrile and water (9:1). Furthermore, in the same monograph, the diluting solution for sample solution in the Dissolution Test 1 is methanol and water (1:1), while the preparation of standard solution is described as acetonitrile, methanol and water. The problem lies on that sample solution in the compendium contains only one organic solvent (acetonitrile), while the standard solution contains two organic solvents (methanol and acetonitrile). Because of so, we kept the diluent between sample solution and standard solution the same, acetonitrile and water in 9:1. The dissolution medium of this project contained no emulsifying agent or organic solvent. Surfactants belong to a family of emulsifying agents [13]. Pancreatin tested in this project is a commercial grade digestive enzyme containing lipase, not an emulsifying agent. Bile juice which was not studied in the project is known to contain surfactant. The mobile phase followed the description in Glimepiride Tablets [7] also contained no emulsifying agent.
Excipients in Two Commercial Tablets
The inactive ingredients (also called as excipients) and pharmaceutical functions of Product A and Product B are listed in Table 4. Both Excipients NF and Handbook of Pharmaceutical Excipients [14] regard sodium starch glycolate as a disintegrant. They do not regard sodium starch glycolate as an emulsifying agent(s) for glimepiride. Since glimepiride powder has been proven as a practically insoluble drug in the early phase of this project. Further, the three-stage 24 h dissolution studies displayed that after glimepiride powder underwent 2 h of 0.1 N HCl (acid stage), 4 h of Buffer Stage 1 and 16 h of Buffer stage 2, it only yielded 30.8 ± 7.1% of drug release in the control group (no pancreatin added in Buffer Stage 1), and 25.9 ± 6.5% for the (pancreatin containing) experimental medium group for the same time point (Figure 5). We, thus, further asked what inactive ingredient(s) made the glimepiride of commercial tablets dissolve completely at the ends of 24-h in vitro tests (Figure 3). Emulsifying agents may be divided into carbohydrates, proteins, high molecular weight alcohols, surfactants, and solids [13]. Since none of the excipients in the two studied tablets of this project is regards as emulsifying agent (Table 3) it is fair to speculate that the increase in glimepiride solubility was due to the presence of disintegrants added during tablet manufacturing. Product A contains two disintegrants (sodium starch glycolate and microcrystalline cellulose), while Product B contains one disintegrant (sodium starch glycolate – grade A). There was no detectable glimepiride dissolved during the 4-h Acid Stage window (Figures 4a to 4d). Figure 5 further displayed that the solubility of 2 mg Product A without pancreatin incremented from 0% to 17.6 ± 1.0%, and 4 mg Product A without pancreatin incremented from 0% to 37.4 ± 8.9% during the 4-h Buffer Stage 1 window (from 4 h to 8 h in pH 6.4). The highest dissolution rate occurred between 8 h to 9 h which was one hour after pH was adjusted to Buffer Stage 2 (from pH 6.4 to pH 7.4). For the 4-mg control groups, Product A was from 17.6 ± 1.0% to 89.8 ± 2.3%, and Product B was from 17.4 ± 1.8% to 90.5 ± 3.6%. However, from 8 h to 9 h in pancreatin-containing group was lower than the control groups of the same product and same strength (Figure 4). For the 4-mg with pancreatin group, Product A was from 19.4 ± 1.0% to 77.3 ± 19.3%, and Product B was from 23.0 ± 6.7% to 66.9 ± 20.8%. The glimepiride dissolution was further increased from 9 h to 24 h in the control group without pancreatin (Figure 4 blue curves). In the pancreatin-containing group glimepiride also dissolved from 9 h to 22 h, but declined between 22 h to 24 h (Figure 4 orange curves). This in vitro prediction possibly differs from in vivo outcomes in three aspects. First, in vitro dissolution stirring rate was set at 75 rpm for the entire 24 h to simulate the fed state, while in vivo bowel peristalsis is slower than 75 rpm, but has a longer duration than 24 h (up to 48 h to 72 h from the stomach to the colon depending on the diet and fat composition in food) prior to the elimination of the indigestible food residues. Second, in the in vivo condition, in addition to the endogenic bile salt released from the gall bladder, emulsifying agents may come from vegetable hydrocolloids and animal derivatives, such as lecithin and cholesterol. This in vitro project did not add any emulsifying agent into any of the three dissolution stage. Neither did Glimepiride Dissolution in USP-NF and FDA Database suggest so. The main aim was to explore how pancreatin in dissolution medium affects a highly lipophilic drug. Third, population variation (gender, sex, age) plus social, psychologic, and economic behaviors are not easy to simulate correctly in an in vitro study.
Table 4: Excipients of the Products A and B
|
Function |
Product A |
Product B |
|||
| Glimepiride | API |
2 mg |
4 mg |
2 mg |
4 mg |
| Lactose (Hydrous) | Binder, Diluent |
√ |
√ |
||
| Lactose Monohydrate | Binder, Diluent |
√ |
√ |
||
| Sodium Starch Glycolate | Disintegrant |
√ |
√ |
||
| Sodium Starch Glycolate (Type A Potato) | Disintegrant |
√ |
√ |
||
| Povidone | Binder |
√ |
√ |
√ |
√ |
| Microcrystalline Cellulose | Diluent, Disintegrant |
√ |
√ |
||
| Magnesium Stearate | Lubricant |
√ |
√ |
√ |
√ |
| Ferric Oxide Yellow | Coloring Agent |
√ |
√ |
||
| FD&C Blue #2 Aluminum Lake | Coloring Agent |
√ |
√ |
√ |
√ |
Specific Binding and Non-specific Binding
Glimepiride is a lipophilic, small molecule chemical compound, not a lipid. The lipase enzyme as a part of pancreatin mixture. Since glimepiride is not a lipid, we do not expect the lipase in pancreatin may digest it, but the data showed that glimepiride in the dissolution medium containing pancreatin decreased from 22 h to 24 h. Judging from the data, pancreatin is speculated to function as a carrier molecule for glimepiride (substrate) to adsorb on its surface starting from the time that pancreatin (a digestive enzyme, a protein) was added in Buffer Stage 1. Such an enzymatic binding is non-specific and substrate (glimepiride) concentration dependent (Figure 3). When the binding is not specific, glimepiride may leave the pancreatin binding site and return to bind in the intestinal lumen during the process of transition down from the stomach into the intestine just like albumin functions as a nonspecific binding carrier for lipophilic drugs in the circulation. As to how many binding sites a pancreatin molecule has, and which is a strong binding site or weak binding site will need to be further investigated by isotope-labeled binding assays or other technology, such as simulation. Data indicated that the nonspecific binding occurs between pancreatin and glimepiride supported by the lower dissolution profile in the pancreatin containing medium group, especially at 9 h sample. If possible, we recommend (1) add another dissolution sampling point between 9 h to 22 h; (2) evaluate whether the nonspecific binding is substrate concentration dependent; and (3) determine whether the decrease of glimepiride percent from 22 h to 24 h is caused by digestion or by hydrolysis degradation at pH 7.4.
Checking the Wavelengths of Potential Glimepiride Degradants
After UV spectrophotometric wavelength scans of 24-h glimepiride tablet dissolution medium containing pancreatin showed absorbance at 235 nm and 240 nm in addition to the drug (glimepiride) absorbance at 228 nm, endeavors to further explore these two absorbance were made. USP Reference Standards Catalog, as well as Glimepiride monography, was consulted first. There are glimepiride-related compounds A, B, C, and D. Compound A is a glimepiride cis-isomer. Compound B is glimepiride sulfonamide. Compound C is glimepiride urethane. Compound D is a glimepiride 3-isomer. To find out whether these compounds are related to the peaks seen in 235 nm and 240 nm, more studies may be conducted to investigate whether any of these four compounds are related to the compounds whose peaks were seen at 235 nm and 240 nm.
Project End Points of FDA Similarity Factor f2 Values
Dissolution profiles may be considered similar by virtue of (1) overall profile similarity, and (2) similarity at every dissolution sample time point. The dissolution profile comparison may be carried out using model independent or model dependent methods. [11] For model independent method, a difference factor (f1) and the more commonly used, a similarity factor (f2) may be used. Please refer to Guidance for Industry Dissolution Testing of Immediate Release Solid Oral Dosage Forms for (1) Model Independent Multivariate Confidence Region Procedure and (2) Model Dependent Approaches. Tablet 3 reported the Similarity Factor, f2 values of this project followed the conditions of the evaluation of the US FDA Similarity Factor in model independent approach. These conditions may be found in a Methods section (Section 4.4). For example, (1) zero time point was excluded, (2) time points were the same for the two products, (3) the used of mean data which the coefficient of variation were not more than 20% at early time points (up to 10 minutes) and were not more than 10% at other time points, (4) the mean percent dissolved in ≤ 15 minutes were also not ≥ 85. If the computation of f2 to follow the condition of “No more than one mean value of ≥ 85% dissolved for any of the products” instead of the computation made to the entire dissolution duration, (that is 24 h for this project), it should end at 9 h to determine the profile similarity and difference between a test product and a reference product. In this study, the first f2 comparison was Product A as the test product and Product B as the reference product (Table 3). The rationale is that by then there was one mean value of ≥ 85% dissolved for any of the products had reached. Based on 2004 USP dissolution workshop and 2019 Dissolution Similarity Workshop, dissolution is a critical tool for the evaluation of generic drug products. The Similarity Factor, f2 value is useful to reject or support waiver request. However, challenges are present [12].
Conclusion
The solubility of glimepiride is clearly pH dependent. Among the four studied medium, water, 0.1 N HCl, pH 6.4 and pH 7.4 phosphate buffers, glimepiride is practically insoluble in the first two (water and 0.1 N HCl), while is soluble in phosphate buffers. Glimepiride, the model drug, was not found decomposed when the three-stage dissolution medium contained no pancreatin, but decomposed slightly in both pure powder form as well as the studied commercial tablets from 22 h to 24 h. According to the results, the kinetics of lipophilic drugs are impacted by the release of digestive enzymes with meal consumption. This is most likely caused by the drug’s non-specific binding to substrates (pancreatin in this case). This conclusion was supported by the substantial decrease of the soluble fraction of glimepiride simultaneously during Buffer Stage 2 (pH 7.4, 8 h to 24 h) after pancreatin was added in the beginning of Buffer Stage 1 (4 h after acidic stage). We recommend that the role of pancreatin, a digestive enzyme, in the in vitro dissolution be investigated through the uses of other drug substance and formulation products.
References
- N’Goma JB, Amara S, Dridi K, Jannin V, Carrière F, et al. (2012) Understanding the lipid-digestion processes in the GI tract before designing lipid-based drug-delivery systems. Therapeutic Delivery 3: 105-124. [crossref]
- Chatterjee C, Sparks DL (2011) Hepatic Lipase, High Density Lipoproteins, and Hypertriglyceridemia. Am J Pathol 178: 1429-1433. [crossref]
- Chaudhari M, Sonawane R, Zawar L, Nayak S, Bari S (2012) Solubility and dissolution enhancement of poorly water soluble glimepiride by using solid dispersion technique. Int J pharmacy and pharmaceutical science 4: 534-539.
- Du B, Shen G, Wang D, Pang L, Chen Z, et al. (2013) Development and characterization of glimepiride nanocrystal formulation and evaluation of its pharmacokinetic in rats. Drug Delivery 20: 25-33. [crossref]
- Lestari M, Indrayanto G (2011) Glimpiride in Profiles of Drug Substances, Excipients and Related Methodology, Surabaya, Indonesia. Academic Press 169-204.
- Li H, Pan T, Cui Y, Li X, Gao J, et al. (2016) Improved oral bioavailability of poorly water-soluble glimepiride by utilizing microemulsion technique. Int J Nanomedicine 11: 3777-3788. [crossref]
- S. Pharmacopeial Convention 2022. USP Monographs: Mesalamine Delayed-Release Tablets; Reagents and Reference Tables > Solutions > Gastric Fluid, Simulated, TS; Intestinal Fluid, Simulated, TS; Reagents and Reference Tables > Reference Tables > Description and Solubility; and General Chapters: <711> Dissolution. In: USP43-NF38. Rockville MD: U.S. Pharmacopeia, pg: 2805, 6234, 6230, 6945.
- Brodkorb A, Egger L, Alminger M, Alvito P, Assunção R, Balance S, et al. (2019) INFOGEST static in vitro simulation of gastrointestinal food digestion. Nature Protocols 14: 991-1014. [crossref]
- Guidance for Industry Dissolution Testing of Immediate Release Solid Oral Dosage Forms.
- M9 Biopharmaceutics Classification SystemBased Biowaivers Guidance for Industry.
- Kakade A (2022) Dissolution Analyses: Comparison of Profiles Using f2 Analysis Calculation. EG Life Sciences.
- Shah VP, Tsong Y, Sathe P, Williams RL (2022) Dissolution Profile Comparison Using Similarity Factor, f2. Office of Pharmaceutical Science, Center for Drug Evaluation and Research, Food and Drug Administration, Rockville, MD.
- Shrewsbury RP (2020) Applied Pharmaceutics in Contemporary Compounding. Morton, 4th ed., pg: 198.
- Sheskey P, Hancock B, Moss G, Goldfarb D (2020) Handbook of Pharmaceutical Excipients. London: Pharmaceutical Press, 9th ed.