Abstract
Objective: To determine 1) the most effective loading of the bioactive glass in a prophylactic polishing paste containing Bioactive glass particles that provides a more effective tubular occlusion and 2) the ideal application time required to achieve this objective using an in-office rotary cup with a fixed pressure and speed.
Materials and Methods: 60 dentine discs were divided equally into 15 groups treated with 0%, 5.0%, 15.0% and 25.0% bioactive glass loading respectively and Nupro® at different applications (30, 60 and 120 seconds). Dentine permeability (Percentage flow rate) of each specimen was measured using a modified Pashley hydraulic conductance model at four different time points: (1) before toothpaste application, (2) after toothpaste application, (3) after saliva immersion and (4) after an acid challenge. Data were analysed by ANOVA to determine whether there were any significant differences with the control group (Nupro®) compared to the test groups at three different time intervals (30, 60 and 120 seconds). 20 dentine discs were analysed to observe the surface tubular occlusive effect following application of the various loadings at different times using scanning electron microscope (SEM).
Results: There was an increased percentage fluid flow rate (FR) reduction with increasing bioactive glass loading (0.0%, 5.0%, 15.0%, 25.0%) compared to the control material Nupro®. The 25% bioactive glass loading was the most effective in reducing fluid flow at the various time points although there were no significant differences between the 15% and 25% glass loading. The 25.0% bioactive glass loading at 120 seconds also demonstrated effective tubular occlusion compared to the control prophylaxis paste. A comparison between the control and the various glass loadings at the various time points using SEM demonstrated increasing tubule occlusion with increasing time of application. Tubular occlusion also increased following artificial saliva immersion but decreased following an acidic challenge.
Conclusions: Increasing the bioactive glass loading resulted in a greater fluid flow rate reduction with an increase of time of applications. Overall, the most effective application was with the 25% loaded bioactive glass at 120 seconds although the application of the 15% loaded bioactive glass prophylaxis paste for 30 seconds demonstrated effective tubular occlusion and fluid flow reduction.
Keywords
Bioactive glass, Desensitising polishing pastes, Tubular occlusion, Hydraulic conductance
Introduction
According to Hench 45S5 bioactive glass was developed as a bone ceramic [1] which was also used to improve periodontal bone regeneration in bony defects caused by periodontal disease-(PerioGlas®) [2]. Several investigators [3-6] have also evaluated a bioactive glass (45S5) as a desensitizing toothpaste without fluoride. More recently bioactive glass-based toothpastes have been developed for over the counter (OTC) products. These products include NovaMin® (GlaxoSmithKline [GSK]) containing fluoride and BioMinF™ (Biomin Technologies Ltd) although the surface deposits on the exposed dentine are different with. NovaMin® producing a hydroxy carbonate like apatite (HCA) layer whereas BioMinF™ provides a fluoroapatite layer, which is more resistant to an acid challenge [7]. Bioactive glass (45S5) has also been incorporated into a prophylactic polishing paste (in-office dental procedure) to remove stain and reduce dentine hypersensitivity (DH) (Nupro®). Previously there were limited published data regarding the ideal loading concentration of bioactive glass into either toothpaste or polishing paste formulations although Tie et al. [8] reported that a 5% glass loading was the ideal concentration for a toothpaste formulation. Sauro et al. [9] compared dentine permeability in vitro for both prophylactic and air-polishing procedures and concluded that a Sylc bioactive glass (Sylc™; OSspray, London, UK) was more effective in reducing dentine permeability in both the polishing paste and air-polishing systems compared to the controls. Milleman et al. [10] compared a Nupro® Sensodyne prophylaxis paste with Novamin® for the treatment of DH in a 4-week clinical study and concluded that the reduction in DH was statistically significantly compared to the group receiving a standard prophylaxis paste. No differences were, however detected between the two NovaMin® polishing pastes with and without fluoride. Neuhaus et al. [11] also conducted a double-blinded randomised clinical trial and concluded that a 15% NovaMin® loading with and without fluoride had the same immediate DH effect for 28 days following root surface debridement (RSD). A systematic review by Zhu et al. [12] concluded that the prophylaxis paste containing 15% calcium sodium phosphosilicate was favoured over the negative control at reducing post-periodontal therapy DH (root sensitivity), although the level of evidence was categorized as “low”.
Aim
The aim(s) of the present study, therefore, was to 1) to determine the most ideal loading for a bioactive desensitising polishing paste with the most tubular occlusion and 2) to determine the effect of the application time (30s, 60s, 120s) and the effect of an acidic challenge on each of the experimental bioactive glass prophylactic polishing pastes with the percentage of loading (0%, 5%, 15%, and 25%).
Materials and Methods
This exploratory study was based on two objectives. The first part of the study was designed to choose the ideal abrasivity of the pumice that would be incorporated into prophy-paste formulations using white light profilometry has been previously described by Hussain et al. [13]. The second part of the study evaluated selected pastes to determine their effectiveness in tubular occlusion using scanning electron microscopy (SEM) and hydraulic conductance (Fluid flow) techniques and is the focus of this paper.
Preparation of Materials
Collection of Teeth
A total of 120 extracted, caries free human premolars and molars were collected from the walk-in dental polyclinics from Kuwait in 2017 after obtaining verbal consent from patients for the use of their teeth in research. The teeth were stored in a small container of Listerine mouthwash (Johnson and Johnson, UK) and brought to the UK by Hamad Hussain (HFH) under QMUL guidelines UK. The teeth were transferred and stored in a 70% concentration Ethanol solution in a specimen container at room temperature within the Department of Dental Physical Sciences Unit at Mile End, London in accordance with HTA regulations.
Preparation of Mid Coronal Dentine Sections
90 non-carious human premolars, and molars were selected and prepared into dentine disc specimens of 1.2 mm thickness as described by Tie et al. [8] using an automatic precision cutting machine (Struers Accutom 5, Denmark). The dentine discs were then ground using a Kemet 4 machine (Kemet Maidstone Kent ME15 9NJ UK) followed by polishing with three different silicon carbide papers in a descending order of abrasive coarseness, starting from carbide paper grade P600, P1000 to P2500. The polishing was considered complete when the discs were polished to a thickness of 1.0 mm. The thickness of the discs was monitored constantly using a digital micrometer to avoid over polishing.
Etching of Dentine Sections
The etching of dentine discs was performed prior to using the discs for the experimental steps. This was performed by immersing the discs into 6% w/w citric acid solution for two-minutes. The discs were ultrasonicated with deionized water in an ultrasonic bath for 30 seconds to remove any residual acid using the methodology described by Tie et al. [8].
Artificial Saliva Preparation
Artificial saliva was prepared using the following constituents: 2.24 grams of KCl, 1.36 grams of KH2 PO4, 0.76 grams NaCl, 0.44 grams of CaCl2 .2H2 O, 2.2 grams of porcine Mucin and 0.2 grams of NaN3 (all Sigma-Aldrich, UK) which was mixed with 800 grams of deionized water in a 1 litre volumetric flask. The mixture was stirred using a magnetic hotplate stirrer for 30 minutes until all reagents were fully dissolved. The mixture’s pH was then adjusted to 6.5 at room temperature using a pH meter (Oakton, Netherlands) by adding 0.5 M of KOH sequentially until the desired pH was obtained. Separately, 0.5 M of KOH was previously prepared by mixing 1.40 grams of KOH (Sigma-Aldrich, UK) in 50 ml deionized water. The final mixture was made up with deionized water to 1 litre. The produced artificial saliva solution was kept in a fridge set at 5°C until required and used within 2 weeks of preparation [8].
Preparation of the Prototype Bioactive Glass Polishing Paste
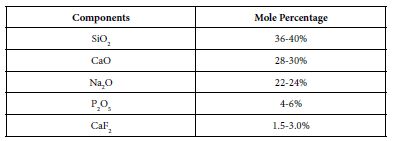
The bioactive glass used in the prophy-paste formula was BioMin F which was manufactured by Cera Dynamics Ltd Stoke UK and is the same glass powder used by Biomin Technologies Limited, UK in toothpaste formulations. The composition of the Bioactive Glass is shown in Table 1. The material was stored at room temperature in a closed dry container until required.
Table 1: Composition of the Bioactive Glass used in the prophy paste
Preparation of the Prophylaxis Polishing-Paste for the Different Bioactive Glass Loading
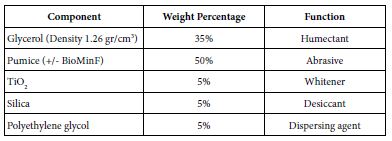
The composition of prophy-paste components that was prepared in the laboratory was based on the components’ range of the Safety Data Sheet number 801363 of Nupro® Sensodyne® Prophylaxis Paste with Novamin® (GSK). Initially this consistency (viscosity) of this formula was poor and therefore the formula was modified as shown in Table 2. Materials were measured separately, and mixed using a metal spatula, and then stored at room temperature until required.
Table 2: Composition of both loaded and unloaded prophy-paste to produce 90 grams that was used during the main study
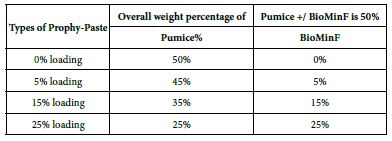
The final loading percentages of both the formulated Biomin prophylaxis polishing paste and pumice control are shown in Table 3.
Table 3: Loading percentages of both the formulated Biomin prophylaxis polishing prophy-paste and pumice control
Methodology
Preparation of Samples and Procedures
The experimental sample was composed of 60 teeth that were adequately prepared on the dentine discs following a specific protocol before starting the experimentation.
Scanning Electron Microscopy
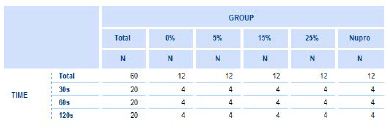
15 out of 20 etched stored dentine discs were used in this study. A prophylaxis polishing-paste was applied on the discs at the different proportions of the bioactive glass (0%, 5%, 15%, 25% and, Nupro® control) and for the different times (30s, 60s, 120s) using a portable prophylaxis polishing handheld device (Table 3). Three-dentine discs were assigned for every prophylaxis polishing-paste group. Each disc was fractured into equal halves using orthodontic pliers to provide two sections. One dentine disc was used for (1) untreated control and (2) treated with a prophy-paste for 30 seconds. The second one was used for (3) treated with the same prophylaxis polishing-paste for 60 seconds and (4) treated with the same prophy-paste for 120 seconds. The third dentine disc that was halved was used for (5) treated with the same prophylaxis polishing- paste, salivary immersion, and one-minute in an acid challenge and (6) treated with the same prophylaxis polishing-paste, salivary immersion and a two-minute acid challenge. The five groups were tested using the same protocol. The same process was also used when treating the dentine discs for hydraulic conductance procedure (Table 4).
Table 4: The number of discs by percentage (%) glass loading and the time of application
Prior to the SEM analysis and visualisation, the specimens were prepared for drying, mounting, and coating. After applying the treatment to all specimens, they were placed in a vacuum desiccator to dry. Each specimen was then mounted on a metal stub using double sided carbon tape. Finally, the specimens were coated with gold-palladium using a sputter coater. After the specimens were prepared by the three above steps, they were visualised using SEM (FEI Inspect F SEM, USA) at different magnification of x1000 and 10,000. The working distance, which is the distance between the specimen and the source beam was maintained at a fixed 10mm) for all the specimens with a working voltage at 20kV [6].
Hydraulic Conductance (FRR Values)
Based on the design developed by Outhwaite, et al. [14,15], a modified Pashley hydraulic conductance was used in the study to measure dentine permeability (Lp).
45 teeth (molar) were used for the evaluation of hydraulic conductance (Lp) following initial immersion in 6% citric acid for two minutes, teeth were divided into the test groups (1, 2 and 3). Baseline fluid flow (FR) measurements were recorded prior to the application of the test and control prophylaxis polishing pastes at the designated timings and loadings. Following application of the designated prophylaxis polishing paste and timings the discs were rinsed in deionised water for 10 seconds and placed in the modified Pashley conductance system and FR measurements were recorded. All teeth were subsequently immersed in 10ml of artificial saliva for 30 seconds, rinsed and immersed in 30ml of 6% citric acid for one and two minutes and a final set of FR measurements were recorded. The teeth were subsequently air dried and prepared for SEM evaluation (500x, 1000x, 5000x and 10,000x magnification)
Analysis of the dentinal permeability measurement was conducted as follows [8]:
a) Percentage flow reduction after treatment with the polishing paste.
![]()
b) Percentage flow reduction after treatment with the polishing paste and immersion in artificial saliva.
![]()
c) Percentage flow reduction after treatment with polishing paste, immersion in artificial saliva and acid challenge.
![]()
where V0 = Dentine permeability at baseline (after acid etch)
V1 = Dentine permeability immediately after polishing paste application
V2 = Dentine permeability following immersion in artificial saliva
V3 = Dentine permeability following acid challenge
Statistical Analysis
Mean, standard deviation with 95% C.I.: for each variable was assessed. for the total sample used in the explorative study. A one- way ANOVA was estimated to compare flow rate, FR, means between the different loading groups at a specific time of application as well as assessing the effect of time of application for a specific loading of the bioactive glass. Bonferroni´s post-hoc test was used as a multiple comparison test, to control the propagation of a Type-I error. A two- way ANOVA with between subjects’ factors, the loading group and time of application was also used to explore the interactions and obtain the overall conclusions regarding the effect of both factors. In view of the low numbers of disks used in this explorative study a complementary non-parametric Brunner-Langer model was employed Distributions (not means) of FR rates were compared using an ATS-test (ANOVA-type).
Results
The permeability of the dentine tubules in the dentine discs was tested and previously established as a laboratory technique to measure the fluid rate reduction using hydraulic conductance [14,15]. The reduction of the fluid flow at the three different experimental applications (FR1 after application, FR2 after immersion in saliva, FR3 after an acid challenge) on a disc at the different loading of the bioactive glass from 0.0%, 5.0%, 15.0%, to 25.0% is shown in Table 4 and Figures 1-3 respectively. The effect of application time (30s, 60s and 120s) vs. % loading, immersion in saliva, following an acid challenge was also analysed. For example, following polishing the dentine disc for one minute, there was a gradual pattern in the percentage fluid flow reduction. The pattern of the reduction did not however exist at 0% to 5% although it showed a steady increase in Lp. There was however a significant change in the pattern increasing the reduction’s flow once the glass loading was more than 15% (at 25% loading) It was clear that after applying the prophylaxis polishing-paste for a minute, the fluid flow was reduced. There was slightly more reduction after immersing the disc in artificial saliva for an hour. Whereas a two-minute acidic challenge increased the fluid flow (Table 5).
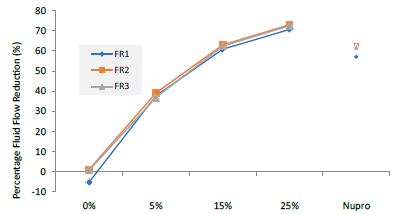
Figure 1: Comparison of flow rates reduction by Group (application: 30 seconds)
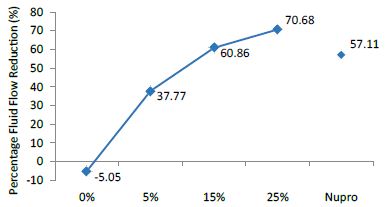
Figure 2: Flow rate reduction FR1 values by the loading group after paste application at time=30s
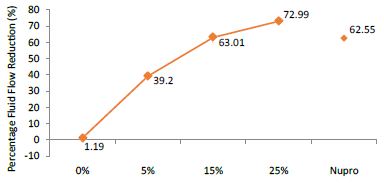
Figure 3: Flow rate reduction values (FR2) by loading group following saliva immersion (time=30s)
Table 5: Flow rates reduction by Group (application time: 30 seconds)
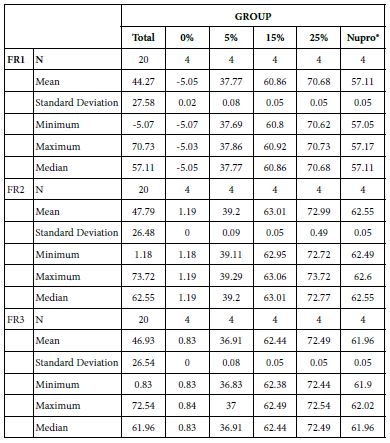
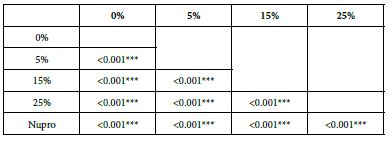
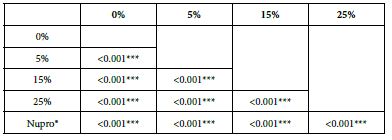
Analysis of the selected loading at 30 seconds using ANOVA (p<0.001) and Bonferroni´s test can be observed in Table 5. The 25% Bioactive glass loading provided significantly more reduction than any other concentration (p<0.001). The same analytical methodology was employed throughout the study (Table 6).
Table 6: FR1 values by loading group at the time of application=30 s: results of multiple comparisons by Bonferroni´s test
FR2: After Saliva Immersion
The FR mean was 1.19 ± 0.00% if no bioactive glass was incorporated into the prophy-paste. With the 5%- glass loading the mean increased to 39.20 ± 0.09%. Higher loading levels (15% and 25%) involved new increments to 63.01% ± 0.05 and 72.99 ± 0.49%. The fluid flow reduction of the Nupro® solution values increased to 62.55 ± 0.05%. Therefore, the optimal tubular occlusion occurred using a 25%-loading of the Bioactive glass (Figure 3).
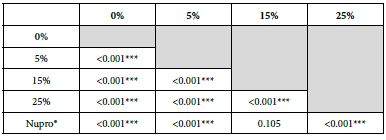
Analysis of the selected loading following saliva immersion using ANOVA (p<0.001) and Bonferroni´s test can be observed in Table 6. There were significant differences between the groups. Loading at 25% was the most effective. Nupro® had similar values to a 15% glass loading of bioactive glass (Table 7):
Table 7: FR2 values by loading group at the time of application=30 s: results of multiple comparisons Bonferroni´s test
FR3: After an Acid Challenge
The FR mean was 0.83 ± 0.00% if no bioactive glass was incorporated into the prophy-paste. With a 5%-proportion of glass the mean increased to 36.91 ± 0.08%. At the higher loading levels (15% and 25%) the FR reduction increased to 62.44% ± 0.05 and 72.49 ± 0.05% respectively. The Nupro® solution FR value was 61.96 ± 0.05%. Therefore, the optimal tubular occlusion took place using a 25%-loading of Bioactive glass (Figure 4).
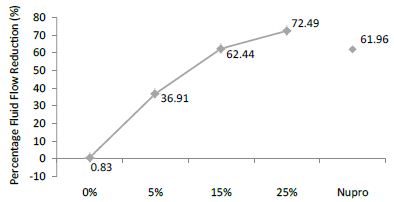
Figure 4: Flow rate reduction values (R3) by loading group after an acid challenge at time=30s
Analysis of the selected loading following saliva immersion using ANOVA (p<0.001) and Bonferroni´s test can be observed in Table 7. There were significant differences between the groups. Loading at 25% was the most effective.
Analysis of FR at Time of Application=60 s
The following Table 8 and Figure 5 show the basic statistics of fluid flow reduction, FR, values over the experiment period after 60s of paste application (Table 9):
Table 8: FR3 values by loading group at the time of application=30 s: results of multiple comparisons Bonferroni´s test
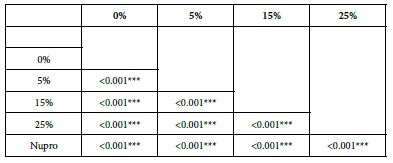
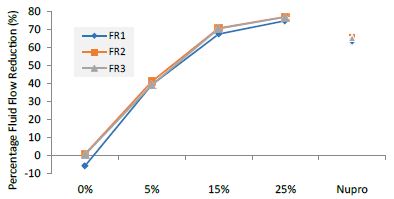
Figure 5: Flow rate reduction values by loading group at the time of application=60s
FR1: After Prophy-Paste Application
The FR mean was -5.74 ± 0.02% if no bioactive glass was incorporated into the prophy-paste glass. With the 5%-loading, this reduction increased to 39.39 ± 0.09%. At the higher loading levels (15% and 25%) the FR reduction values increased to 67.53% ± 0.05 and 74.94 ± 0.04% respectively. The Nupro® solution FR values were 63.20 ± 0.05%. The 25%-loading of bioactive glass provided the maximum tubular occlusion values (Figure 6).
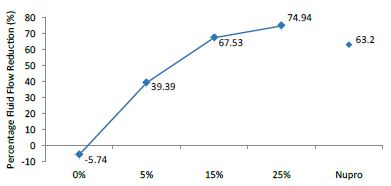
Figure 6: flow rate FR1 reduction values by loading group after paste application at time=60s
Analysis of the selected loading following saliva immersion using ANOVA (p<0.001) and Bonferroni´s test can be observed in Table 9. There were significant differences between groups. The glass loading at 25% was the most effective (Table 10).
Table 9: Comparison of the flow reduction rate vales by Group (application: 60 s)
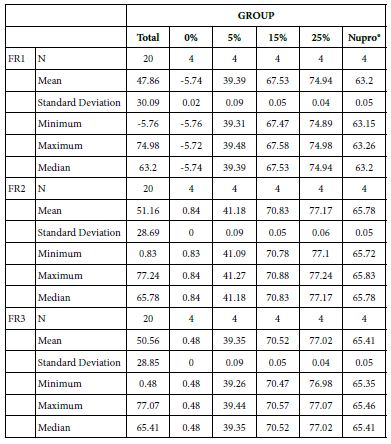
Table 10: FR1 reduction values by loading group at the time of application=60 s: results of multiple comparisons Bonferroni´s test
FR2: After Saliva Immersion
The FR mean was 0.84 ± 0.00% if no bioactive glass was incorporated into the prophy-paste. With 5%-loading, the FR reduction values increased to 41.18 ± 0.09%. At the higher loading levels (15% and 25%) involved new increments to 70.83 ± 0.05% and 77.17 ± 0.06%. Nupro® solution involved 65.78 ± 0.05%. Again, the 25%-loading of bioactive glass was associated with an increase in tubular occlusion (Figure 7).
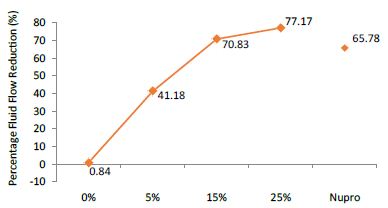
Figure 7: Flow rate FR2 reduction values by loading group after saliva immersion at time=60s
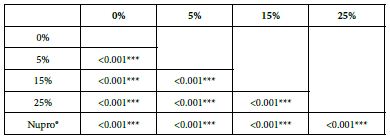
Analysis of the selected loading following saliva immersion using ANOVA (p<0.001) and Bonferroni´s test can be observed in Table 10. There were significant differences between the groups. The loading at 25% of bioactive glass was the most effective (Table 11).
Table 11: FR2 reduction values by loading group at the time of application=60 s: results of multiple comparisons Bonferroni´s test
FR3: After an Acid Challenge
The FR mean value was 0.48 ± 0.00% if no bioactive glass was incorporated into the prophy-paste. With the 5%-proportion the mean reduction increased to 39.35 ± 0.09%. The higher loading levels (15% and 25%) reduction increased to 70.52 ± 0.05% and 77.02 ± 0.04% respectively. The Nupro® solution values were 65.41 ± 0.05%. Therefore, the optimal tubular occlusion occurred using a 25%-loading of bioactive glass (Figure 8).
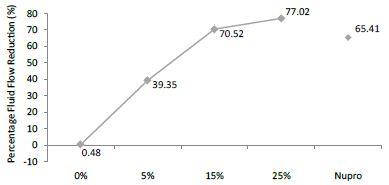
Figure 8: Flow rate FR3 reduction values by loading group after an acid challenge at time=60s
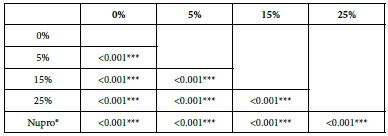
Analysis of the selected loading following saliva immersion using ANOVA (p<0.001) and Bonferroni´s test can be observed in Table 11. There were significant differences between the groups. 25% Bioactive glass loading was the most effective (Table 12).
Table 12: FR3 values by loading group at time of the application=60 s: results of multiple comparisons Bonferroni´s test
Analysis of FR Values at the Time of Application=120 s
Table 13 and Figure 9 show the basic statistics of the FR reduction values over the experiment after 120s of paste application:
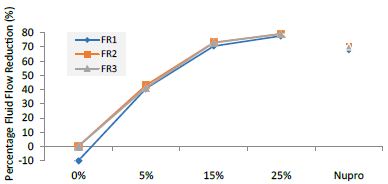
Figure 9: Flow rate reduction values by loading group at the time of application=120s
Table 13: Flow rate reduction values by group (application: 120 s)
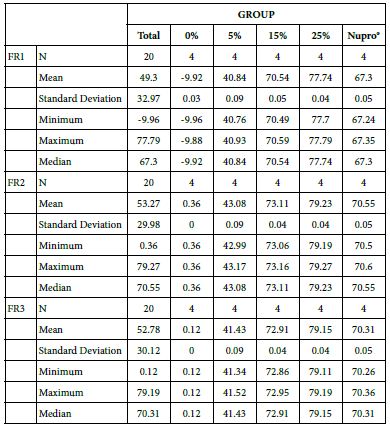
FR1: After Prophy-Paste Application
The FR mean was -9.92 ± 0.03% if no bioactive glass was incorporated into the prophy-paste. With 5%-loading, the FR reduction increased to 40.84 ± 0.09%. The higher loading levels (15% and 25%) increased the reduction to 70.54 ± 0.05% and 77.74 ± 0.04%. Nupro® solution involved 67.30 ± 0.05%. 25%-loading was associated to the maximum power of occlusion (Figure 10).
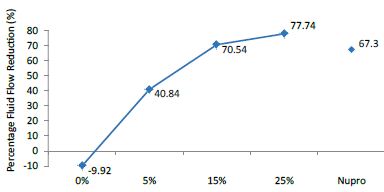
Figure 10: Flow rate FR1 reduction values by loading group at time of application=120s
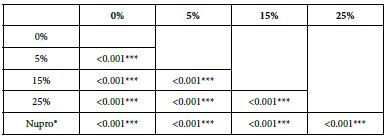
Analysis of the selected loading following a 120 second application time using a one-way ANOVA (p<0.001) and Bonferroni´s test can be observed in Table 13. There were significant differences between the groups. Loading at 25% was the most effective.
FR2: After Saliva Immersion
FR mean was 0.36 ± 0.00% if no bioactive glass was present. With 5%-loading, the reduction of fluid flow increased to 43.08 ± 0.09%. Higher loading levels (15% and 25%) involved newer reduction increments to 73.11 ± 0.04% and 79.23 ± 0.04%. Nupro® solution involved 70.55 ± 0.05%. The 25%-loading was associated to the maximum power of occlusion (Figure 11).
Figure 11: Flow rate FR2 reduction values by loading group after saliva immersion at time=120s
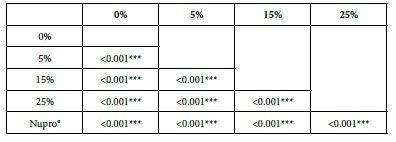
Analysis of the selected loading following saliva immersion using a one-way ANOVA (p<0.001) and Bonferroni´s test can be observed in Table 14. There were significant differences between the groups. Loading at 25% was the most effective (Table 15).
Table 14: FR1 by loading group at time of application=120 s: results of multiple comparisons Bonferroni´s test
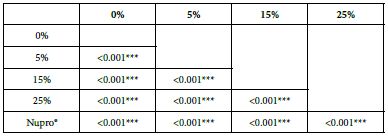
Table 15: FR2 by loading group at time of application=120 s: results of multiple comparisons Bonferroni´s test
FR3: After an Acid Challenge
FR mean was 0.12 ± 0.00% if no bioactive glass was present. With 5%-proportion mean reduction increased to 41.43 ± 0.09%. Higher loading levels (15% and 25%) involved new reduction increments to 72.91 ± 0.04% and 79.15 ± 0.04%. Nupro® solution involved 70.31 ± 0.05%. Therefore, the optimal tubular occlusion took place using 25%-loading (Figure 12).
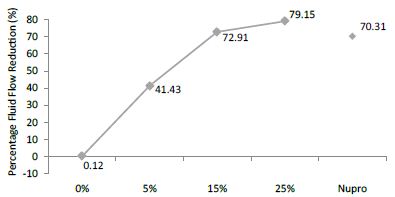
Figure 12: Flow rate FR3 reduction values by loading group after an acid challenge at time=120s
Analysis of the selected loading following an acid challenge using one-way ANOVA (p<0.001) and Bonferroni´s test can be observed in Table 16. There were significant differences between groups. Loading at 25% was the most effective.
Table 16: FR3 by loading group at time of application=120 s: results of multiple comparisons Bonferroni´s test
Analysis of FR at Loading=0%
Table 17 highlights the basic statistics of FR over the experiment following 0%-bioactive glass paste application:
Table 17: Flow rate reduction values by time of application (0% loading)
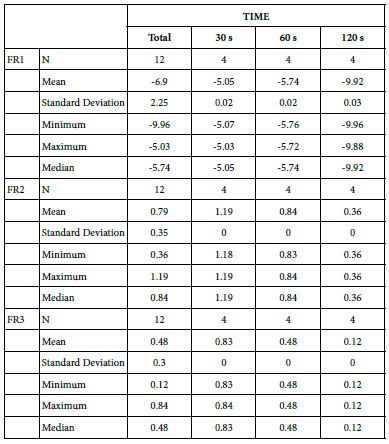
FR1: After Prophy-Paste Application
The FR1 mean was -5.05 ± 0.02% within discs treated for 30s, -5.74 ± 0.02% in discs treated 60s and, finally, -9.92 ± 0.03% for the longest duration 120s (Table 16).
Analysis of the time of application at the time of loading (0%) using one-way ANOVA (p<0.001) and Bonferroni´s test indicated that there were significant differences between times, with the time of application at 30s being the most effective option.
FR2: After Saliva Immersion
The FR2 mean was 1.19 ± 0.00% within discs treated for 30s, 0.84 ± 0.00% in discs treated 60s and, finally, 0.36 ± 0.00% for the longest duration 120s (Table 16). Analysis of the time of application at the time of loading (0%) using one-way ANOVA (p<0.001) and Bonferroni´s test indicated that there were significant differences between times, with the time of application at 30s being the most effective option.
FR3: After an Acid Challenge
The FR3 mean was 0.83 ± 0.00% within discs treated for 30s, 0.48 ± 0.00% in discs treated 60s and, finally, 0.12 ± 0.00% for the longest duration 120s (Table 16). Analysis of the time of application at the time of loading (0%) using one-way ANOVA (p<0.001) and Bonferroni´s test indicated that there were significant differences between times, with the time of application at 30s being the most effective option.
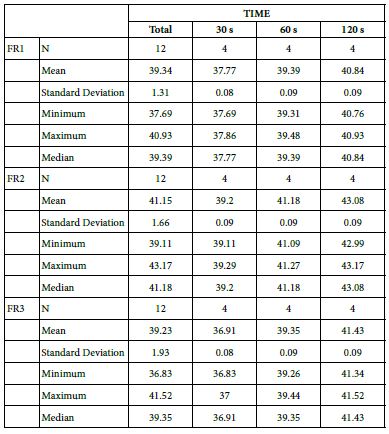
Analysis of FR at Loading=5%
Table 18 provides the basics statistics of FR reduction values over the experiment following a 5%-bioactive glass paste application:
FR1: After Prophy-Paste Application
The FR1 mean was 37.77 ± 0.08% within discs treated for 30s, 39.39 ± 0.09% in discs treated 60s and, finally, 40.84 ± 0.09% for the longest duration 120s (Table 17). Analysis of the time of application at the time of loading (5%) using one-way ANOVA (p<0.001) and Bonferroni´s test indicated that there were significant differences between times, with the time of application at 120s being the most effective option.
FR2: After Saliva Immersion
The FR2 mean was 39.20 ± 0.09% within discs treated for 30s, 41.18 ± 0.09% in discs treated 60s and, finally, 43.08 ± 0.09% for the longest duration 120s (Table 17). Analysis of the time of application at the time of loading (5%) using one-way ANOVA (p<0.001) and Bonferroni´s test indicated that there were significant differences between times, with the time of application at 120s being the most effective option.
FR3: After an Acid Challenge
The FR3 mean was 36.91 ± 0.08% within discs treated for 30s, 39.35 ± 0.09% in discs treated 60s and, finally, 41.43 ± 0.09% for the longest duration 120s (Table 17). Analysis of the time of application at the time of loading (5%) using one-way ANOVA (p<0.001) and Bonferroni´s test indicated that there were significant differences between times, with the time of application at 120s being the most effective option.
Analysis of FR at Loading=15%
Table 19 provides the basics statistics of FR over the experiment after 15%-bioactive glass paste application:
Table 19: Flow rates reduction values by time of application (15% loading)
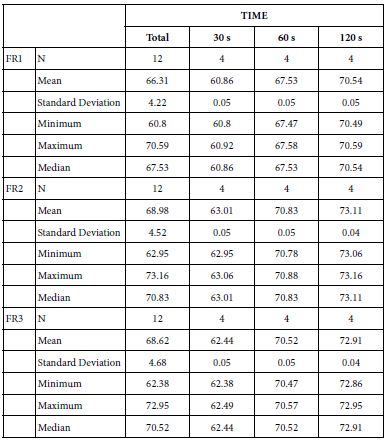
FR1: After Prophy-Paste Application
The FR1 mean was 60.86 ± 0.05% within discs treated for 30s, 67.53 ± 0.05% in discs treated 60s and, finally, 70.54 ± 0.05% for the longest duration 120s (Table 18). Analysis of the time of application at the time of loading (15%) using one-way ANOVA (p<0.001) and Bonferroni´s test indicated that there were significant differences between times, with the time of application at 120s being the most effective option.
Table 18: Flow rate reduction values by time of application (5% loading)
FR2: After Saliva Immersion
The FR2 mean was 63.01 ± 0.05% within discs treated for 30s, 70.83 ± 0.05% in discs treated 60s and, finally, 73.11 ± 0.04% for the longest duration 120s (Table 18). Analysis of the time of application at the time of loading (15%) using one-way ANOVA (p<0.001) and Bonferroni´s test indicated that there were significant differences between times, with the time of application at 120s being the most effective option.
FR3: After an Acid Challenge
The FR3 mean was 62.44 ± 0.05% within discs treated for 30s, 70.52 ± 0.05% in discs treated 60s and, finally, 72.91 ± 0.04% for the longest duration 120s (Table 18). Analysis of the time of application at the time of loading (15%) using one-way ANOVA (p<0.001) and Bonferroni´s test indicated that there were significant differences between times, with the time of application at 120s being the most effective option.
Analysis of FR at Loading=25%
Table 20 provides the basics statistics of FR over the experiment after 25%-bioactive glass paste application:
Table 20: Flow rates reduction values by time of application 25% loading
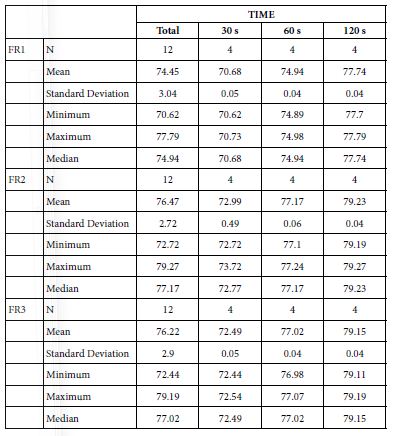
FR1: After Prophy-Paste Application
FR mean was 70.68 ± 0.05% within discs treated for 30s, 74.94 ± 0.04% in discs treated 60s and, finally, 77.74 ± 0.04% for the longest duration 120s (Table 19). Analysis of the time of application at the time of loading (25%) using one-way ANOVA (p<0.001) and Bonferroni´s test indicated that there were significant differences between times, with the time of application at 120s being the most effective option.
FR2: After Saliva Immersion
FR mean was 72.99 ± 0.49% within discs treated for 30s, 77.17 ± 0.06% in discs treated 60s and, finally, 79.23 ± 0.04% for the longest duration 120s (Table 19). Analysis of the time of application at the time of loading (25%) using one-way ANOVA (p<0.001) and Bonferroni´s test indicated that there were significant differences between times, with the time of application at 120s being the most effective option.
FR3: After Acid Challenge
The FR3 mean was 72.49 ± 0.05% within discs treated for 30s, 77.02 ± 0.04% in discs treated 60s and, finally, 79.15 ± 0.04% for the longest duration 120s (Table 19). Analysis of the time of application at the time of loading (25%) using one-way ANOVA (p<0.001) and Bonferroni´s test indicated that there were significant differences between times, with the time of application at 120s being the most effective option.
Analysis of FR at Nupro® Group
Table 21 provides the basics statistics of FR over the experiment following the Nupro® paste application:
FR1: After Prophy-Paste Application
The FR1 mean was 57.11 ± 0.05% within discs treated for 30s, 63.20 ± 0.05% in discs treated 60s and, finally, 67.30 ± 0.05% for the longest duration 120s (Table 20). Analysis of the time of application at the time of loading (Nupro®) using one-way ANOVA (p<0.001) and Bonferroni´s test indicated that there were significant differences between times, with the time of application at 120s being the most effective option.
FR2: After Saliva Immersion
The FR2 mean was 62.55 ± 0.05% within discs treated for 30s, 65.78 ± 0.05% in discs treated 60s and, finally, 70.55 ± 0.05% for the longest duration 120s (Table 20). Analysis of the time of application at the time of loading (Nupro®) using one-way ANOVA (p<0.001) and Bonferroni´s test indicated that there were significant differences between times, with the time of application at 120s being the most effective option.
FR3: After an Acid Challenge
The FR3 mean was 61.96 ± 0.05% within discs treated for 30s, 65.41 ± 0.05% in discs treated 60s and, finally, 70.31 ± 0.05% for the longest duration 120s (Table 20). Analysis of the time of application at the time of loading (Nupro®) using one-way ANOVA (p<0.001) and Bonferroni´s test indicated that there were significant differences between times, with the time of application at 120s being the most effective option.
Analysis of FR by Both Loading and Time of Application
The analysis of the results would indicate that 1) the higher the bioactive glass loading resulted in a greater potential to occlude the tubules and 2) the longer time of application resulted in a greater potential to occlude the tubules.
Data as displayed in Figures 12-14 (FR 1-3) were used to determine whether the benefits of a high glass loading was similar for all conditions at the time of application and whether the benefit of a longer time of application was similar for all glass loading conditions. A more general statistical model was estimated to assess the interaction between both factors. The results indicated that for all flow rate reductions (FR1-3) by loading group and time of application (F-test of 2-way ANOVA.) clearly demonstrated that differences between the time of application were significant for any loading (Figure 14). This model concludes that differences are even more apparent as the glass loading was increased (p<0.001, interaction) (Figure 15).
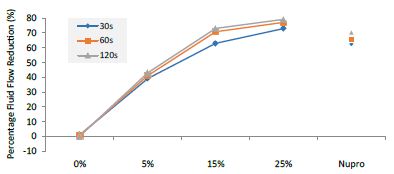
Figure 13: Flow rate FR2 reduction values by loading group and time of application
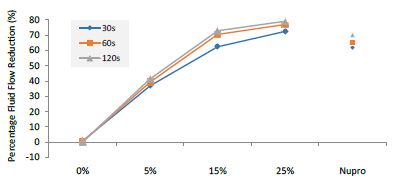
Figure 14: Flow rate FR3 reduction values by loading group and time of application
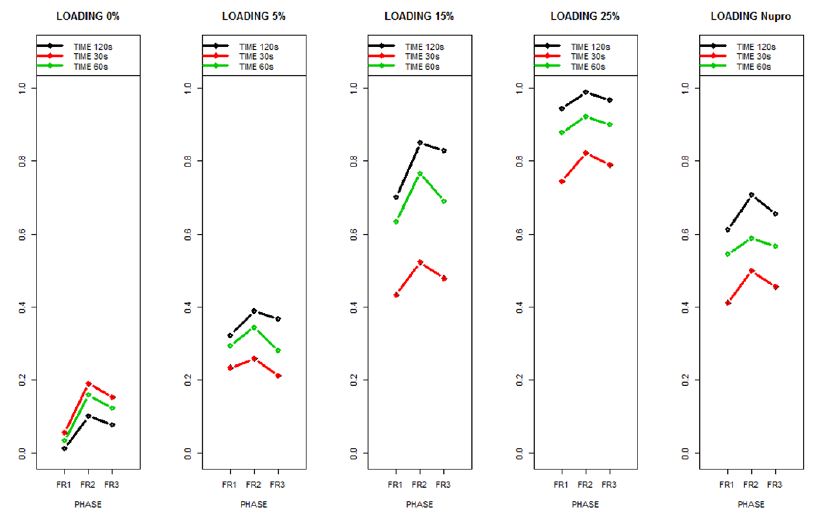
Figure 15: The relative effects from the Brunner-Langer model of the different prophy-paste loading through the three treatment FR1, FR2 and FR3 and different times 30, 60 and 120 seconds
The relative effects from the Brunner-Langer model of the different prophy-paste loading through the three treatment regimens (FR1, FR2 and FR3) and the different application times (30, 60 and 120 seconds) was also analyzed (Figure 16).
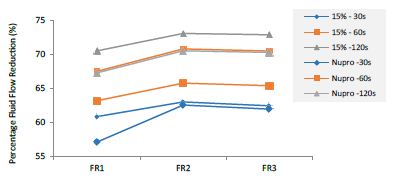
Figure 16: Summarizes the results regarding both 15% loaded glass and Nupro® groups through the three treatment modalities FR1, FR2 and FR3 at three different times (30, 60 and 120 seconds).
This above figure demonstrates that the magnitude of the FR to the different elements (paste, saliva, acid) depends specifically in the % loading and time of application. There was a high inter-correlation involving all factors included in the analysis. In other words, the higher the bioactive glass loading was, the higher the positive effect of polishing a longer time. Alternatively, for longer times of application, the slope of the increment of FR rate is higher, that is an increment of loading involves a higher impact. For example, a 15% loaded bioactive glass showed the best effect when applied to samples for 30 seconds.
The results of the model confirmed that the pattern of FR changes depends specifically on the conditions of both loading and time of application.
Comparison between the 15%-Glass Loading and the Nupro® Polishing Paste
This comparison is important since these two products share the same proportion of glass but are manufactured differently. For example, the 15% Bioglas loading is an experimental paste whereas the Nupro® paste is an established commercial product. Table 21 and Figure 16 compares the results between the 15% glass loading and Nupro® group at different times (30s, 60s and 120s) (Table 22).
Table 21: Flow rates reduction values by time of application (Nupro® group)
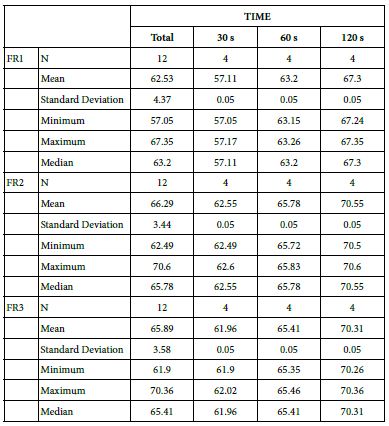
Table 22: Comparison between the 15% glass loading and Nupro® group at different times (30 s, 60 s and 120 s)
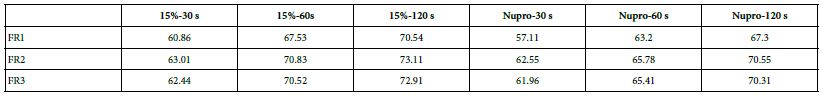
Comparison of the FR rates by loading group (15% vs. Nupro®) at different times of application: using a 2-sample t-test indicated that there were significant differences for every comparison apart from the 30s application. The results of the analysis suggested that a 15%-glass loading was better (higher FR reduction value) than the Nupro® paste (for each time and phase) (Figure 17).
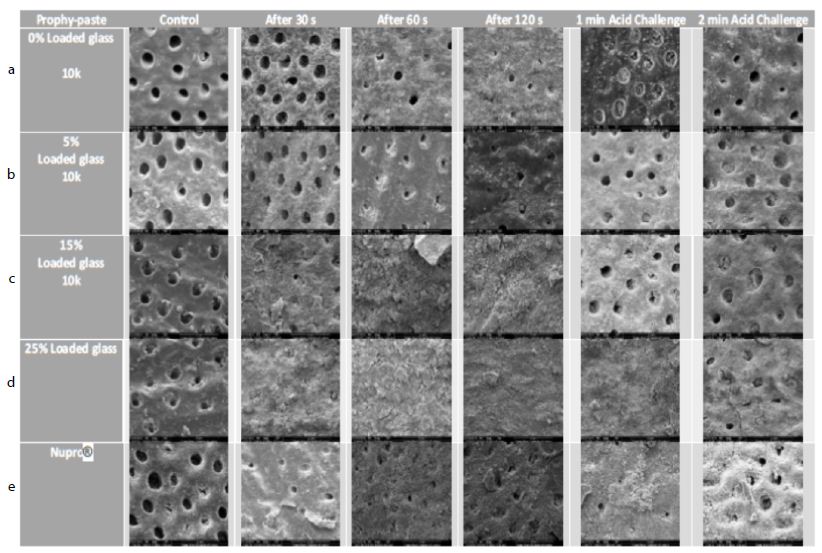
Figure 17: a-e Comparison of different prophylaxis polishing-pastes assessed in the study; 0%, 5%, 15%, 25% loaded glass and a Nupro® control at 10,000x magnification
Scanning Electron Microscope (SEM).
The surface morphologies of each dentine disc were evaluated under the scanning electron microscopy at x1000 (1k) and x10000 (10k) magnifications at different stages of treatment. For viewing the occlusal characteristic of dentine tubules, the discs were mounted flat on the stub. Each dentine disc was viewed after (1) acid etching as a control, (2) 30 seconds of a prophy-paste application, (3) 60 seconds after a prophy-paste application, (4) 120 seconds after a prophy paste application, (5) 1-minute of an acid challenge after 1-hour of salivary immersion and (6) 2-minutes of an acid challenge after 1-hour of salivary immersion.
Effect of a 0%, 5%, 15%, 25% and a Nupro® control) loading of prophylaxis polishing-paste:
In the control group where the dentine disc was etched for 2 minutes with citric acid no tubular occlusion was evident and the open dentinal tubules were observed. Immediately after 30 seconds of applying a prophylaxis polishing-paste of 0% loading, the surface had some particles on the outer surface as well as inside the dentinal tubules, although the dentinal tubules were open. Increasing the time to 1-minue and 2 minutes with the same loading in different tooth samples, more particles were deposited over the surface of the disc, but the dentinal tubules could still be observed. When the discs were challenged in an acidic environment for one-minute and two-minutes after the discs were treated for 60 seconds and immersed for an hour in artificial saliva, there were fewer scattered particles on the dentine surface compared to the previously treated disc for a minute. Furthermore, more dentinal tubules were visualised after two-minutes of an acidic challenge (Figure 17a). Increasing the application time of 5.0% loaded prophy-paste from 30 seconds, 60 seconds to 120 seconds resulted in more scattered particles over the dentinal surface with fewer open dentinal tubules were at the 2-minutes of prophy-paste application interval. By way of comparison following increasing the time in an acidic challenge solution after 1 minute of prophy-paste treatment resulted in fewer scattered particles over the dentine surface although there were more opened dentinal tubules observed (Figure 17b). It appeared there was a pattern established when increasing the application time, since more occluded dentinal tubules were observed. After treating the sample for 30 seconds when applying the 15% loaded prophy-paste, more scattered particles and some obvious signs of angular shaped particles which appeared to be bioactive glass were noted. Once the application time increased to 60 seconds and 120 seconds, more glass particles were observed and the whole disc surface was covered with a dense layer of the material. Once the disc was placed in citric acid for 1-minute and 2-minutes, the dense layer was washed away although the prophylaxis polishing- paste material was observed inside the dentinal tubules (Figure 17c). By increasing the loading of the bioactive glass and application time, more occluded dentinal tubules were observed. After 30 seconds of application of a 25% loading, a dense layer covering the external surface of the sample was observed. No differences were noticed when applying the 25% loaded bioactive glass at 1-minue and 2-minutes. When the sample was placed as part of an acidic challenge for 1-minute, the dense layer of the material was noticed. Once the acidic challenge time increased to 2-minutes however, the orifices of the blocked dentinal tubules were observed (Figure 17d). The Nupro® control followed the same pattern as the 15% loaded prophy-paste where a dense layer was observed after 1-minute of application. When exposed to an acidic challenge, it was evident that the dense layer formed at the external surface was affected in a similar manner to the 15% loaded prophy-paste when applied after 2-minutes (Figure 17e).
Discussion
Bioactive glass has been previously used as an active ingredient in a desensitizing prophy-paste to treat DH by blocking dentinal tubules [3-6]. The use of bioactive glass products has been reported for its effectiveness in blocking dentinal tubules in a desensitising toothpaste in reducing DH [3-6] as well as an active ingredient in prophylaxis polishing pastes. Although Bioactive glass products have been incorporated in both toothpaste and prophylactic polishing pastes [12] there appears to be limited data regarding the actual percentage of the loading of Bioactive glass for a desensitizing prophylactic polishing paste as well as the time requirement for use in an in-office application. Neuhaus et al. [11] conducted a double-blinded randomised clinical trial and concluded that a 15% NovaMin® loading with and without fluoride had the same immediate DH effect for 28 days following root surface debridement (RSD). For this reason, fluoride was not incorporated into the prophy-paste formulation, however Brauer et al. [16] suggested that incorporating fluoride into dental materials bioglass formulations would be beneficial since the formed fluoroapatite layer may improve in withstanding an acidic challenge.
The effectiveness of the different loading of bioactive glass at 0.0%, 5.0%, 15%, 25% and Nupro® from Sensodyne® from Densply was investigated in the present study. Nupro® was used in the study as it was commercially available as a prophy-paste and as such was used as a control when comparing the various loading of bioactive glass in novel prophy-paste preparations in its effect on fluid flow and tubular occlusion. The other issue to be evaluated in the present study was to choose the ideal time of paste application as there was available data evidenced in the published literature. In the present study three different application times namely 30 seconds, 60 seconds and 120 seconds were selected. Due to the limited number of extracted teeth available for this study it was not possible to investigate other higher percentage loading of bioactive glass or different times and this could therefore be part of a future study. There were numerous limitations and difficulties, however when using these two techniques. Firstly, the individual tooth has unique characteristics when comparing the dentine tubules within a mid-coronal section of dentine (dentine disc). There was also a problem with source of the teeth as the age, tooth pathology and collection procedures as well as regional variations and differences with the tooth itself [17,18] which may account in turn to the regional variation in fluid flow through dentine [10]. These factors however, made standardization of the dentine discs difficult to achieve. To overcome this issue or at least minimise these effects Mordan et al. [19] developed methodology to standardize the evaluation of the dentine disc by limiting the area of evaluation to the centre of each disc and sectioning the disc into a test and control section for comparison.
Dentine Permeability Evaluation
The results of the first treatment phase which included applying the different loading of bioactive glass in prophy-pastes for different times showed a reduction in dentine permeability except for the 0% bioactive glass loading. There was however some occlusion of the dentinal tubules in the cross-section samples using SEM. According to Gillam et al. [6], this may be due to the presence of silica in a polishing paste, or toothpaste, it may also be possible for the extra- fine pumice to play a role in blocking the dentinal tubules. Although these effects were insignificant when comparing the hydraulic conductance measurements. The results also indicated that increasing the application time influenced both tubular occlusion and flow rate (FR).
When applying the 5% glass loading of bioactive glass at 30 seconds, the fluid flow was reduced by 37.77%. As the glass loading increased to 15% the fluid flow was reduced to 60.87%. When comparing the 15% glass loading with Nupro®, Nupro® showed less fluid flow reduction (57.11%). At the 25% glass loading a 70% flow rate, FR, reduction was noted. A similar pattern was noticed when applying the different glass loading of the prophy paste at different times namely 60 seconds and 120 seconds where the highest reduction of 77.7% of fluid flow occurred at 120 seconds when using the 25% loading of bioactive glass. Furthermore, when comparing Nupro® with the 15% loading, the 15% loading showed a fluid flow reduction at the three different time applications. Moreover, the benefit of a longer application time (60-120s) was evident at the 15%-loading compared to a shorter application time (30s) (Figure 16).
Immediately after the prophylaxis polishing paste application, the same specimens were immersed in artificial saliva for an hour. Reduction of fluid flow in all specimens was statistically significant (Figure 4.38). The optimum occlusion was noticed with the 25% loading with a 120 second application time (Figure 16). There was a slight increase in tubular occlusion at the 0% loading which suggested some effects of the artificial saliva as previously indicated above.
The final treatment involved challenging the specimens in a 6% citric acid solution for two minutes after the prophy-paste application with the dentine disc placed in the hydraulic conductance cell. Citric acid was used in the present study due to its weak acidity that resembled fruit juices freely commercially available and consumed orally on a regular basis by consumers. Citric acid has an erosive effect unlike the neutralising effect of saliva and will remove the precipitated layer opening the dentinal tubules thereby increasing the flow rate within the tubules. The FR values of all groups were reduced following the immersion in an acid solution although the 25% bioactive glass loading appeared to withstand the effects of this challenge better than the other groups showing the least amount of opening dentinal tubules when compared with the rest of the groups (Figure 15).
When the Brunner-Langer model applied to verify the relative effect magnitude of FR to the different elements (paste, saliva, acid) depending specifically on the loading and time of application. There was a high inter-correlation involving all factors included in the analysis. In conclusion, the greater bioactive glass loading together with an increased application time, the greater the effect on tubular occlusion and flow rate. On the other hand, the 15% loaded bioactive glass showed the best effect when applied on samples for 30 seconds (Figure 16). One of the main issues, however, to consider when discussing the results was the low sample size used in the present study and for future studies a larger sample size is recommended.
SEM Analysis
SEM was used to magnify and amplify the specimens under magnification of x1000 and x10,000. The images were grouped together for comparison purposes. These were first etched with 6% citric acid to remove the smear layer which opened the dentinal tubules as observed in the control groups. All the specimens with the different bioactive glass loading and application times together with the Nupro® control were analysed using SEM (Figure 17a-e).
All groups with the different loading of bioactive glass 0%, 5%, 15%, 25% and Nupro® produced a precipitated layer on the dentine disc surface. The specimens of 0% prophy-paste of bio-active glass at 30, 60 and 120 seconds showed some occlusion of the dentinal tubules that was possibly due to the 5% of the silica used in the patent composition of the prophy-paste. Also, the extra-fine pumice which is a highly vesicular silica was used in the ingredient, its particle size was smaller than the dentinal tubules which may induce some tubular occlusion. On increasing the loading of bioactive glass in the other groups from 5% to 25%, more precipitation and blocking of the dentinal tubules was observed particularly at the higher glass loading. The 5% loading had a lower density of the precipitation layer, and the dentinal tubules were partially blocked. The 15% loading however showed a much higher coverage of the dentinal tubules with great reduction in its size. At the 25% loading, no dentinal tubules were observed, and the whole surface of the specimen was covered with a dense precipitation layer (Figures 17a-e). When comparing the Nupro® prophy-paste used as a control with the other loading bioactive glass prophy paste groups, the 15% and 25% loaded SEMs showed a superior effect on occluding the dentinal tubules (Figure 17c-e). Increasing the time from 30 seconds, 60 seconds to 120 seconds had an impact on the tubular occlusion. These results would suggest that using a higher loading of bioactive glass together with increasing the application time would have a major effect on the degree of tubular occlusion. It was evident from the study that the 25% bioactive glass and 2 minutes application time was the most ideal formulation for a prophy-paste an observation that was also supported by the reductions in FR in the hydraulic conductance experiment. By way of comparison there was little evidence of tubular occlusion in the 0% loading prophy-paste at 30 seconds. The samples were then immersed in saliva for an hour prior to an acidic challenge with 6% citric acid for one minute and two minutes following a one- minute application with the different loading of bioactive glass and Nupro® as a control. When the specimens were immersed in saliva and then challenged in 6% citric acid for one minute, no further effect on tubular occlusion was observed due to the density of the precipitated layer on the dentine surface particularly in the high loading groups (15%, 25%) and the Nupro® control. On the other hand, challenging the specimens for two minutes showed a slight reduction effect on tubular occlusion although this effect varied between the groups.
The same effect was observed in the 0% and 5% loading of bioactive specimens with the removal of some of the surface deposit exposing the dentinal tubule orifices (opening) as compared with the 15%, 25% loading and Nupro® groups. The resistance of the surface precipitation following an acidic challenge can be explained by the formation of a fluoro-apatite layer which is more resistant to an acidic challenge rather than a hydroxy-carbonated layer formed by the Nupro® control.
Conclusions
Increasing the bioactive glass loading resulted in a greater fluid flow rate reduction with an increase of time of applications. Overall, the most effective application was with the 25% loaded bioactive glass at 120 seconds although the application of the 15% loaded bioactive glass prophylaxis paste for 30 seconds demonstrated effective tubular occlusion and fluid flow reduction. The incorporation of bioactive glass into a prophylactic-polishing paste may be advantageous in reducing DH following both non-surgical and surgical periodontal treatment in that it may be an effective tubular occludent. Clinical studies however should be conducted to evaluate whether incorporated a novel bioactive glass at the recommended loadings from this in vitro study would be an effective desensitizing agent in the treatment of DH.
References
- Hench LL (2006) ‘The story of Bioglass’. J Mater Sci Mater Med 17(11): 967-978. [crossref]
- Hamad N, Karpukhina N, Gillam D, Hill R (2021) Quantifying the Effect of Adding Alkaline Phosphatase Enzyme to Silicate/Phosphate Glass Mixtures to Enhance Bone Regeneration. Journal of Dental and Maxillofacial Research 4(3).
- Litkowski L, Hack GD, Sheaffer HB and Greenspan DC (1997) ‘Occlusion of dentin tubules by 45S5 Bioglass®’. Bioceramics 10: 411-414.
- Litkowski L and Greenspan DC (2010) ‘A clinical study of the effect of calcium sodium phosphosilicate on dentin hypersensitivity–proof of principle’. J Clin Dent 21(3): 77-81. [crossref]
- Gillam DG, Tang JY, Mordan NJ and Newman HN (1998) The Effects of a Novel Bioglass Dentifrice on Dentine Sensitivity. A Scanning Electron Microscopy Investigation. Scanning 20: 257-258. [Crossref]
- Gillam DG, Tang JY, Mordan NJ and Newman HN (2002) ‘The effects of a novel Bioglass dentifrice on dentine sensitivity: a scanning electron microscopy investigation’. J Oral Rehabil 29(4): 305-313. [crossref]
- Hill R, Brauer D, Gillam DG, Karpukhina N, Bushby A, and Mneime M (2011) Inventors; Queen Mary and Westfield College, UK, assignee, Bioactive glass composition.
- Tie SF, Hill R, Gillam D (2020) The Influence of Glass Content on the Hydraulic and Tubule Occlusion of Novel Bioactive Glass Toothpastes. Journal of Dental and Maxillofacial Research 3(3): 1-7.
- Sauro S, Watson TF, Thompson I (2010) ‘Dentine desensitization induced by prophylactic and air-polishing procedures: An in vitro dentine permeability and confocal microscopy study’. J Dent 38(5): 411-422. [crossref]
- Milleman JL, Milleman KR, Clark CE, Mongiello KA, Simonton TC, et al. (2012) NUPRO sensodyne prophylaxis paste with NovaMin for the treatment of dentin hypersensitivity: a 4-week clinical Am J Dent 25: 262-268. [crossref]
- Neuhaus K, Milleman J, Milleman K, Mongiello K, Simonton T, et al. (2013) ‘Effectiveness of a calcium sodium phosphosilicate containing prophylaxis paste in reducing dentine hypersensitivity immediately and 4 weeks after a single application: a double-blind randomized controlled trial’. J Clin Perio 40(4): 349-357. [crossref]
- Zhu M, Li J, Chen B, Mei L, Yao L, Tian J, and Li H (2014) ‘The Effect of Calcium Sodium Phosphosilicate on Dentin Hypersensitivity: A Systematic Review and Meta- Analysis’, Chinese Journal of Evidence-Based Medicine 14(9): 1126-1130.
- Hussain H, Hill RG, Gillam DG (2020) Quantification of Tooth Wear by Selected Desensitizing Polishing Pastes Using White Light J Dent Maxillofacial Res 3 (4).
- Outhwaite WC, Mc Kennzie DM. and Pashley DH (1974) ‘A versatile split chamber device for studying dentine permeability’. J Dent Res 57: [crossref]
- Pashley DH, Galloway SE (1985) The effects of oxalate treatment on the smear layer of ground surfaces of human Arch Oral Biol 30: 731-737. [crossref]
- Brauer DS, Karpukhina N, O’Donnell MD, Law RV, Hill RG (2010) Fluoride- containing bioactive glasses: effect of glass design and structure on degradation, pH and apatite formation in simulated body fluid. Acta Biomater 6(8): 3275-3282. [crossref]
- Mjör IA, Smith MR, Ferrari M, Mannocci F (2001) The structure of dentine in the apical region of human Int Endod J 34 (5): 346-353. [crossref]
- Pashley DH, Andringa HJ, Derkson GD, Derkson ME, Kalathoor SR (1987) Regional variability in the permeability of human dentine. Arch Oral Biol 32(7): 519-523. [crossref]
- Mordan NJ, Barber PM, Gillam DG (1997) The dentine disc. A review of its applicability as a model for the in vitro testing of dentine hypersensitivity. J Oral Rehabil 24(2): 148-156. [crossref]