Abstract
The paper introduces a novel, Socratic approach to creating research studies, combining the emerging science of Mind Genomics with AI embedded in the Mind Coach system. The templated system instructs the researcher to describe a topic. AI (Idea Coach) synthesizes sets of 15 questions based upon the topic description, and then requires the respondent to select four of the questions. Afterwards, the system instructs the respondent to create four answers to each question, once again providing AI help through the suggestion of 15 answers. This first Idea Coach steps can be repeated as many times as the researcher desires, with each step returning 15 questions, many different, along with a later and automatic synthesis of patterns in the 15 questions through seven standard AI queries. The experiment with actual people presents each study participant with a set of 24 vignettes, combinations of the aforementioned answers. Each respondent evaluates a unique set of 24 different vignettes created by an underlying permuted experimental design. The ratings are analyzed by dummy variable regression analysis to show how each element or answer ‘drives’ the rating. The respondents are further clusters into like-minded groups (mind-sets), based upon their coefficients. The templated approach creates a rapid (2-4 hour) process to go from a state of almost zero knowledge to understanding a topic through AI, geography in this particular instance, to produce the test stimuli, and through human reactions to these test stimuli determine and describe the mindsets respondents hold towards geography that can be organized into courses of specific interest to each mind-set.
Keywords
Mind genomics, AI, Socratic method, Question creation
Introduction
In the “project of science,” research studies are assumed to be efforts which contribute to a picture of “how the world works.” The assumption is that the researcher can identify what might be the next experiment to perform. The experiments often end up as simple reports, supported by statistics, and introduced by detailed literature reviews. Those who publish their investigations are often described as “filling gaps in our knowledge.” Indeed, the much of the edifice of science rests on the practice of what is called the “hypothetico-deductive” system, the system which requires that the researcher propose a hypothesis and do the experiment to either support the hypothesis or falsify it. It is by the accretion of such studies that the edifice of science is created, the picture of the world [1], a picture created by a disciplined approach.
At the other side of the project of science is grounded theory [2,3]. Here the researcher does a study or reports a set of observations. It is from those observations that hypotheses emerge. Once again, however, the effort assumes at the start that the researcher does the experiment, and thus implicitly assumes that the researcher is beginning with a knowledgeable conjecture.
What then happens in those increasingly frequent cases where the issues are new, or at least new combinations of old issues, and where there has not been sufficient time to create a literature, or even to develop grounded theory and hypotheses? Can a method be developed which allows the exploration of issues in a manner which is quick, simple, yet profound in the depth of information and insight that it can promote, and even create? This paper presents such an approach with a worked example, and a timetable of events. The topic is creating an understanding one can create a course in geography, starting with little knowledge, and obtain early-stage feedback. The objective is to test out a general system, Mind Genomics, which has evolved over the past 30+ years, keep pace with developments in statistical computation, and the trend to DIY (do-it-yourself). The impetus for the focus on geography was reading about the launch of a new journal on geography, and the author’s own experience with geography and earth science during the formative high school years. The literature focusing on the teaching of geography provided some of the necessary background [4-6]. Further impetus from the study came from work on horticulture [7] and on travel to Albania and the focus on the pleasant weather of Albania [8].
The approach presented here, Mind Genomics, comes from a combination of three disciplines, and has evolved since the 1990”s [9,10]. The disciplines are:
- Mathematical psychology and psychophysics; The study of how we subjectively “measure external stimuli and situations in our mind,” to create an algebra of the mind. For the current topic of geography, mathematical psychology and psychophysics will help us create the structure of how we think about topics.
- Statistics, specifically experimental design. This is the study of how we can combine different variables to represent alternative “realities,” these realities equivalent to different descriptions of how the world works. The normal, everyday experience of the world comes in packets of stimuli, not in single ideas. Rather than surveying the person, giving that person single questions, we create combinations of those questions, and give the person these combinations. The person then rates the combinations. It will be from the deconstruction of the responses to these mixtures of ideas into the contribution of the individual “elements” that we will learn about the mind of the respondent.
- Consumer research. Consumer research focuses on the world of the everyday, the normal. Rather than creating an artificial situation to elucidate an issue, putting the subject in the situation and then observing behavior, the consumer researcher looks for the world of what people typically experience.
Mind Genomics emerged as a science of the everyday, spurred on by the aforementioned three sciences to measure how people think about ordinary experience. The objective of Mind Genomics is to measure the value of an idea, following the spirit of traditional psychophysics, which focuses on measuring sensory experience. In other words, can we measure the “intensity” of an idea?
Mind Genomics moves away from the conventional approach of surveys, which instruct survey-takers (henceforth called respondents) to rate the importance of different factors, using a scale. The typical use of surveys is to focus a person’s mind on one aspect at a time, one experience, or one’s attitudes regarding a topic. Typically, the survey instructs the survey taker to think of large aspects of the experience and rate the aspect as a totality. Sometimes the desired focus is finer. For example, by dividing the topic into small, “bite-size” ideas of single focus (e.g., aspects of health in a polluted area), a survey can have the survey taker quantify many of the simple aspects of the experience.
The problem of surveys, and the stepping off point of Mind Genomics, is that the experience is not a set of individual aspects but rather combinations of aspects. People do not naturally respond to single ideas, although when instructed they can intellectualize their experience, and come up with a best guess. The typical survey situation is sterile, lacking the richness of experience because the phrases in the survey are “general.” If one were to summarize the thinking involved in survey development, it would be “top down,” wherein the researcher wants the survey taker to abstract, rather than deal with the granular richness.
Mind Genomics works from the bottom up, from the world of the granular, not from the world of the general. A Mind Genomics study first creates a set of phrases describing the granular aspects of the topic. It is impossible, of course, to capture all of the granular aspects of an experience or topic, so the operationalized approach is to focus on four aspects of a topic, each aspect “brought to life” with four granular and different statements. The aspects can be considered “questions, the statements can be considered “answers” or “elements. In other words, the Mind Genomics process thus assembles four questions, each with four answers, hopefully the questions providing a story.
The execution of the Mind Genomics is straightforward. The researcher creates the questions, the researcher creates the answers, types both of these into a template (www.BimiLeap.com), along with a rating question. The BimiLeap program then creates 24 different combinations of answers for each respondent. These combinations are called “vignettes,” and comprise 2-4 elements, at most one element or answer for each question, but often no answer from one or two questions.
Each respondent ends up evaluating virtually a totally different set of 24 vignettes. Each set of vignettes is set up to be structurally identical to every other set of 24 vignettes, at least on a mathematical basis. The differences among the various sets of 24 vignettes are that the elements are permuted. For example, considering respondent (survey taker) #1, A1, A2, A3 and A4 correspond to four different elements. For the second respondent #2, permutation goes into effect. The element previously A1 becomes element A3, the element previously A2 becomes A4, the element previously A3 becomes A1, and the element previously A4 becomes A2. Each set of vignettes is constructed to ensure that the 16 elements are statistically independent of each.
The subsequent processes explicated below, comprise presenting these test vignettes to respondents, obtaining ratings, transforming the ratings to create new “binary variables”, and finally using both regression analysis and to reveal how people perceive different aspects of a topic, and how people end up falling into different groups, so-called “mind-sets”, operationally defined as groups of people who think of the topic in quite different ways.
Difficulties Encountered in the Creation of Ideas, and the Help Provided by Artificial Intelligence
During the evolution of the Mind Genomics platform from its beginnings in the 1990’s under the name IdeaMap, one behavior has continued to repeat study after study, especially among the beginners using Mind Genomics. Simply stated, the difficulty is coming up with the four questions, and to a lesser degree coming up with the four answers for each question. Even accomplished researchers unfamiliar with the Mind Genomics approach report difficulty during the first time that they try this exercise. Quite often the difficulties encountered in the sheer effort of “thinking through the problem” suffice to so strongly discourage that the researcher abandons the task. On the other hand, one the researcher pushes through and creates several sets of questions, the discouragement vanishes, often leading to curiosity and excitement.
The story is a bit different for the second part of the effort, providing answers to the questions. Creating the questions was the hard part. Providing four answers is the easy part, perhaps because we are taught to answer questions, not to pose them. The only thing one has to learn when creating answers is to write the answers in such a way that they can be scanned, almost like a menu.
The remainder of this paper deals with the creation of the relevant set of questions through the Idea Coach, and the explication of the output provided to the researcher, both through inspection of the results, and through AI-enhanced summarizations.
Method
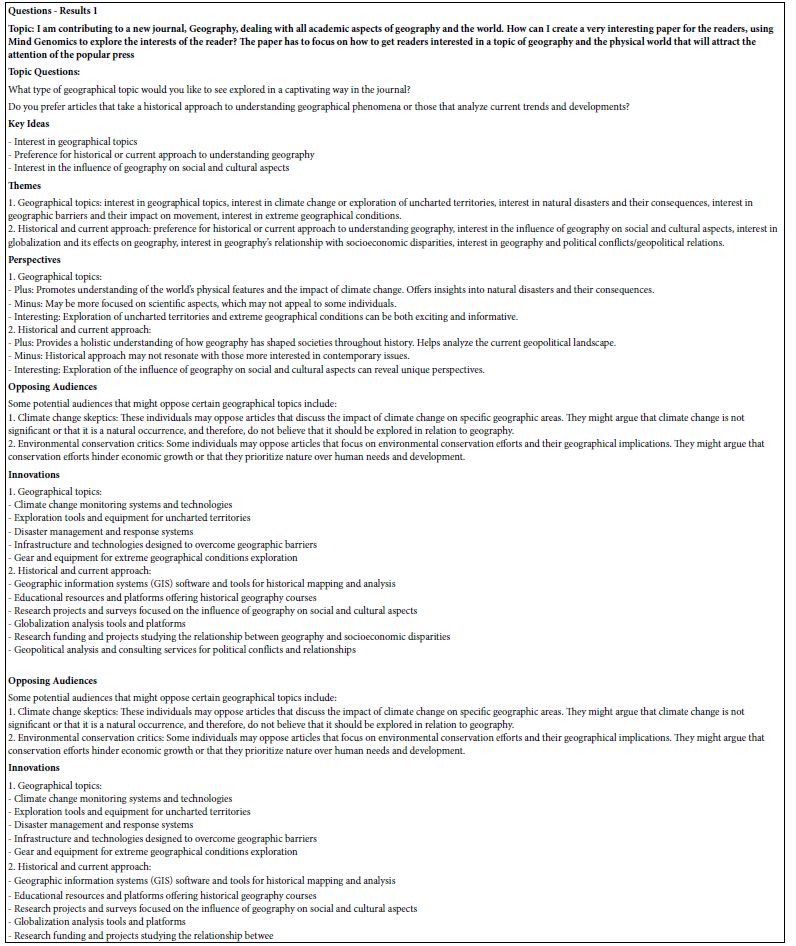
The actual process of creating the test elements begins with the request to provide four questions (Figure 1, Panel A). It is as this point that the researcher needs the help of the provided by the AI in the Idea Coach. Figure 1, Panel B shows the request to Idea Coach, inserted by the researcher.

Figure 1: Panel A presents the request to provide four questions. Panel B presents the paragraph written by the researcher to direct the AI powering Idea Coach.
Table 1 presents the first set of 15 questions generated by the Idea Coach. The Idea Coach is set up to allow the researcher to select from no questions to all four questions from this first “run” of Idea Coach. The Idea Coach can run many times as the researcher searches for the best four questions. For each “run” the Idea Coach returns with some new questions, and some old questions. Each run of the Idea Coach is separate, unconnected with the previous run. The researcher is free to edit the question before accepting it, and even to write some or all herself or himself.
Table 1: Questions emerging from the first run of Idea Coach. The Idea Coach is presented with a topic, and instructed to return 15 questions.
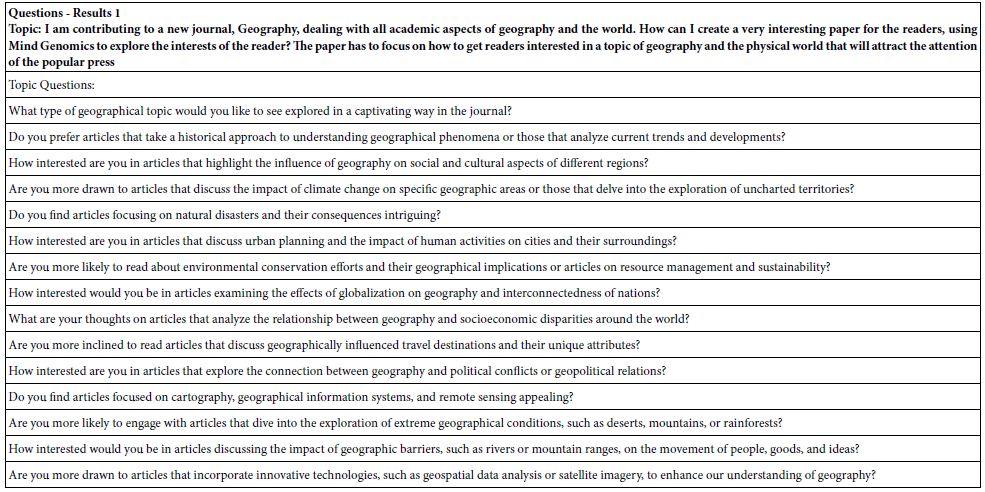
An additional feature of Idea Coach is the use of AI to summarize the questions for each set of 15 questions. Table 2 shows a partial table of this additional summarization. Each time the Idea Coach is run to generate questions, the 15 questions generated are summarized anew. As a happy consequence, the researcher who runs the Idea Coach 5-10 times to generate questions will also receive a detailed summarization of the topics from the AI embedded in Idea Coach.
Table 2: Some AI-based summarizations of the first set of 15 questions. In the interest of space only the first two or three items from each summarization are shown.
Once the researcher has generated the four questions, each question appears, one at a time, in a format similar to Figure 1, Panel B. The researcher is instructed to provide four answers to the question. The Idea Coach, viz., the AI, provides sets of 15 answers to the researcher who once again must select four answers for each question Figure 2 shows the process. Panel A shows the text of the first question, and the four spaces for the answer. Panel B shows the request to Idea Coach for the four answers. There is no need for a “box” for the researcher to write in the text of the question since that information is already in the system from the creation of the questions. Panel C shows some of the output from Idea Coach. Panel D shows the four answers to Question #1, after they have been received from Idea Coach, selected to be put into the program, and then edited if necessary by the researcher to make sure the answers are in the proper format, viz., a meaningful phrase or better a meaningful and simple sentence.
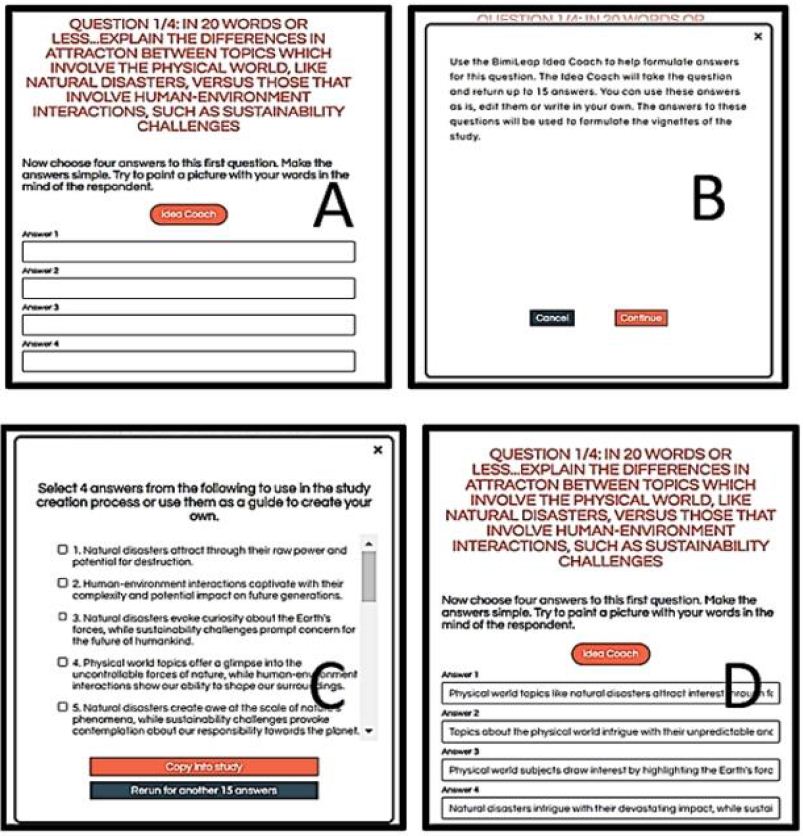
Figure 2: The process followed by the Mind Genomics program to generate and select answers to a question, using Idea Coach.
The Idea Coach can be used many times, allowing the underlying AI to produce different sets of 15 questions, each time responding to a single “squib” or problem statement, as well as different sets of 15 answers to the same question. Across the repeated set of questions or answers, some questions or answers will repeat, but others will be new. Each set of 15 returned questions or returned answers to a question is further summarized by AI, according to a variety of queries to the Idea Coach. It simply requires that the user formulate the questions and answers. For this example, and in a period of less than 15 minutes, it was possible to set up the program, type in the description in Idea Coach, iterate through three sets of 15 questions each, select the four questions during the course of the four iterations, and then once again use Idea Coach to provide the four answers to each question, with three iterations chosen for each question. The result is that within 20-30 minutes it was possible to create a set of 15 such inquiries, with each inquiry comprising 15 “returns” from the AI embedded in Idea Coach. Afterwards, the Mind Genomics program emailed the researcher with the “Idea Book” of 15 pages, one page for each set of 15 questions or answers produced by Idea Coach, as well as additional AI-based summarizations of the 15 questions and answers.
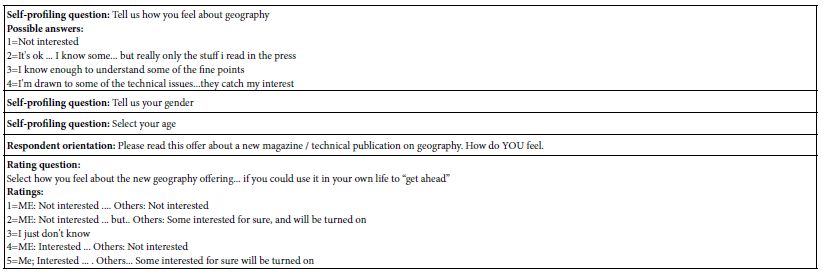
The actual study proceeds with the creation of the classification scale, and then the rating scale and the anchored scale points. Table 3 presents the specifics of these scales, along with the orientation that the respondents read. It is important to keep in mind that for Mind Genomics the vast amount of information comes from the response to the particular elements. The orientation simply tells the respondent what to do. Generally, the orientation is “skimpy,” requiring the respondent to use the information in the test stimuli when they make their rating.
Table 3: The self-profiling classification scale, the respondent orientation to the Mind Genomics evlauations, and the rating used to evaluate the test vignettes.
The Respondent Experience, and the Construction Strategy Underlying the Vignettes
After the research finishes the study set-up, following the template, choosing questions/answers, creating the self-profiling questions, the orientation to the respondent and the rating scale, the research launches the study. The researcher can choose the source of respondents, either from panel providers who specialize in “on-line” research, or from other sources, such as colleagues or students.
Figure 3, Panel A shows the first screen emerging after the welcome to the study. The panel shows the self-profiling questions as a series of pull-down menus. The appearance on the screen of this self-profiling questionnaire is deliberately made to be as “clean” as possible, in order not to intimidate the respondent.
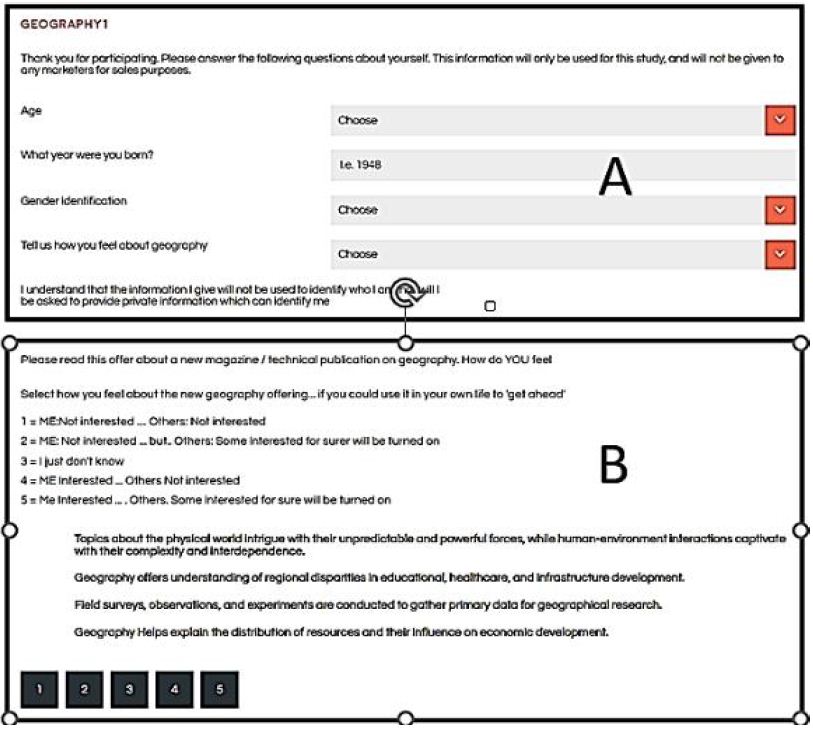
Figure 3: Panel A shows the drop-down menu of the self-profiling classification. Panel B shows one screen shot of a test vignette shown to the respondent, along with the question and the 5-point rating scale.
The next set of 24 screens is the vignettes, shown as an example in Figure 3, Panel B. The screen appears to be a randomized combination of four answers from Table 1. The combination is called a “vignette.” The respondent is instructed to read the vignette, consider all the elements of the vignette to be part of the same idea, and then to rate the vignette on the 5-point scale, following the instructions provided by the rating scale. Note that the vignette has no questions, just answers (elements). Nor does the vignette have any logical or even forced connection between the four elements.
To virtually all participants in these Mind Genomic studies the test stimulus shown in Panel B seems to be random. When faced with a set of 24 such test stimuli, one after another, with no seeming theme, many respondents feel that they have just gone through a set of random combinations. Indeed, the word “random” is often used to describe these vignettes. It is simply impossible to detect a pattern.
The power of the underlying experimental design comes from the way it is constructed.
- All elements appear equally often.
- The combinations for each respondent are set up to be a complete experimental design. That is, the researcher can use the data from one respondent to create an equation showing the contribution of each of the q6 elements or answers.
- Each respondent evaluates a totally different set of 24 combinations. This is known as a permuted experimental design [11]. The benefit of the permuted design is that the researcher gets to cover a great deal of the possible design space. The practical outcome is that the researcher need not know anything about the topic when the research begins. The researcher ends up “exploring” the topic from many angles. The analogy here is the MRI, used to take multiple snapshots of an item from different perspectives, and then combine these snapshots to create a three-dimensional image.
- Each of the 16 answers or elements appears precisely five times in the 24 combinations and is absent from 19 of the vignettes.
- Each vignette comprises a minimum of two elements and a maximum of four elements.
- One question can contribute at most one answer or element to a vignette. This prophylactic ensures that the vignette does not contain two mutually contradicting statements, different alternatives or answers from the same question,
- Panel B of Figure 3 shows the sparse design of the vignette. The questions do not appear. Only the combinations of answers appears, along with the rating question and the rating scale. Often those who commission the research want to have more “fleshed out” vignettes, with connectives and with sentences. The objective of Mind Genomics is to understand what the specific elements are, or really specific ideas, which drive the response. It is easier for the respondent to be given series of vignettes similar to those shown in Panel B. The respondent ends up grazing, looking at the ideas, and then assigning a rating
- The foregoing strategy ends up with different combinations of elements evaluated by the respondents, with the analysis valid at the individual level as well as the group level. It will be the power of analysis at the group level which will enable the researcher to discover important patterns, even in those all-to-common situations where the researcher is a beginner, even a school-age student.
- The final benefit to be surfaced here is the ability of the experimental design to frustrate attempts to “game” the system. Post-study comments by many respondents, often unsolicited, is that they could not game the system, that the system seemed entirely random, that the same elements kept appearing, and that after one or two vignettes were evaluated the respondent claimed to have lost interest and simply guessed the answers. Although one might be perturbed at this admission, especially professionals who want the project to be totally “rational,” the loss of interest means that the respondent reacts at almost a “gut level” to the vignettes, in the same way that the respondent reactions at a relaxed, non-involved way, to the outside world. It is this loss of focus on the “right answer” which allows Mind Genomics to identify how people really think about the topic, rather than spend their time trying to outsmart the researcher.
Relating the Presence/Absence of the Elements to the Rating
The aim of Mind Genomics is to measure the impact of the elements on a scale, or in this study actually on two scales. The five-point scale shows two rating points recording that the respondent is interested (rating 5 and rating 4, respectively), and two rating points recording that others are interested (rating 5 and rating 2, respectively). Furthermore, the five-point scale shows two rating points recording that the respondent is not interested (rating 2 and rating 1), and two rating points recording that others are not interested (rating 4 and rating 1). Finally, rating 3 shows that respondent simply cannot answer those questions.
To link the ratings to the elements requires that we create new scales, called “binary transformed scales.” These are not metric scales of “amount” yes/no scales. The transformations are shown below. They allow the researcher to understand how each of the elements drives interest or disinterest. The transformations are followed by the addition of a vanishingly small random number, that number added to each transformed variable. The addition of the vanishing small random number is a prophylactic step to ensure that every one of the newly created five binary variables shows some marginal or higher degree of variability.
After the ratings are transformed into the five new binary variables, one can run an OLS (ordinary least squares) regression, relating the presence/absence of the elements to the binary transformed rating. The regression will work for each of the five binary variables because the vignettes at the level of each respondent were created to conform to an individual-level experimental design. Thus, the 16 elements (A1-D4) are statistically independent of each other and set up for OLS regression (Craven & Islam, 2011).
The particular “flavor” of the OLS regression is called dummy variable modeling (Hardy, 1993). The term “dummy variable” comes from the coding of the variable. Rather than “amount of,” which is meaningless in this analysis, the coding refers to “presence” (coded as 1), or absence (coded as 0).
The equation is expressed as: Binary Variable = k1A1 + k2A2 … k16D4
From various studies with the foregoing equation, one lacking the additive constant, the general operating procedure has been to look at elements of coefficient lower than 2 (viz., 1, 0, negative) as “irrelevant,” to look at coefficients of 21 or higher as “important”, and the coefficients between 2 and 20 as interesting, perhaps as part of a story. These operational rules come from both statistical regression modeling and observations of how these elements seem to perform in the daily world.
Table 4 shows the coefficients for the total panel, with the five binary transformed variables, as well as with response time as the sixth dependent variable. Strong performing elements, those with coefficients of 21 or higher, have been shaded. Table 4 suggests a fair number of elements end up interesting the respondents, all four from Question B (Explain how understanding geography helps explore current events linked to geography and the physical world), and three of the four from Question C (Go into detail about learning about scientific methodologies and tools used in geographical research). In contrast, no elements from Question A or Question D drive interest.
Table 4: Coefficients of the equation relating the presence/absence of the 16 elements to the newly created binary dependent variables.
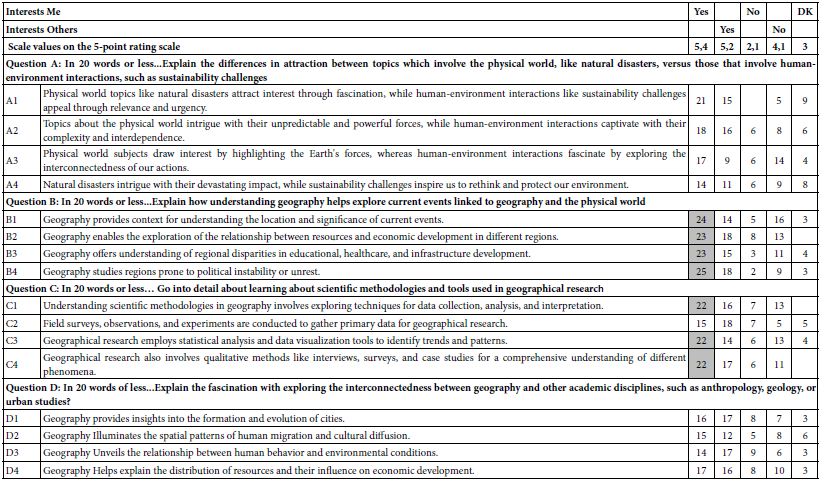
The same search for strong performing elements may be done for the other binary transformed variables. Respondents in this study did not know how to respond when the question involved other people, and when the question involved disliking the element. We could stop there, were we to be focusing on the research as a way to help us decide what to feature in this publication on geography. Or we could move on to hypothesize that it may not be productive to ask people about what other people think, or even to ask people what they themselves dislike.
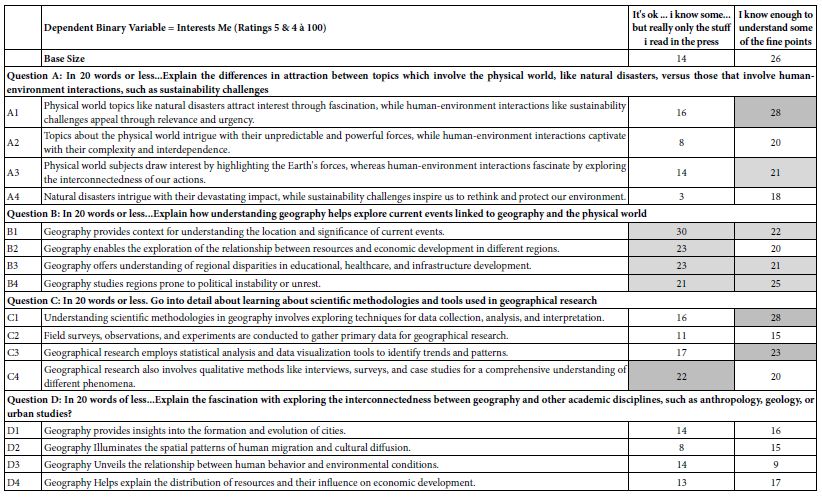
Table 5 continues the analysis, this time looking at the way people describe their interest in geography. The respondents were instructed to check one of four types of interest in geography. Only two of the four classifications were chosen by 10 or more respondents; It’s ok… i know some… but really only the stuff i read in the press, and I know to understand some of the fine points. Table 5 shows that there are some elements which appeal far more strongly to one group than the other, but the strong differences in patterns of preference among the elements fail to materialize.
Table 5: Performance of the elements by two self-defined groups of respondents, the criterion being to describe the nature of their interest in geography.
Beyond WHO to Mind-sets and to Measures of Overall Performance Enhanced by Mind-sets
If these data were to be simply type of messages, but without the content of the messages, the researcher might be happy to discover that some messages perform strongly among the total panel, but that different messages perform strongly by how the respondent describes his or her interest. Tables 4 and 5 provide meaningful data, as least at the level of specifics. The data point out which messages or elements are important. The meaning of the messages tell us even more, namely the content of the messages which are important to the total panel versus the groups. What is missing, however, is a powerful unifying pattern, one which need not be synthesized, but rather is compelling. In the words of Harvard’s Professor of Psychophysics, SS Stevens, the patterns should emerge with “ocular trauma,” namely they should hit you between the eyes with their clarity!” [12].
Unifying patterns emerge when the Mind Genomics data are analyzed with an eye towards discovering groups of people who think about the topic in a similar way. Keep in mind that the Mind Genomics ‘program’, viz., the Mind Genomics effort, focuses on the world of the granular, the world where people feel comfortable because it is the world of the everyday. With that in mind, the search for these mind-sets ends up producing far clearer patterns, and in turn, ends up generating a stronger data set, as will be shown.
Mind-sets are defined as groups of individuals who show similar patterns of thinking about a granular topic, these similar patterns operationally defined as similar patterns of coefficients. Each respondent generates a set of 16 coefficients, based upon the equation relating the presence/absence of the elements to the binary dependent variable. For this study, the binary dependent variable was selected as ‘For Me.’ Viz., ratings 5 and 4 transformed to 100, ratings 1, 2, and 3 transformed to 0.
The actual statistics fall into the category of clustering [13], the specific form being k-means clustering. Through k-means clustering, the statistical program operationally defines the ‘distance’ between pairs of individuals by the statistic: (1-Pearson Correlation), where the Pearson Correlation is computed across the 16 pairs of coefficients. A perfect linear relationship means that the respondents are virtually similar in what appeals to them about geography and what does not. The perfect linear relationship has a Pearson Correlation coefficient of 1.0, and thus the distance between the two respondents is defined as 1-1 or 0. Similarly, when the two respondents show precisely opposite patterns of coefficients, the Pearson Correlation Coefficient is -1, and the distance is 2.0.
The k-means clustering program was instructed to put the 50 respondents into two groups or clusters, and then into three groups or clusters. The computer program [14] divides items (here people) on a purely mathematical basis, according to rules which have nothing to do with meaning of the variables that it uses (here the meaning of the elements who coefficients are used).
When the cluster generates two groups, and then three groups, each respondent is assigned to one of the groups. Table 6 shows the coefficients for the two-cluster solutions, and then the three-cluster solution. The table is sorted by the two-cluster solution.
Table 6: The performance of the elements for Total Panel, Two Mind-Sets, and 3 Mind-Sets, along with the computation of the IDT, Index of Divergent Thought, a measure of ‘how strong the elements performed’ for this clustering solution.
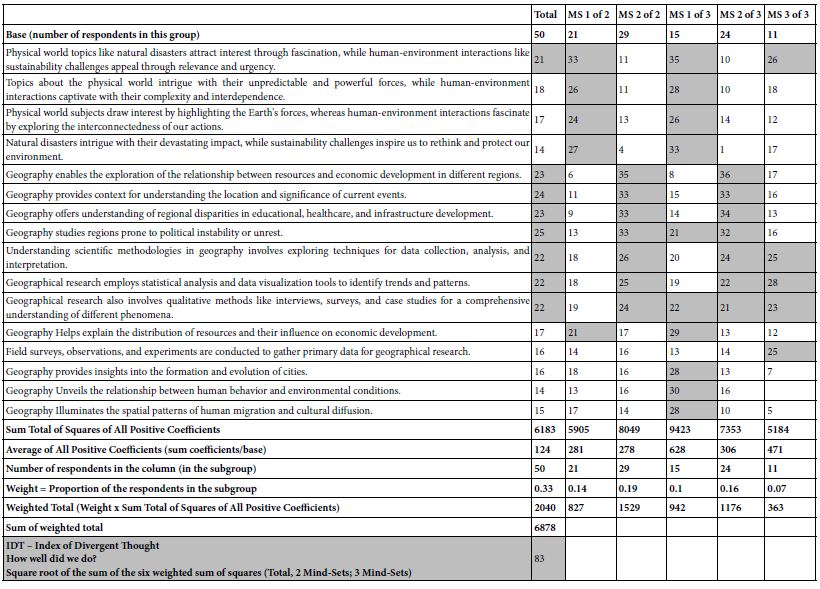
When we look at the two-cluster solution, the patterns becomes far clearer. Here are the very strong elements from the two clusters.
Mind-Set 1 of 2 – focus on the physical world
Physical world topics like natural disasters attract interest through fascination, while human-environment interactions like sustainability challenges appeal through relevance and urgency.
Topics about the physical world intrigue with their unpredictable and powerful forces, while human-environment interactions captivate with their complexity and interdependence.
Physical world subjects draw interest by highlighting the Earth’s forces, whereas human-environment interactions fascinate by exploring the interconnectedness of our actions.
Natural disasters intrigue with their devastating impact, while sustainability challenges inspire us to rethink and protect our environment.
Mind-Set 2 of 2 – Geography helps understand current events and a focus on the methods
Geography enables the exploration of the relationship between resources and economic development in different regions.
Geography provides context for understanding the location and significance of current events.
Geography offers understanding of regional disparities in educational, healthcare, and infrastructure development.
Geography studies regions prone to political instability or unrest.
Understanding scientific methodologies in geography involves exploring techniques for data collection, analysis, and interpretation.
Geographical research employs statistical analysis and data visualization tools to identify trends and patterns.
Geographical research also involves qualitative methods like interviews, surveys, and case studies for a comprehensive understanding of different phenomena.
When we move to three mind-sets, we reduce the parsimony by adding an additional mind-set, but we also increase the interpretability of the mind-sets.
Mind-Set 1 of 3: Focus on the human-environment interaction’
Physical world topics like natural disasters attract interest through fascination, while human-environment interactions like sustainability challenges appeal through relevance and urgency.
Natural disasters intrigue with their devastating impact, while sustainability challenges inspire us to rethink and protect our environment.
Geography unveils the relationship between human behavior and environmental conditions.
Geography helps explain the distribution of resources and their influence on economic development.
Topics about the physical world intrigue with their unpredictable and powerful forces, while human-environment interactions captivate with their complexity and interdependence.
Geography provides insights into the formation and evolution of cities.
Geography illuminates the spatial patterns of human migration and cultural diffusion.
Physical world subjects draw interest by highlighting the Earth’s forces, whereas human-environment interactions fascinate by exploring the interconnectedness of our actions.
Geographical research also involves qualitative methods like interviews, surveys, and case studies for a comprehensive understanding of different phenomena.
Geography studies regions prone to political instability or unrest.
Mind-Set 2 of 3: Focus on geography and society
Geography enables the exploration of the relationship between resources and economic development in different regions.
Geography offers understanding of regional disparities in educational, healthcare, and infrastructure development.
Geography provides context for understanding the location and significance of current events.
Geography studies regions prone to political instability or unrest.
Understanding scientific methodologies in geography involves exploring techniques for data collection, analysis, and interpretation.
Geographical research employs statistical analysis and data visualization tools to identify trends and patterns.
Geographical research also involves qualitative methods like interviews, surveys, and case studies for a comprehensive understanding of different phenomena.
Mind-Set 3 of 3: Focus on research
Geographical research employs statistical analysis and data visualization tools to identify trends and patterns.
Physical world topics like natural disasters attract interest through fascination, while human-environment interactions like sustainability challenges appeal through relevance and urgency.
Understanding scientific methodologies in geography involves exploring techniques for data collection, analysis, and interpretation.
Field surveys, observations, and experiments are conducted to gather primary data for geographical research.
Geographical research also involves qualitative methods like interviews, surveys, and case studies for a comprehensive understanding of different phenomena.
The ability of clustering to pull out these easy-to-interpret groups is worth noting, if only for the fact that to many people participating in these Mind-Genomics studies, the results seem to emerge from guessing.
Table 6: How the elements drive interest when the respondents are clustered or segmented into two, and then into three mind-sets by a statistical algorithm which does not take ‘meaning’ of the elements into account.
At the bottom of Table 6 appear a series of numbers, reflecting computations. These computations are done on the coefficients for the 16 elements, appearing in Table 6 The computations work on the squares of all elements with coefficients of 1 or higher. The computation treats the dataset as if it comprised three groups of 50 respondents each, looks at the sum of squares of coefficients for each column, and weights that column-based sum of squares by the relative proportion of respondents, assuming a set of 3×50 or 150 respondents. The bottom two rows show the weighted sum of squares, and then the square root of the weighted sum of squares.
The final number is the IDT, Index of Divergent Thought. The IDT can only get higher when the elements have high coefficients. The elements can only have high coefficients when all the respondents are thinking in the same way. Thus, the IDT is a measure of the goodness of thinking. The value for the square root is 83. Previous studies suggest that this value of 83 is ‘respectable’ but not exceptionally high. The IDT ends up being a way to measure performance, and the increase of performance over time and practice.
Once the mind-sets are developed, the Mind Genomics program finishes the analysis by summarizing the strong performing elements for each mind-set on a set of queries sent to the embedded AI program. The program answers the queries using only those elements which generated coefficients of +21 or higher. Table 7 presents the AI summarization for the two-mind-set solution.
Table 7: AI summarization of the strong performing elements for the two-mind-set solution

Finding These Mind-sets in the Population at Large
The development of knowledge for Mind Genomics is done rapidly, inexpensively, and with easy to reach samples of respondents. Often as few as 50 respondents is needed. Once the knowledge is obtained, however, how can one broaden the impact of the discovery? It is not reasonable to do the Mind Genomics experiment again and again. The knowledge is already in one’s hands. What is missing is the use of the knowledge to mind-type millions of people, prospective readers of a magazine on geography, or a product related to geography. How then can one assign a new person to one of the two mind-sets, with the objective of interacting with this new person, this prospect, on matters relevant to the study?
The idea of an identifying tool, a typing tool, is not new. Typing tools are important in the world of commerce to assign people to relevant groups. Typing tools are used in many applications to assign people to the relevant group. The chances for success working with people is assumed to be higher when the correct messages are sent to the people, messages which resonate with the mind-set to which the person belongs.
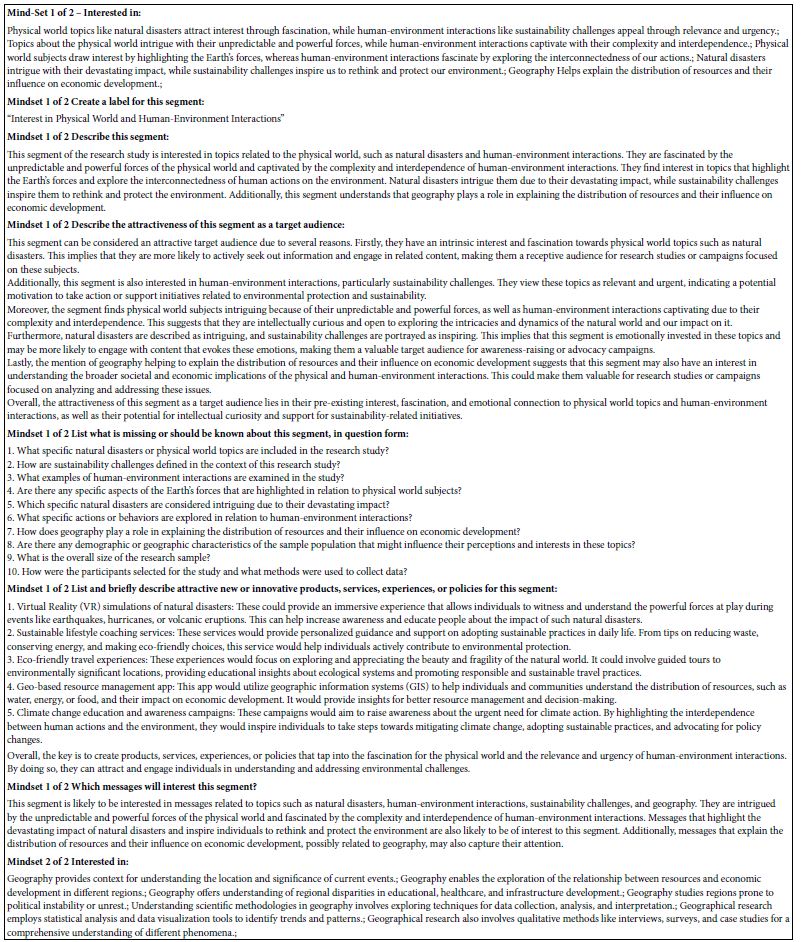
Figure 4 shows a mind-set assignment tool, based upon the strong performing elements. The approach, detailed in previous publications [15,16] enables the researcher to identify actual phrases from the study, develop a simple two-point scale (Yes/No), apply that scale to the six questions taken from the study, and then with reasonable confidences (around 70% or higher) assign new people to one of the two mind-sets. Panel A shows the introductory information about the respondent. Each item is optional, but important for practical application. Panel B shows the actual six questions, which are randomized across respondents. It is the pattern of responses to the six questions which drives the assignment. It is with the assignment or typing tool that the Mind Genomics moves from an efficient creator or knowledge to a facilitating mechanism which enhances communication.
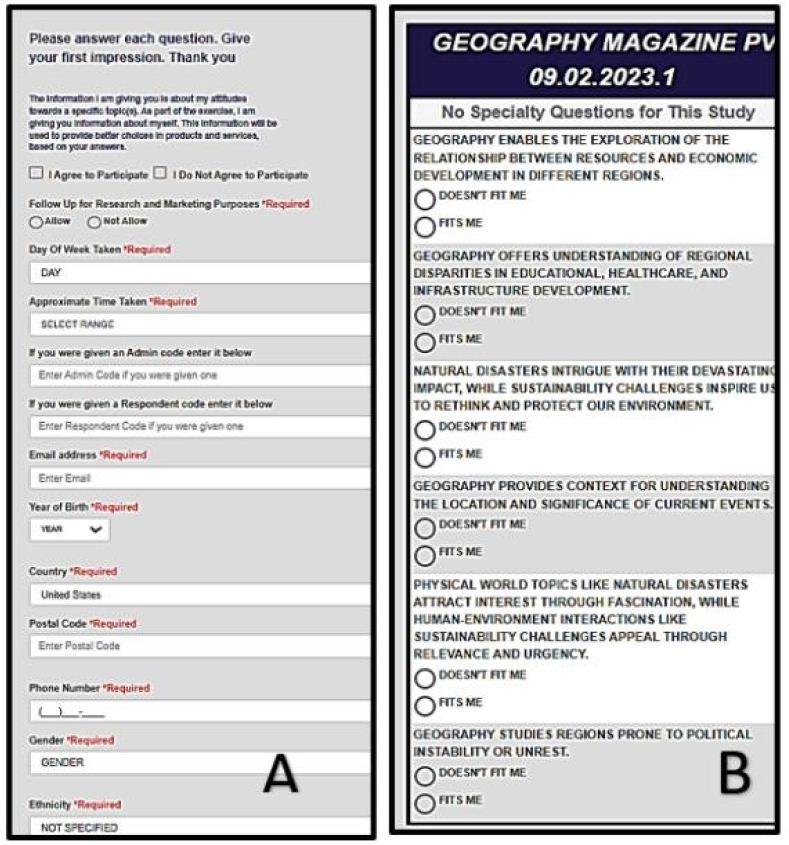
Figure 4: The mind-set assigner. Panel A shows the background questions. Panel B shows the six questions, patterns of reaction to which assign a person to one of the two mind-sets.
Discussion and Conclusion
The origin of this paper comes from the opportunity to understand a topic more deeply, the specific topic being geography. Rather than focusing on the substantive issues involved in geography, the paper considers the topic from the point of view of the mind of people. The paper opens up the possibility of incorporating a new viewpoint into studies, the topic-related worldview of the researchers who do the studies. Science is presumed to be objective. Mind Genomics applied to the topic enables a deeper understanding of the research for this very reason.
With a tool such as Mind Genomics in the hands of ordinary people, it is tempting to think what this study about a magazine, or a journal could be. The study as run here comprises only 16 elements, chosen from a great number, and chosen to be run in the United States. One could only imagine the amount of learning one could get about the magazine or journal if one were to explore each of the possible topics in depth, topics such as geography itself, or the relation of geography to economics, geography to social behavior, geography to health, and so forth. Furthermore, the ability to run these studies in different countries, also inexpensively, means that it is well within the realm of possibility to expand this exploration to many different countries. Finally, the ability to run these studies again and again means that the studies can be done for years, as used as a measure of the change of people’s thinking over time.
The second issue is the nature of the respondents. The respondents were chosen virtually at random. The study might have used ordinary people, or just as easily used professionals, or even those involved in geography in one or another fashion. The respondents could have been teachers or geography vs. parents, and so forth. One could put all of the different types of respondents together into one group, done the clustering to generate segments, and determine the degree to which segmentation falls along lines demarcated by one’s profession versus lines demarcated by one’s interest, independent of profession, especially independent of professions as they cross with the topics of geography. In other words, do there exist more profound mind-sets?
The third and final topic is the coming use of artificial or synthetic respondents rather than real people. The use of AI to generate questions and answers at the start of the study through Idea Coach and the ability of AI to summarize the results in the same way, using strong performing elements as the raw materials, both suggest that AI can play an important role in the Mind Genomics effort. The final challenge is AI as the respondent, complementing the contribution as the designer of research inputs, and the analyst of research output. And, if A I can be programmed to act like respondents, does this final step in the AI evolution of Mind Genomics promise new vistas, especially for the world of students, where studies can be thought up, designed, executed, analyzed, and summarized in a matter of hours. What might be the nature of journals and of magazines when AI can be programmed to reflect a specific type of mind. One might get a sense of this future by seeing what types of elements perform well when the AI is instructed to assume a variety of different ‘personas,’ and in the spirit of Mind Genomics, personas designed with attention to the granularity of detail various aspects.
References
- Lawson AE (1993) Inductive-deductive versus Hypothetico-deductive reasoning: A reply to Yore. Journal of Research in Science Teaching 30: 613-614.
- Backman K, Kyngäs HA (1999) Challenges of the grounded theory approach to a novice researcher. Nursing & Health Sciences. [crossref].
- Ellis D (1993) Modeling the information-seeking patterns of academic researchers: A grounded theory approach. The Library Quarterly 63: 469-486.
- Pickering S (2016) Keeping geography messy. In Teaching Geography Creatively 212-224, Routledge.
- Scoffham S (2012) Geography and creativity: Developing joyful and imaginative learners. In: Contemporary Issues in Primary Education, 21-33, Routledge.
- Scoffham S (2016) Teaching Geography Creatively. Routledge.
- Levin LA, Langer KM, Clark DG, Colquhoun TA, Callaway JL, et al. (2012) Using Mind Genomics® to identify essential elements of a flower product. Horticulture Science 47: 1658-1665.
- lollari O, Papajorgji P, Civici A (2019) Using Mind Genomics to advertise tourism in .Albania. In: 1st UNICART, Interdisciplinary International Conference on ‘Tourism Management and Development of Territory, Bari, Italy. 270-287.
- Moskowitz HR (2012) ‘Mind Henomics’: The experimental, inductive science of the ordinary, and its application to aspects of food and feeding. Physiology & Behavior. [crossref]
- Moskowitz HR, Gofman A, Beckley J, Ashman H (2006) Founding a new science: Mind Genomics. Journal of Sensory Studies 21: 266-307.
- Gofman A, Moskowitz H (2010) Isomorphic permuted experimental designs and their application in conjoint analysis. Journal of Sensory Studies 25: 127-145.
- Stevens SS (1966) Personal communication to author Howard Moskowitz.
- Likas A, Vlassis N, Verbeek J.J (2003) The global k-means clustering algorithm. Pattern Recognition 36: 451-461.
- Wilkinson L (2010) Systat. Wiley Interdisciplinary Reviews: Computational Statistics, 2: 256-257.
- Moskowitz H, Gere H (2020) Selling to the mind of the insurance prospect: A mind genomics cartography of insurance for home project contracts. Edelweiss Psy Open Access 4: 22-28.
- Porretta S, Gere A, Radványi D, Moskowitz H (2019) Mind Genomics (Conjoint Analysis): The new concept research in the analysis of consumer behaviour and choice. Trends in Food Science & Technology 84: 29-33.