Abstract
In a large-scale study of teen food cravings using Mind Genomics, respondents evaluated short vignettes comprising 2-4 messages each, created by combining 36 elements about food. The source elements fell into, four silos of nine elements each (food, situation, taglines for emotions, brand/benefits). Silo C, taglines, was previously thought to be irrelevant to respondents who paid attention primarily to the descriptions of the food and the eating experience. Reanalysis of the data at the level of the individual respondent, and focusing only on the taglines for the products, revealed a rich source of information about how respondents feel about products, how males differ from females, how self-rated hunger drives different pattern of responses to the taglines, and uncovered three new-to-the-world mind-sets. The results suggest that taglines, often assumed to be ‘throw aways’ in test concepts, can actually provide a measure of the way the respondent feels about the food, this measure obtained in a subtle, almost projective fashion, with the focus on the internals of the person, not on the externals of describing the food and the eating.
Introduction
Researchers who focus on attitudes towards food do so from many angles, with interest ranging from the influence of physiological status on food, to the identification of what is important to a person’s decision making, and even to the messaging which drives decision making. The latter is especially important in the world of business, where it is critical to know what to communicate about food. Most of the research comprises questionnaires about how a person feels, whether this feeling is a simple acceptance scale [1], or deeper questions, such as what the respondent thinks about during the moments of craving a food [2-4]. The literature of attitudes towards foods has produced many thousands of papers, if not more, has been the subject of scientific investigation for hundreds of years, and a topic of interest in the popular media for decades, simply because we almost all enjoy food.
Two decades ago, during the early years of the 21st century, the senior author partnered with colleagues to create database of the mind of the consumer, focusing on food. The idea was to study 20-30 foods (or beverages), using the newly emerging science of Mind Genomics, to identify what was important to the consumer respondent. Rather than instructing the respondent to directly rate aspect by aspect in terms of importance to food, and especially to craving the food, the strategy was to create mixtures of messages, of the type that people encounter in everyday life. The messages comprised aspects such as the description of the food, the ambiance of consumption, the brand, and what was then considered a ‘throw-away’ space filler, but one which was oriented towards the fun of eating. This was ‘Silo C’, the ‘tagline’.
The research proceeded by mixing together these messages according to an underlying set of recipes, the so-called experimental design (REF). Figure 1 shows an example of the stimulus. The respondent did not see the boxes at the left, but simply saw combinations of elements, the messages, shown in the center of Figure 1. The respondent’s task was simply to read the vignette, and assign a rating. The task required the respondent to read and evaluate 60 different combinations, a task which took 10-12 minutes. Although the array of combinations, the so-called ‘vignettes’ seems like a set of randomly constructed combinations, the reality was and remains that in these Mind Genomics experiments great care is taken to create systematic combinations, each combination or set of 60 vignettes different from every other set, and each vignette comprising precisely the correct set of combinations to allow analysis by OLS (ordinary least-squares) analysis, even at the level of the individual respondent [5]. This design is called a permuted experimental design.

Figure 1: Example of a vignette
To the respondent, the test combinations may appear to be haphazard combinations of messages the respondent was simply asked to read the combination, and rate the combination. The rating was ‘How intense is your craving for this FOOD NAME HERE IN CAPS). Most respondents looking at Figure 1 (without the call outs, but simply with the material present on the screen) begin by trying to ‘give the right answer’, but in the end the task to discern the pattern gives ways to a pattern of ‘read and rate.’ For the most part the respondent pays attention, but is not engaged in the task. The respondent is doing the task, but with little clear involvement, something which occasionally worries the researcher who would rather see a deeply engaged respondent. It is hard to be engaged when one has to evaluate 60 of these systematically created vignettes, but respondents do it, especially when they are motivated by rewards. The pattern makes it impossible for the respondent to game the system; Mind Genomics uses the statistical discipline of experimental design to create the combinations. When the study with 30 foods was done in 2002, the design used then was the so-called 4×9. The 4×9 design called for four silos or questions, each silo or question populated by nine different answers, or elements. The underlying experimental design called for 60 vignettes for each respondent, most comprising four elements, some comprising three elements, and some comprising two elements. Each respondent was given a different, permuted set of combinations, so that the combinations cover a great deal of the design space (rather than focusing on a narrow set of combinations, reducing the variability around those combinations, assuming those combinations are the correct ones to investigate.
The expectation was that the respondent would respond most strongly to the elements in Category 1 (product features), and perhaps secondly, to elements in Category 4 (brand, benefit). It was not clear what would be the response to elements in Category 2 (situation, mood), and especially those elements in Category 3 (emotional attribute, hereafter call ‘taglines’).
With this introduction, we now proceed to the actual experiment. Keep in mind that the analyses of these data is really a reanalysis of the results almost 20 years later, bringing into the work experience from two decades, and the evolution of thinking about what these data mean. The focus here is no longer on the rest of the data, but rather on what can be learned from the data of Category C, the ‘taglines’ or the emotional elements. The study here focused on teens, a continuation of an earlier studier of the same type, dealing with adults, using the same material, but focusing on older respondents [6]. The work with teens at that time was part of the expansion of Mind Genomics across test populations, especially beyond North American adults. Research among teens was the first major effort in this expansion, with the focus beyond foods to entertainment such teen e-zines [7].
The study reported here moves beyond the simple report presented first in 2002 to the IFT (Institute of Food Technologists), and appearing in a cursory overview in the journal Appetite in 2009 [8]. Those early presentations were made to a world of researchers who had never seen the It! studies, and were presented with a superficial view of this new approach to understanding people. It suffices simply to present the study is brief, since there was nothing like these new-to-the-world It! studies.
The analysis now focuses on the taglines, the nine emotion descriptors (C1-C9), previously considered minor. In It! studies these types of elements usually generated coefficients, utility values, hovering around 0, sometimes positive (viz., driving craving), sometimes negative (viz., not driving craving). In the interests of the science of that time, the formative years 2001-2005, these elements were ignore because of their poor performance in terms of their ability to drive rating ‘craving.’ With the increasing focus on clustering people with like patterns of response to these elements, and with the opportunity to compare the same elements across the many foods of the study, the reanalysis beckoned.
Method
Mind Genomics project are set up in a certain fashion, and analyzed to reveal patterns [9]. Over the years, the design has been modified made shorter Yet, despite the evolution towards simplicity, the Mind Genomics approach has become routinized, and the analysis made simpler, almost following a script [10]. The benefit of that ‘processization’ is that the research can focus on the data, the findings, and not on dealing method again and again. We present the process as the skeleton for reanalyzing the data.
Step 1: Choose the Foods to Study
Figure 2 shows the list of foods. Figure 2 comes from landing page to which the response is directed, for those respondents who choose to participate. As yet, the respondents do not know anything about the study. They are simply invited to participate, choosing the food they want. The objective was to have the respondent evaluate the foods that she or he liked. When the quota was filled (95 participants), the food and its button ‘disappeared’ from the screen, forcing the respondent to choose another food. The foods were the same as were used in the previous study, this time with adults [11].
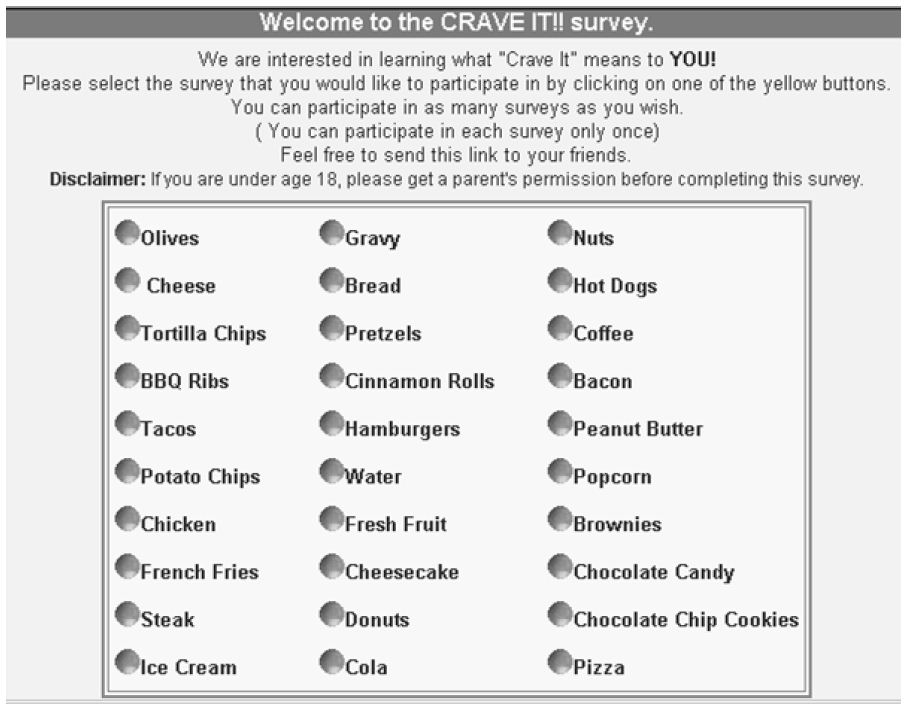
Figure 2: The 30 foods available for the respondent. The teen respondent went to the site, and chose the study which seemed most interesting
Step 2: Create the Design Structure and the Elements
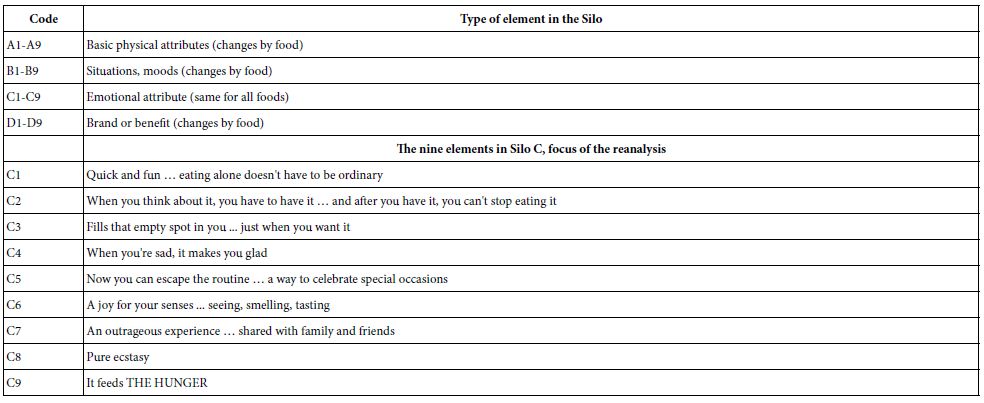
The It! studies run 20 years ago were characterized by the 4×9 design, four ‘silos’ (categories in Figure 1) each with nine ‘elements’. The experimental design for Mind Genomics is set up to ensure that mutually incompatible elements are never allowed to appear together. That is the function of experimental design serves both a science role to allow for strong analysis at the level of the respondents (within subjects design) and a bookkeeping role to ensure that certain mutually incompatible combinations never occur, such as two different foods appearing together. Table 1 lists the key features of the 4×9 design.
Table 1: Key features of the design
Step 3: Combine the Elements into Vignettes, according to an Experimental Design
The typical approach espoused by researchers is to isolate the variable and study the variable in depth. The reality, however, is that the respondents don’t think about most things in their lives as being one-dimensional since meaningful things in their lives are combinations of features. If we want to learn about the relevance of each of the variables, the most practical thing to do is to systematically change the nature of the variables, creating several combinations, and then evaluate the combinations. This more practical strategy calls for experimental design.
The objective of experimental design is three-fold:
- Balanced, equal number of presentations of each element.
- Statistical independence, so that individual elements appear in a pattern making them statistically independent of each other, even at the level of the individual respondent. This first objective ensures that the data can be analyzed by OLS (ordinary least-squares) regression, at the level of the individual respondent, allowing for deep analyses. The ‘incompleteness of vignettes’ ensures that the coefficients emerging from the OLS regression possess the property of being absolute numbers, comparable across different studies.
- Bookkeeping, ensuring that mutually contradictory elements never appear together, such as two different stores in which the product is sold, or two different moods.
Step 4: Launch the Study, Collect the Ratings
Although there has been an ongoing effort to source market research respondents from individuals who volunteer their time (viz., using messages such as ‘your opinion counts’) the reality is that the studies are easier when one sources the respondents from company specializing in online research. These panel providers work with many respondents, and deliver respondents for a fee.
It is worth noting that the respondents were provided by a Canadian company, Open Venue, Ltd., in Toronto, Open Venue specialized in recruiting respondents for these types of online studies. It might seem more economical to recruit one’s own respondents, but the truth is that the study takes a very long time to complete. With Open Venue, and with the popular topic of food among teens, the 30 studies required a day or two to complete. The entire study took about three or four days in 2002.
The screening specifications were only about half males, half females, ages 16-20. The gender and ages were the proprietary information of Open Venue, Ltd. As is typically the case, the ages may have been somewhat out of date, so some respondents were older than their panel information would have one believe, simply because the ages were not updated every day.
The respondents were invited, went to the site shown in Figure 2. This first landing page invited the respondents to choose food. After the respondent chose the food, the respondent read the orientation page. All 30 studies began with the same orientation page, albeit individualized with the specific food name. The orientation page presents little information about the study. The reason for such paucity of information in the set -up is that the respondents are to be judging the food, and their craving for the food strictly on the basis of the information provided in the test vignette (Figure 2).
Figure 1 presents an example of a 4-element vignette, showing the category (viz., silo) from which, each element originates. The actual vignettes do not show the silo or the identification number of the element. Rather, the vignette simply shows the elements prescribed by the experimental design, in unconnected form. Having connectives in the vignette is neither necessary nor productive. Respondents inspecting a vignette do not need to have the sentences connected. They simply need to have the information available in an easy to discover way. Figure 1, in its spare fashion (without explanatory material with arrows), does just that.
Steps 5 and 6 – Create the Database Showing Respondent, Vignettes, Rating, and Answers to Classification Question
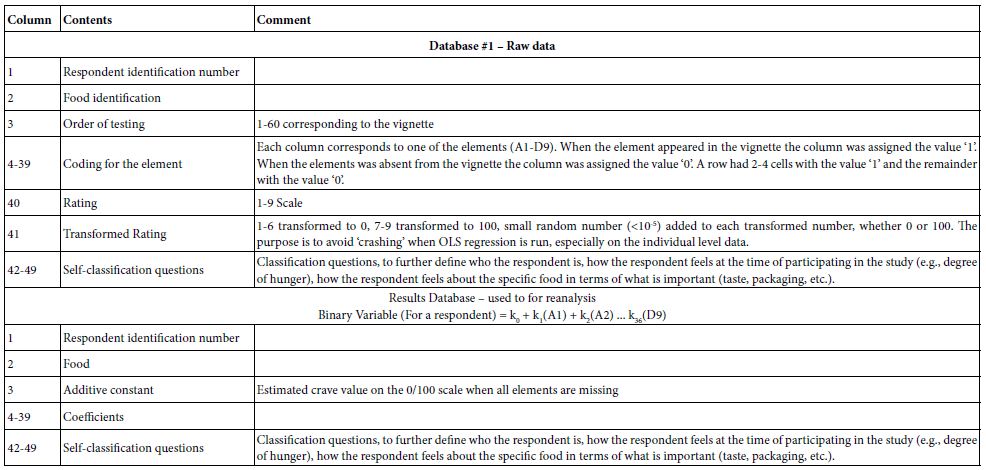
Mind Genomics is set up to acquire data in a structure, rapid, and efficient fashion, almost ready for statistical analysis after two transformations. Each respondent who participated was assigned a panelist identification number. The respondent’s data from the 60 vignettes were put into a database to which each respondent contributed 60 rows of data. Each row corresponds to a respondent and a vignette presented and evaluated. The Mind Genomics program constructed the vignettes ‘on the fly’ as the study was progressing, presented the stimulus, acquired the response, and populated the database, all in real time. The construction of the database appears in Table 2.
Table 2: Construction of Mind Genomics data for the Teen Crave it study
Step 7 – Result for Total
The database constituting the focus of our attention be the database emerging from the use of the OLS (Ordinary Least Squares) regression on the data of each individual. Thus, we will deal with 2000+ equations, and in the same form, different only by the respondent who generated the equation and the food. Our focus will be only on the coefficients of C1-C9, the tag lines as we have called them.
The rationale for focusing only on the tagline is that in study after study, these taglines never perform as well as the elements which describe the product. Yet, the advertising agencies focus on these elements. In previous studies of this type, and in virtually every study, the emotions, and taglines, so often felt to be important by salespeople, but technical people as well, score poorly. By ‘poor’ is meant low values for the coefficients. The ingoing explanation is that people focus on the food, and not on the feelings about the experience. In the worlds of poetess Gertrude Stein who opined for many objects and people ‘‘there’s no there there’. Certainly, there is a point to that statement since there is nothing about real food and real life in tagline elements, C1-C9.
Table 3 shows the summarized results of food (row) by tagline (column). The data come from the summary table of coefficients described in the bottom part of Table 2, dealing with the databasing of the summary models. The table presents only positive coefficients of 2 or higher. The negative and zero coefficients are not shown. Thus, these positive coefficients are those which drive craving. The coefficients in Table 3 are averages from all of the respondents who participated in the particular study. All coefficients of 8 or higher are shaded, corresponding to the fact that these coefficients are statistically significant (p<0.95).
Table 3: The foods and the elements, showing only those combinations with coefficients 2 or higher. The foods are sorted in descending by the sum of the coefficients across the elements. The elements are sorted in descending order by the sum of the coefficients across the foods
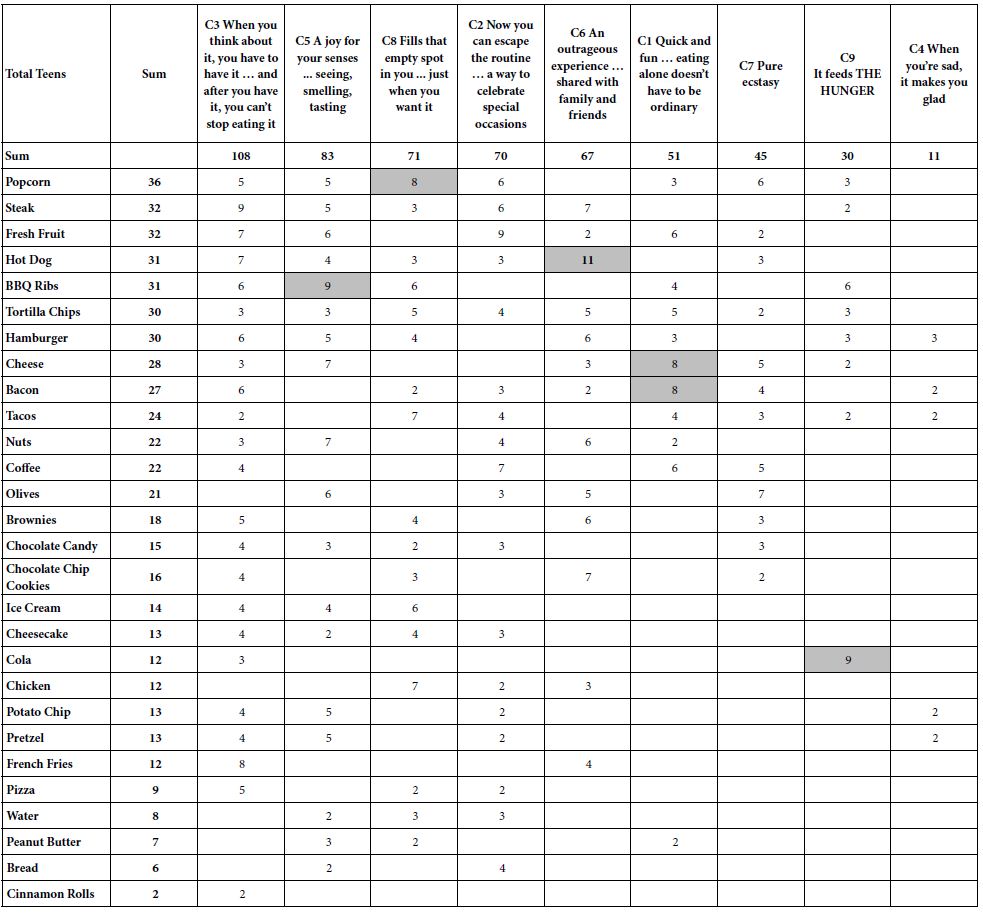
The foods are sorted from top to bottom by the sum of the positive coefficients (+2 or higher), as shown in Table 3. Thus, the food with the highest sum of coefficients is popcorn, the lowest is cinnamon rolls. Then the columns are sorted from left to right in descending order, so that the element with the highest sum of coefficients (When you think about it, you have to have it … and after you have it, you can’t stop eating it) is at the left, and the element with the lowest sum of coefficients is at the right (When you’re sad, it makes you glad).
The table as constructed from the Total Panel provides virtually no insight, except for the observation that only six elements generate coefficients of +8 or higher, and only among one of the nine tagline elements, C1-C9. It should come as no surprise that for virtually of the It! studies reanalyzed during the past 20 years, these ‘tag lines’ have been discarded, because they seem not to have any profound insight about the mind of the respondent. The coefficients are low, and even when they are studied together with other elements, such as the names of foods, and the health benefits, these ‘tag lines’ seem to vanish into irrelevance. Parenthetically, it would take 20 years, and a separate way of thinking about Mind Genomics data of this type, in a specific format, to provide the impetus to reanalyze the data, and to reveal new findings and patterns reported here.
Step 8 – Results by Gender
Respondents classified themselves by gender. Thus, it was straightforward to compute the average for each of the nine elements by gender and by food. Rather than total, we present the results for by gender. When we separate the respondents by gender we have many more elements with positive coefficients. The patterns are easier to discern when we retain for consideration only those average coefficients of 10 or higher, for a specific gender/food/element combination. The other averages, 9 or lower, are eliminated from the table. We also eliminate any element whose sum of positive coefficients is 23 or lower. (Parenthetically, the original cut-off point for sum of positive coefficients for an element was 24 or lower, but that would have eliminated males.
Table 4 shows a dramatic pattern. Teen Females show far more strong performing combinations, and the magnitudes of the coefficients are higher. The difference is simple. Teen females appear to crave meat; teen males appear to crave chocolate and sugar.
Table 4: Strongest cravings for genders based upon the tag lines

Step 9 – Results by Self-rated Hunger at the Time of Participation
The respondents were instructed to rate their hunger on a 4-point scale. Table 5 compares the coefficients for the elements by food, again showing only coefficients which are 10 or higher. Unexpectedly, few foods show strong coefficients for the taglines, perhaps because there may be other elements, such as food description, which are more salient when a respondent is hungry. When we look through the lens of the tag line, we see only three emerging. For those with low hunger the foods are steak and nuts, and the taglines are celebration. For those with moderate to high hunger the only element which really satisfies the requirement is an olive, perhaps because of the noticeable salt taste.
Table 5: Strongest cravings during hunger state, based upon the tag lines

Step 10 – Identify Mind-sets in the Population Showing different Patterns of Coefficients
A hallmark of Mind Genomics is the discovery of mind-sets, similar patterns of responses to elements from respondents who seem otherwise not related to each other by the pattern of their self-described profiles in a classification questionnaire. Typically, a study may generate 2-3 mind-sets when the topic is multi-faceted. More mind-sets or clusters can be generated but with the increasing number of mind-sets the power of the clustering decreases because the results become increasingly harder to use.
The clustering here is done independent of the specific food, viz., incorporates all of respondents into one dataset, and clusters that dataset. The only information used for the cluster is the set of nine coefficients. Furthermore, those respondents whose coefficients were all 0 for the nine coefficients were eliminated ahead of the clustering, because they showed no pattern of differentiation among nine tag line elements, C1-C9.
The k-means clustering program computed the pairwise ‘distance’ between each pair of respondents, by computing the Pearson correlation. The correlation, in turn, is a measure of the strength of a linear relation, with a high of +1 to denote a perfect linear relation between the coefficients of two respondents, down to a 0 to denote no relation, down to a low of -1 to denote a perfect inverse relation. The distance (defined as 1-Pearson R) goes from a value of 0 when two respondents show perfect correlation in their coefficients, up to a value of 2 when two respondents show perfect inverse correlation [12].
The clustering was done on the nine coefficients for each respondent, independent of the specific product the respondent was evaluating in the Mind Genomics experiment. Each respondent generated additive constant and 36 coefficients, one for each element. The analysis kept only the coefficients C1-C9, which constitute the focus of this analysis. In most Mind Genomics studies the deconstruction of the respondent population into mind-sets allows the different, often opposite-acting groups, to emerge. The groups no longer cancel themselves out. This can be said for the mind-sets developed out the tag lines. Table 6 shows three clearly different groups, with higher coefficients for the different foods. Furthermore, the groups make intuitive sense.
Table 6: Strongest cravings during hunger state, based upon the three emergent mind-sets

MS1, Mind-Set 1, appears to respond to elements C7 and C5, focusing on eating as recreations. The foods make sense.
MS2 appears to response to elements talking about an internal strong response, a ‘high’. The foods are unexpected, popcorn, steak, and water, respectively. The reason for this is not obvious at this time.
MS3 appears to respond to elements about eating as sensory pleasure. The three foods are all laden with sugar and are soft in text or even liquid; peanut butter, ice cream, and cola.
Classification
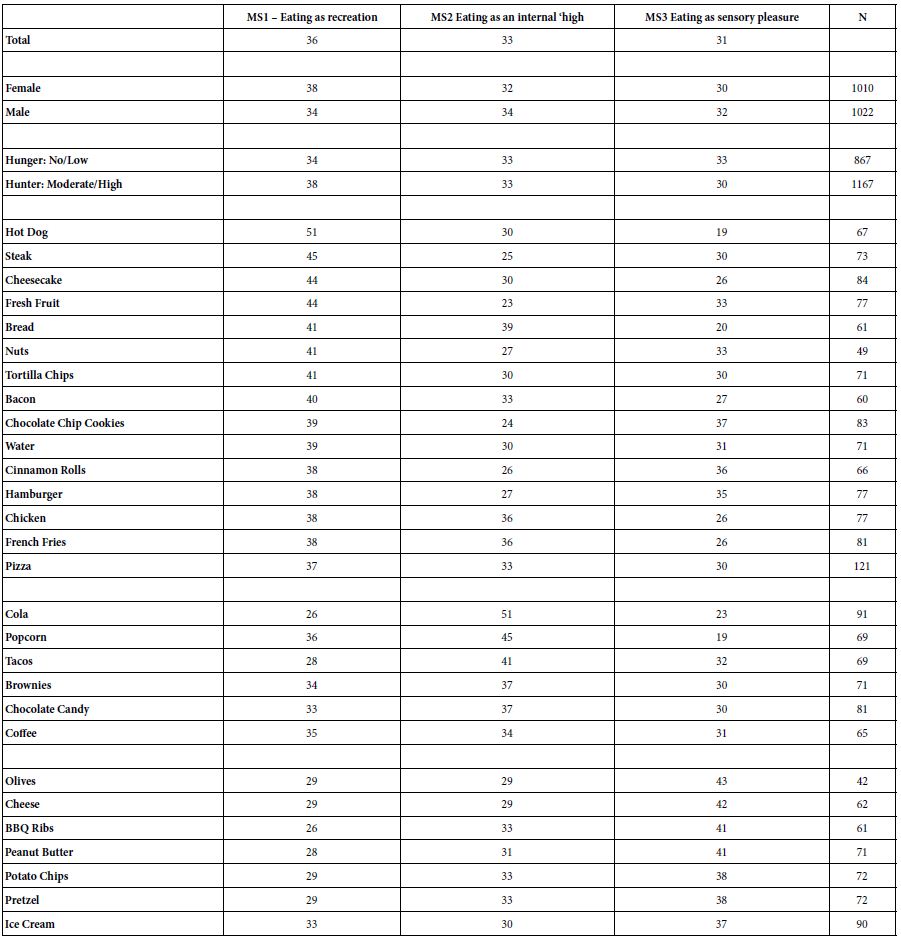
Table 7 presents the classification of respondents into the three mind-sets, by total, then by gender, self-reported hunger and food, respectively. There are patterns of mind-sets vs. food, e.g., for hot dog 51% of the respondents fall into MS1, whereas for cola 51`% of the respondents fall into MS2, and for olives 43% fall into MS3. There are no clear patterns, but the Mind Genomics approach permits the researcher to move beyond the conventional psychographic clustering often heralded as a major advance beyond clustering based upon geo-demographics [13].
Table 7: Distribution of the three mind-sets by key groups (total, gender, self-reported hunger, food study in which the respondent participated)
Discussion and Conclusions
The original analysis for the Crave It! studies focused on the strongest performing elements, looking at the different foods, as well as the different groups within each study, specifically gender. The effort to discover mind-sets had originally motivated all of the It! studies, the Teen Crave It! no different than any of the others.
The results of the early studies revealed that the respondents divided most strongly on the response to the food and to the eating experience. The ‘tag lines’, shown in Table 2, were low in comparison to the coefficients for the different foods and in each study. Again and again, the foods themselves and the eating situations showed double-digit positive coefficients, and an occasional negative coefficient. The obvious conclusion at that time was that the tag lines are unimportant, at least during the early 2000’s when the It! studies were run.
The observation leading to this paper was not so much an observation as a question. The question was simply ‘what would happen if we were to look at the coefficients of the tag lines’, not from the total panel, but broken out into foods, gender, stated hunger, and even use the coefficients of these tag lines (C1-C9), alone, by themselves, to generate mind-sets? The decades of experience of with Mind Genomics had revealed, again and again, that the simple and rather startling result that of coefficients around 0 often hid profound, interpretable, and instructive differences between groups, occasionally differences that could be labelled ‘remarkable.’
The analysis with the tag lines reveals a world of insight lurking below the surface of these relative low coefficients, doing so for elements which do not at the surface pertain to food in the way that food names and eating situations do (Elements A1-A9, and elements B1-B9).
The most difficult part of the analysis was to enable the discovery by paring away the extra numbers. It is one thing to pare away noise which is clearly noise, elements which are negative or close to zero. The focus is on the food. The elements which score high with regard to that food, especially on the rated attribute of craving, allow the pattern to come through. In this analysis, however, we are searching for a more amorphous pattern, not one easily observed. The issue becomes to create criteria which allow fair elimination of a lot of the data, without so-called ‘p-hacking’ or searching for effects, and then claiming those effects to have emerged as reportable outputs from the study and expressed within the original hypothesis. For these data the discovery of the patterns is a matter of paring away different sets of coefficients, pertaining either to foods (rows) or elements (columns), so that the underlying pattern makes sense. That approach, subjective in nature, consists of eliminating foods which generated low coefficients across elements, and eliminating elements which generated low coefficients across foods do so in an iterative fashion until the patterns become stable, and the story emerges, perhaps even compelling.
Thus, the analysis closes; the ‘story’ now expands to promote the relevance of tag lines as a new way to understand the mind of the consumer in the case thinking about foods. It may be these taglines, almost throwaway, amorphous statements, which provide new insights. In a sense, the tagline becomes the screen onto which the other aspects of the respondent’s mind are projected; witness the emergence of the three mind-sets.
References
- Pilgrim FJ, Peryam DR (1958) Sensory testing methods: A manual (No. 25-58). ASTM International.
- Harvey K, Kemps E, Tiggemann M (2005) The nature of imagery processes underlying food cravings. British Journal of Health Psychology 10: 49-56. [Crossref]
- Tiggemann M, Kemps E (2005) The phenomenology of food cravings: the role of mental imagery. Appetite 45: 305-313. [Crossref]
- Weingarten HP, Elston D (1991) Food cravings in a college population. Appetite 17: 167-175. [Crossref]
- Gofman A, Moskowitz H (2010) Isomorphic permuted experimental designs and their application in conjoint analysis. Journal of Sensory Studies 25: 127-145.
- Moskowitz H, Silcher M, Beckley J, Minkus-McKenna D, Mascuch T (2005) Sensory benefits, emotions and usage patterns for olives: using Internet-based conjoint analysis and segmentation to understand patterns of response. Food Quality and Preference 16: 369-382.
- Moskowitz H, Itty B, Ewald J (2003) Teens on the Internet-Commercial application of a deconstructive analysis of ‘teen zine’ features. Journal of Consumer Behaviour: An International Research Review 3: 296-310.
- Foley M, Beckley J, Ashman H, Moskowitz HR (2009) The mind-set of teens towards food communications revealed by conjoint measurement and multi-food databases. Appetite 52: 554-560. [Crossref]
- Moskowitz HR, Gofman A, Beckley J, Ashman H (2006) Founding a new science: Mind Genomics. Journal of Sensory Studies21: 266-307.
- Biró B, Gere A (2021) Purchasing bakery goods during COVID-19: A Mind Genomics cartography of Hungarian consumers. Agronomy 11: 1645.
- Moskowitz H, Beckley J, Adams J (2002) What makes people crave fast foods?. Nutrition Today37: 237-242.
- Likas A, Vlassis N, Verbeek JJ (2003) The global k-means clustering algorithm. Pattern Recognition 36: 451-461.
- Wells WD (2011) Life Style and Psychographics, Chapter 13: Life Style and Psychographics.