Abstract
In this short article, a review of the subsurface geopressure forecast’s characteristic in relation to geological building blocks is briefly presented. Geopressure is the driving mechanisms of generating and migrating of oil and gas to their traps. Geopressure is a double edge sword. Most of the large hydrocarbon pools are embedded in this pressure zone, and on the other hand it can be a serious hazard for drilling crews and properties. The lack of understanding the prediction process can resulted in unintended miscalculation and ambiguous interpretation. The science of predicting the sedimentary column pressure profile drift is widely diverse and mostly driven by algorithms rather than the exploration prospect’s geological settings.
Introduction
Pore pressure prediction (PPP) is a process synonym of estimating the subsurface pressure before and post drilling. However, predictions should apply only if the calculation takes place before drilling. On the other hand, any estimation or assessment of the pressure from drilling records and logs data should not be considered as forecasts. They are pressure calibration or simulation instead of prediction. Subsurface pressure compartments are the response of sedimentation process, that lead to compaction and burial. Sand and shale/clay dominate most of the deltaic and shallow marine environments. Compaction due to sediment load leads to fluids expulsion out of the rock matrix that leads to increase pressure. Terzaghi and Peck (1948) [1] illustrated this process with a mechanical device filled with water. Most of the geopressure scholars believe the clastic sedimentary column is divided to two sections: Normal and Abnormal pressure (geopressure) zones. Eaton (1975) [2] made a successful leap to build the base model of calculating subsurface pressure increasing with depth using petrophysical properties (sonic, resistivity and density). The assumption of two main subsurface zones were utilized in his assessment as well. Shaker (2015) [3,4] recognized a new concept in the presence of 4 pressure zones in offshore and 3 zones in onshore in the clastic sedimentary columns. Based on the new established subsurface compartmentalization, a geological based prediction model of the subsurface geopressure is attained. This was an eye opener for some of the unintended pitfalls of geopressure prediction methods.
The Basic Geological Framework
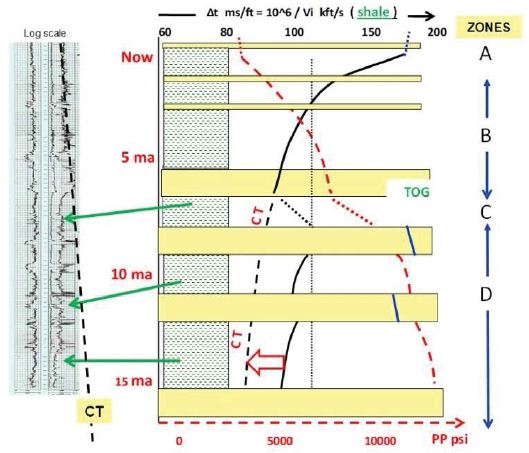
Sediments reach the depositional basin carried by water through the water shed feeder areas. Suspended detrital grains begin the slow consolidation and compaction throughout time and additional load. During the periods of high sea stand, capable competent seals form. The top seal represents the choking barrier for the subsurface fluids outflux. This is referred to as the top of geopressure (TOG). Studying many subsurface petrophysical properties behavior led to the updated conclusion of subdividing most of subsurface clastic into four main pressure compartments [3,4). This is because the change in porosity and consequently pore pressure directly impacts the rock sonic velocity, electric resistivity, and density. Figure 1 exhibits, in a nut-shell, the relationship between 15 million years of compartmentalized sedimentary sequence, velocity (sonic ∆t) profile drift due to compaction, pressure in psi, and the designated four zones (after shaker, 2019) [5]. The compaction drift of the data (sonic/resistivity etc.) in zone B [4,5] follows an exponential trend. The deeper extension of this trend is used to estimate the pore pressure (Figure 1).

Figure 1: Exhibits P-D conceptual cartoon plot represents a 15 million years four zones (A,B,C,D) of high sea stand shale beds interbedded with reservoir sand beds . Shale Velocity drift with depth reflects the pressure increase changes across the shale beds. CT is the compaction trend. Red arrows represent the Effective Stress [1,2]. The right display is in linear scale (exponential compaction trend), whereas the log display on the left is in logarithmic scale (linear compaction trend).
The following are some basic criteria for pressure prediction calculations:
- Predicting pore pressure (PP) is before drilling and calibrations/simulation are during and post drilling.
- Predicting PP is always in the section below the Top of Geopressure [1,2,5].
- Petrophysical data should be representing the clean shale/clay lithology only [1, 2 ].
- Normal hydrostatic pressure resides in the very shallow zone (A) only [3,4,5].
- The deeper extrapolation of zone B compaction trend is used only to calculate the Pore Pressure (PP) in zones C (top seal) and the compartmentalized geopressured zone D [2,5]. It is designated as CT instead of NCT by [5].
- Calibration of the predicting pressure’s model should not rely solely on the measured PP (MPP) in reservoir sands. Mud logs and drilling records should be collaborated in this process [5].
Pitfalls
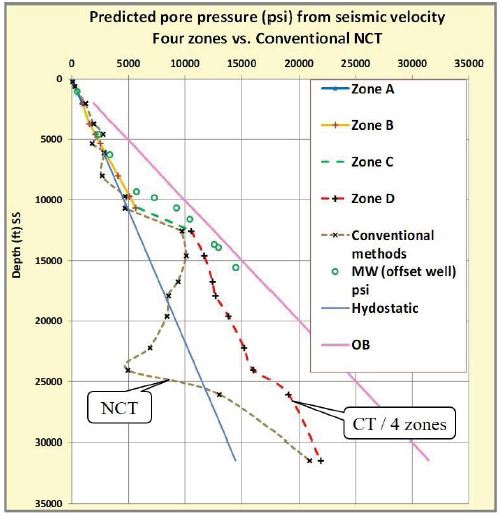
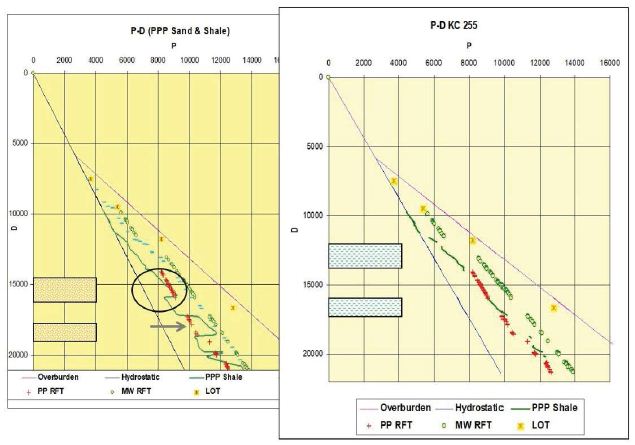
Most of the pitfalls in calculation of subsurface pressure is driven by the lack of geological and geomechanical building blocks input in the prediction model. Since excess pressure generation and causes are the product of stressed water bearing formation, principal and minimum stresses vectors should be known in addition of the overburden gravity vector (Shaker,2024) [6]. Applying the old theorem that subsurface pressure profile is divided to two segments (Normal and Abnormal pressure zones) separated by the TOG can cause substantial miscalculations (Figure 2). This is because the misleading assumption of considering the compaction trend data set represents a normally pressured sequence (NCT). Compaction and expulsion of fluids by differential pressure is not normally hydrostatic pressure gradient [5]. Sequence stratigraphy also can be a guidance to geopressure compartmentalization and assessing sealing verses breaching reservoirs (Shaker, 2002) [7]. Calibrating and simulating the predicted pore pressure in the shale with the measured pp using the wireline tools in the reservoir can lead to substantial calculation errors. This due to the fact that most of the effective stress methods are designed for shale beds [1,2]. Figure 3 shows the prediction modeling blunder if the prediction model is enforced to follow the measured pressure value data. Utilizing pressure prediction software does not include the manipulation of extracting certain lithology or the flexibility of maneuvering the stresses vectors especially in salt basins and can be a main source of unintended pitfalls [6].
The symptoms of pitfalls are usually revealed on the interpreted pressure plots such as:
- Predicting pressure data trace (values) facing a porous/permeable lithology especially in reservoir sands/sandstones e.g. Bowers, 1995 [8], Ehsan M. et al. 2024 [9], and Merrell et al. 2014 [10].
- Extrapolating a Normal Compaction Trend (NCT) that covers the entire drilled lithological section four zones e.g. Berry et al. (2003) [11].
- Swaying and breaking the NCT to separate segments for the purpose of matching the predicted pp in the shale to the measured pp in the sand reservoirs e.g. Kuyken. and de Lange (1999) [12].
- Predicting pp in salt basins utilizing the Overburden as principal stress (S1), regardless the effect of salt – sediments differential stresses and salt buoyancy e.g. Shaker and Smith 2002 [13], Merrell et al. 2014 [10], and Zhang and Yin, 2017 [14].
In summary, geopressure prediction modeling is a product of multi-disciplinary geoscience and engineering fields of expertise. Therefore, collaboration between these different disciplines can improve and enhance forecasting and simulate a bonified subsurface pressure profile.

Figure 2: P-D plot showing correlation between Predicting seismic Velocity – Pressure model using the conventional NCT vs. CT/4 zones. The data using NCT shows ambiguous profile whereas prediction data using the CT/4 zone shows a bonified prediction with an agreement with the data extracted from nearby offset well.

Figure 3: Shows two P-D plots for the same deepwater well. On the left panel measured reservoir’s pp (RFT) only used as calibration tool for Predicting PP in shale (PPP shale). Note the mismatch between the circle and arrow zones. On the right panel is the right prediction method that using the shale only for prediction modeling.
Acknowledgement
Special Thanks to Kate Mariana of the research open world for facilitate publishing this short article.
References
- Terzaghi K, Peck RB (1948) Soil mechanics in engineering practice. John Wiley & Sons, Inc. N.Y., Pg: 566.
- Eaton BE (1975) The equation for geopressure prediction from well logs. Society of Petroleum Engineers of AIME paper #SPE 5544, 11.
- Shaker SS (2015a) A new approach to pore pressure predictions: Generation, expulsion, and retention trio—Case histories from the Gulf of Mexico. Gulf Coast Association of Geological Societies Transactions. 65: 323-s337.
- Shaker SS (2015b) Velocity for pore pressure modeling. Society of Exploration Geophysicist Annual Meeting, 1797-1801.
- Shaker SS (2019) Pore Pressure Prediction Before and During Drilling Applying the Four Zones Method, Offshore Technology Conference, OTC-29517-MS.
- Shaker SS (2024) Pore and fracture pressures prediction — A new geomechanic approach in deepwater salt overthrusts: Case histories from the Gulf of Mexico, Interpretation. 12: T501-T521,
- Shaker SS (2002) Predicted vs. Measured Pore Pressure: Pitfalls and Perceptions, Offshore Technology Conference, Houston Tx., OTC 14073.
- Bowers GL (1995) Pore pressure estimation from velocity data: accounting for overpressure mechanisms besides undercompaction. Society of Petroleum Engineers Paper SPE–27488, PA, Pg: 7.
- Ehsan M, Manzoor U, Chen R, Hussain M, Abdelrahman K, Radwan AE, Ullah J, Iftikhar MK, Arshad F, Pore pressure prediction based on conventional well logs and seismic data using an advanced machine learning approach, Journal of Rock Mechanics and Geotechnical Engineering, Pre – Print
- Merrell, M.P., Flemings, P.B., and Bowers, G.L.,2014, Subsalt pressure prediction in the Miocene Mad Dog field, Gulf of Mexico. AAPG Bulletin. 98: 315-340.
- Berry JR, McCormack N, Doyle E (2003) Overcoming pore-pressure challenges in deepwater exploration. OFFSHORE, Penn Well Corp., Reservoir Engineering.
- Kuyken CW, de Lange F (1999) Pore Pressure Prediction allows for tighter pressure gradient control, OFFSHORE, Penn Well Corp., Drilling Technology.
- Shaker SS, Smith M (2002) Pore Pressure Predictions in the Challenging Supra / Sub-Salt Exploration Plays in Deep Water, Gulf of Mexico. AAPG Search and Discovery Article #90007, presented at AAPG Annual Meeting.
- Zhang J, Yin S (2017) Fracture gradient prediction: an overview and an improved method. Springer, Pet Sci 14: 720-730.