Abstract
Ninety-nine young respondents evaluated different combinations of messages about the effects of substance abuse and sleep issues. The test stimuli were messages developed by generative AI (ChatGPT 3.5). The research followed the process established by the emerging science of Mind Genomics. The study investigated four elements (messages) each about four topics related to drug use: dangers and negative consequences, health alternatives to drug use, in depth consequences when one uses drugs, how poor sleep affects mood, energy levels, and ability to focus. The 16 elements were combined by experimental design, the specific combinations of elements (messages) differing for all respondents. The rating was “Describes Me.” Analysis by ordinary least squares regression showed that no single message strongly applied to the entire panel of 99 respondents. Clustering to generate three mind-sets showed three distinct groups, easy-to-interpret response patterns. These are Leisure Enthusiasts who do not respond to the negative elements (n=44), Serious Behavioral Problems (n=31), and Emotion Issues with Impaired Judgment (n=24). AI summarized the mind-sets clearly at two levels, first in terms of strong messages and suggestions for new ideas, and then at a more global level. The paper shows the feasibility of creating databases of the mind at low cost, within a day, with powerful insights and direction for communication emerging from the process.
Keywords
Adolescent sleep issues, Adolescent substance abuse, Generative AI, Mind genomics
Introduction
The growing problem of drug use leading to sleep disorders among adolescents is becoming increasingly relevant to medicine specifically, but to society in general. According to current research, misuse of drugs made for children and adults may, in some cases, negatively affect sleep patterns, leading to a variety of health problems and cognitive deficits [1-3]. A conventional approach by practitioners provides targeted treatments and therapies to address both the drug misuse problem and the sleep disorders, considered as two different indications. Problems frequently occur when teenagers resist therapy or do not cooperate with prescribed measures, either or both making it difficult for healthcare professionals to effectively address the problem. The result is that adolescents suffering from drug use and sleep issues may express themselves in a number of ways, using language indicative of bewilderment, frustration, and pessimism. Emerging societal difficulties associated with drug use that cause sleep problems in teens include increasing rates of scholastic underachievement, social isolation, and mental health illnesses. In turn, parents of these adolescents may report feelings of shame, powerlessness, and concern for their child’s well-being, exacerbating the issue [4-6].
Parents may go to considerable measures to address this issue— these include obtaining help from mental health specialists, attending therapy sessions with their child, and adopting tougher regulations and monitoring to handle substance addiction and sleep problems. However, the complexities of drug use and sleep issues in teens coupled with other behavioral issues involved in maturation make long-term remedies hard to achieve [7,8]. When addressing the growing problem of drug use resulting in sleep disorders among teenagers, a key issue is how drug use affects the brain and interrupts young people’s normal sleep habits. Adolescent sleep patterns may also be influenced by external variables such as drug usage, which can cause increased anxiety, restlessness, and interrupted sleep cycles, as well as the social determinant of drug use. Certain medicines such as stimulants and depressants have been reported to interfere with the synthesis of neurotransmitters which govern sleep, making it harder to fall and remain asleep. Other factors to consider which lead to teenage drug use are social and environmental situations. For example, peer pressure, stress, and a lack of parental monitoring may all contribute to young people commencing and continuing drug misuse habits [9].
Helping the Young Medical Professional to Understand the Adolescent Mind
Medical professionals play a vital role in understanding the minds of their adolescent patients, especially when it comes to identifying and addressing substance abuse issues. Experience can be a valuable asset in this regard. Seasoned doctors may have encountered a wider range of cases and developed a deeper understanding of adolescent behavior and mental health. However, not all doctors have extensive experience with adolescent patients [10,11]. One standard way to learn about a patient’s mind is to use questionnaires. At the time of this writing, fall of 2024, the practice of surveys is well-established in many domains, whether medical, commercial, and even recreational. The interested professional focuses on the topic and attempts to generate a set of questions about that topic, with these questions requiring simple answers. The common practice is to present these surveys, either or person, or more frequently on the internet. The survey-taker, known as the respondent, completes the questionnaire [12].
Questionnaires are powerful tools to gather information about adolescent patients, their experiences with substance abuse, as well as their sleep problems. By asking targeted questions about drug use, sleep patterns, and related behaviors, medical professionals can gain a better understanding of the factors contributing to these issues. Various questionnaires have been developed for use with teens, providing valuable data that can inform treatment plans and interventions aimed at addressing substance abuse and sleep disturbances in young people.One of the interesting sidebars of the “survey business” is the biases that the survey creator, viz., the “researcher” encounters. Biases range from non-response (refused to participate) to indifferent (assigned random responses), and all too often attempt to “outsmart” the researcher by guessing what are appropriate, socially acceptable answers, rather than real answers [13].
Creating a system that allows medical professionals to understand the minds of adolescents poses a significant challenge when the doctor lacks experience or the patient is non-communicative. Traditional methods of patient assessment may not always be effective with younger populations, who may struggle to express their thoughts and feelings verbally. In such cases, innovative approaches—such as using targeted questionnaires or assessments specifically designed for teens—could offer valuable insights into substance abuse and sleep-related issues. One metaphor for understanding the minds of adolescent patients is the concept of taking a patient’s blood at the start of the patient-doctor interaction. Just as a blood test can provide valuable insights into a patient’s physical health, a metaphorical “phlebotomy of the mind” could help medical professionals assess the mental and emotional well-being of their adolescent patients. By developing a systematic approach to understanding the minds of young people, doctors may be better equipped to address issues such as drug use and sleep problems [2,14,15].
The Mind Genomics Set up Process — AI Generated/ Human Edited Questions and Answers, Human Generated Classification and Rating Scale
An alternative approach to asking single, disconnected questions about a topic is to present people with combinations of ideas or messages, and instruct these respondents (viz., our survey-takers) to read the combination and to rate the entire combination. Furthermore, these combinations are comprised of single messages, simple phrases, seemingly thrown together in a haphazard manner, although later we will show that this seemingly haphazard manner is far from the case. The combinations are structured according to an underlying experimental design [16]. The task is rather easy, although boring. The respondent sits in front of a computer screen. The respondent sees combinations of messages emerge. The respondent simply rates the combination. The average person simply goes through these combinations in almost an indifferent fashion, feeling like some how they are guessing. The reality is that there is an underlying structure, the ratings make sense, and the results show how people think.
The process presents people with ordinary “slices of life” created in a way that the respondent cannot “game the system.” Rather, after a moment of surprise, most respondents sit down and do the task. The respondent ends up “grazing”, looking at the vignette and then assign a rating. The system invokes what the late Nobel economist called System 1 thinking, where the responses are virtually automatic. The process works very well with motivated as well as unmotivated respondents. There is no requirement that the respondent think about the topic. Rather, it suffices that the respondent pays some attention to the material, and not just type the same answer again and again [17]. Mind Genomics requires four questions and four answers to each question. If that is done, the rest of the exercise is simple. But how does the researcher come up with these questions? The early history of Mind Genomics revealed a major block to the successful use of the approach. Many people, including professionals, ended up ‘freezing’ when instructed to provide four questions. It was simple enough to name the study, but the creation of questions posed problems— generally emotional ones. As an example, consider Figure 1: Panel A shows the screen as presented to the user. Figure 1, Panel B shows a completed screen. Often the requirement to create a set of four questions which “tells a story” becomes a daunting task, an obstacle to be overcome in the research process [18,19].
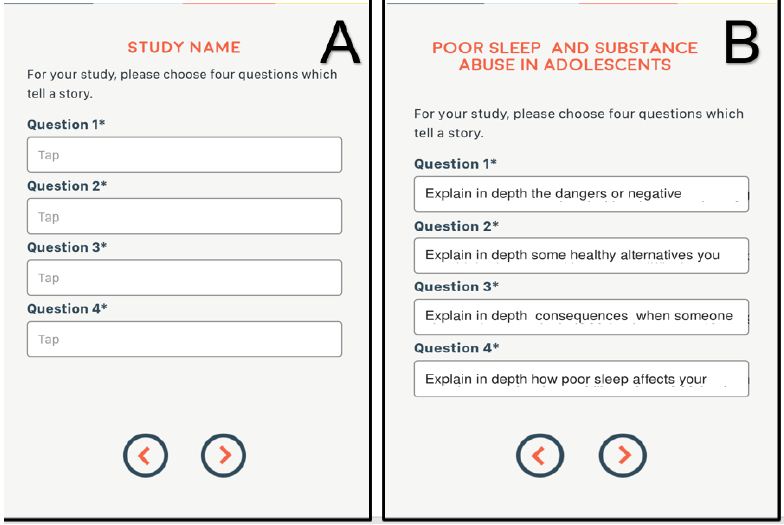
Figure 1: Panel A shows the screen as presented to the user. Panel B shows a completed screen
Recent enhancement of the Mind Genomics platform has incorporated AI in the form of LLM, large language models (here ChatGPT 3.5). The access to the AI is by means of Idea Coach, a small rectangle in which the user can type the request. Table 1 (top) shows the query as provided to the AI, and Table 1B shows the 15 questions generated from this first iteration. The query is simple, stressing simplicity and understandability. Once the user is satisfied with a question, it is a simple matter to select that question. The selection of a question results in the insertion of the question into the study. When the question has been selected, it is straightforward for the researcher to edit the question, polishing and formatting it so that the subsequent AI effort to “answer” this question will generate meaningful answers, rather than just questions which end up with yes/no answers. The same process is used to select four answers for each question. Idea Coach maintains the selected questions, allowing the user to iterate to find answers and then polish them before inserting the answers into the template [20,21].
In the use of the LLM, the questions and answers usually require some editing. The questions should be edited to encourage expansive answers, using words like “explain in detail”. This embellishment is important because the AI will use the questions themselves to drive the creation of answers. The research requires answers which paint a word picture. The only way to get those answers painting a word picture is to instruct the AI to “explain” or “embellish,” or “describe how”. These are words which generate meaningful phrases painting the word picture.
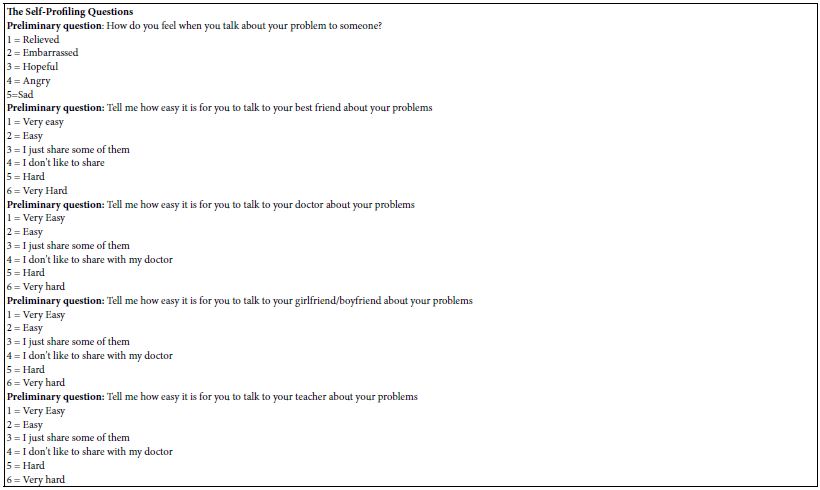
The next step creates the self-profiling classification questionnaire which enables the researcher to gain more information about the respondent. Two questions are automatically asked—age and gender. The researcher can ask up to eight additional self-profiling questions, each with a possible eight answers. Table 2 shows the self-profiling classification created specifically for this study by the researcher.
Table 1: The instruction to AI to create the questions (top), and the 15 questions created in this iteration.
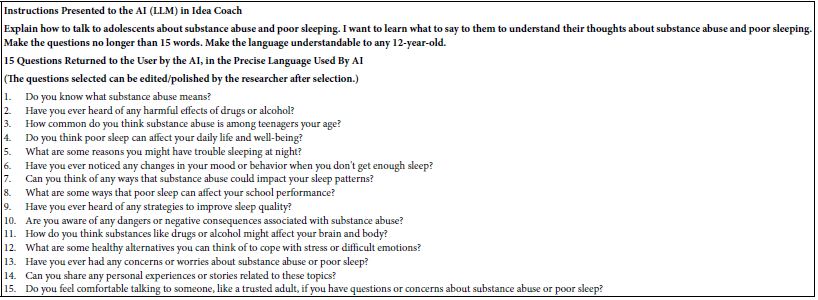
Table 2: The self-profiling questions and answers, completed at the start of the evaluation, before any vignettes are rated.
Creating Vignettes by Combining “Elements” (Answers)
Table 3 shows the four questions generated by the combination of the human researchers and AI. Under each question are the four answers. Each edited/polished question generated 15 answers. The researcher selected four answers, inserting the answers into the study after polishing them. As a consequence, the questions and answers in Table 4 are usually better than what would be generated even by an experienced professional. The user can run many iterations for questions and for answers, as well as polishing them to make them more precise.
Table 3: The “raw” material, comprising questions and answers
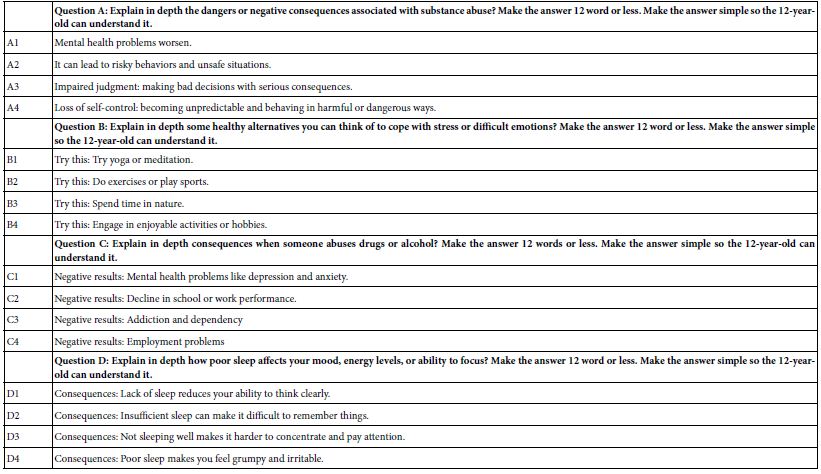
If this study was run as a typical study, then each of the 16 elements (A1-D4) would be presented as a single question, and the respondent (survey-taker) would evaluate each element independently. Of course, the researcher would randomize the order of the elements to reduce order bias. The biggest problem of these one-at-a-time evaluations is that they have no context—or at least the context may change depending upon the element.
The Experimental Design Underlying the Construction of the Vignettes
A better way might be to create combinations of these elements, doing so in a structured manner, so that the combinations, the vignettes, tell a story, albeit a story which has few connectives. Figure 2 shows an example of what the respondent might see.
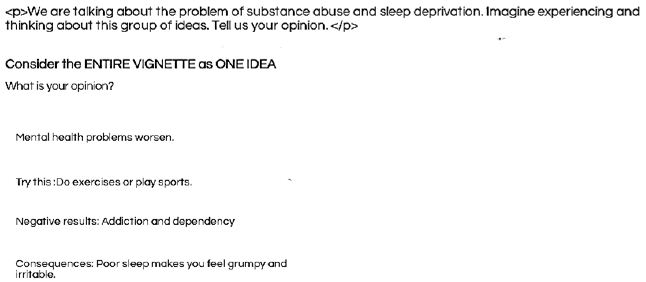
Figure 2: Example of what the respondent might see
Figure 2 looks disconnected but the respondent evaluating the vignette ends up with a sense of what is being communicated. After evaluating the first two or so vignettes, most respondents stop fidgeting and simply look at the vignette, and rate it on the scale shown in Table 4. It is important to note that Figure 1 does not attempt to present a polished paragraph to the respondent, one which reads well, with all the connectives. Although one might be tempted to “pretty up” the vignette, the reality is that the respondent has an easier time “grazing through” the sparse structure presented by the vignette. Less effort is required to identify the information in the vignette, and consequently the respondent can quickly evaluate each vignette. The happy consequence is that the respondent can go through the 24 vignettes quite quickly without incurring much fatigue.
The vignette is rated by the respondent on a simple 5-point scale shown in Table 4. The scale has two sides. The left side, the first part read, has the respondent decide whether the description in the vignette describes or does not describe them. The right-hand side has the respondent decide whether the description is typical or not typical. The rating question captures two aspects of the vignette, fit to the person, and typicality of the statements. These are not explained to the respondents. Most respondents end up having an intuitive sense of what the rating scale means. Their answers suggest that this intuitive sense of its meaning operates in the interview, as we will see below.
Table 4: Five-point rating scale

Experimental Design to Create Vignettes Which Represent “Slices of Life”
The Mind Genomics effort allows exploratory research rather than requiring confirmatory research. As such, the studies need not be based on theory, with the goal of confirming or disconfirming a hypothesis. Rather, the Mind Genomics studies end up encouraging exploration, intuition, and iteration. It is easy to react to combinations of messages, vignettes. We do it all day long, as we react at an almost automatic level to the world around us. Rather than asking ourselves “what is important about this vignette” or this particular situation, a task requiring thought, we simply react to what is around us. In colloquial terms we “go with the flow”.
By presenting respondents with combinations of messages, i.e., mixture of messages such as the answers (elements) shown in Table 3, we put the respondent into a more natural situation, one which resembles daily experience. All the respondent has to do is react. The structure of the vignette allows the researcher to present slices of life to the respondent, have the respondent rate the combinations of these slices of life, and when done, properly enables the researcher to numerically estimate the driving power of each of the 16 elements, even when the respondent themselves cannot do so. The experimental design will enable us to determine the degree to which each of the 16 elements fits the respondent. The key to success here is to present the “right” combinations of elements, the “right” slices of life.
The experimental design for Mind Genomics comprises one basic specified set of combinations, which is permitted into several hundred variations. Each variation differs in the specific combinations, but the mathematical structure is maintained, and the design is tested to ensure that it runs in the statistical analysis.
- The design requires four questions (aka categories, silos), each question associated with four answers (aka messages, elements).
- The underlying experimental design creates 24 combinations or vignettes.
- Each vignette has a minimum of two elements and a maximum of four elements.
- Each element appears equally often, meaning that it appears five times in the set of 24 questions and is absent 19 times.
- The experimental design lays out the structure of each of the 24 vignettes. Some vignettes will have only two elements. Some vignettes will have three Most vignettes will have four elements.
- The absence of elements in a vignette means that the combinations of these vignettes are incomplete. That incompleteness is deliberate. It allows the researcher to estimate the contribution of each of the 16 elements to the rating because there are situations where the element is missing. This is important for regression analysis, specifically dummy variable regression analysis,
- Up to now, we have created a set of 24 combinations for one respondent with the property that each question can contribute at most one element (answer) to a vignette, sometimes contributing no answer to the vignette, but never contributing two answers to the This is important for statistics and also ensures that the vignette will not present mutually contradictory messages.
- The 16 elements are statistically independent of each other.
- The final benefit or the final piece of information is that all of these vignettes, these combinations form one experimental design.
- The final task is to permute the design. We keep the basic structure of the design, but we change the specific combinations by changing the element numbers. For instance, A1 may become A3, A2 may become A1, A3 may become A2, and A4 may remain as This permutation must be checked to make sure that the elements remain statistically independent of each other. The result is several hundred permuted designs.
- Every respondent is presented with a different set of 24 combinations, although the mathematical structure remains the The practical benefit is that the researcher need not know anything coming into the study. The researcher need not know the correct combinations because the system itself will take care of it.
- To sum up, the underlying experimental design ensures that the researcher can understand how people respond to ideas, by forcing them to respondent to combinations, the vignettes, the aforementioned “slices of life.” Through statistics, specifically OLS (ordinary least squares) regression used by Mind Genomics, the driving power of each element emerges immediately in a way that cannot be “gamed.”
Fielding the Study with a Panel Provider (Or with One’s Own Patients)
Once those bookkeeping steps are done, the user contacts the panel provider—in this case Lucid Inc., a panel aggregator with access to tens of millions of people around the world. The actual panelists are the appropriate group, adolescents, who have agreed to participate in these studies. They receive rewards. To the authors, these respondents, these survey-takers, are totally anonymized. We have no idea who they are, no idea the reward that they get. Typically, to run 99 people as respondents requires approximately an hour or two from the time the email invitation is mailed out until the respondents complete the 3–4-minute survey There is a tremendous benefit of having a panel of paid, motivated people. Otherwise, it might take weeks and months to get the same number of respondents.
The panel provider is contacted, and the request is made for a specific age group, market, etc. The age range requested was 15 to 21 years old. No two respondents evaluated the same set of combinations. The result is that the study allowed us to explore a wide variety of combinations. As noted above, a key benefit is that there is no need to know the topic at the start of the project.
Transforming the Data and Creating Models Relating Elements to the Newly Transformed Binary Variable
Each rating generated a rating on the 5-point scale. A rating of 1, 2 or 3 was converted to 0. A rating of 4 or 5 was converted to 100. A vanishingly small random number was added to each newly created binary variable, the aforementioned 0 or 100. The reason for that is purely prophylactic. With the vanishingly small random number (<10- 2), one does not influence the analysis through ordinary least squares regression, but one guarantees that every one of the respondents will have variability in their newly created binary variables. The analysis is straightforward, whether we do it at the level of a group such as the total panel of 99 respondents, by groups defined by who the respondent claims to be based on the self-profiling classification, or even by individuals.
Recall that the dependent variable, the newly created binary variable, takes on 0 or 100, and each of the 16 elements has the value 0 when absent from the vignette, and 1 when present in the vignette. We create a simple equation of the form listed below:
Dependent variable= k1A1 + k2A2 + k3A3… k16D4. The magnitudes of the coefficients, k1 – k16, tells us the degree to which the appearance of the element in a vignette drive the respondent to say, “that is me.”
Recall that our respondents were just sitting there being exposed to a variety of messages embedded or combined in these vignettes. They had no idea what was going on. It was a “blooming, buzzing confusion” to them, in the words of Harvard psychologist William James. But throughout the effort, the respondents just simply sat there, grazed, as we said, through the vignettes, and assigned a number. Most of the adolescents, had we asked them, would have said they were guessing and would shrug their shoulders.
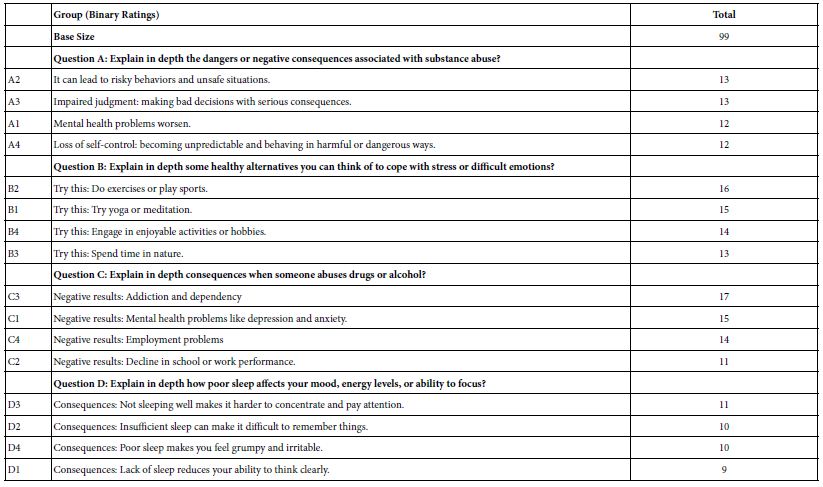
Table 5 shows the coefficients. The coefficients show the degree to which the element is perceived as saying “this is me.” We can consider the coefficients as conditional percentages. Thus, a coefficient of 10 means that 10% of the answers would be “that describes me”, were the element to be put into the vignette. From many of these studies, it would appear that a coefficient around 20 would be considered statistically significant. The rationale for this number is that the coefficients estimated with an additive constant show that a coefficient around 10 is statistically significant based upon a simple T test of coefficients. A model without an additive constant would show that same value of 10 to be 20. Thus, we create a simple operational rule that we should look for high coefficients of 21 or higher in models estimated without an additive constant, viz., models that are said to go through the origin.
With the following in mind, Table 5 suggests that no elements can be said to read our operational criterion of 21 or higher.
Table 5: Coefficients for the total panel for each of the 16 elements. Coefficients of 21 or higher denote very strong performing elements. The elements are presented in descending order of magnitude for each question.
Mind-Sets: Moving to ‘Deducing how a Person Thinks’ by the Pattern of the Coefficients
Individuals vary in their preferences, coping mechanisms, and interactions with medical professionals. We are also aware that individuals may or may not be capable of identifying what they consider to be essential. With the aid of Mind Genomics, researchers are able to comprehend emergent groups of individuals whose decision-making processes adhere to distinct sets of criteria. Mind Genomics enables the researcher to identify different mind-sets. Mind-sets are defined as people thinking the same way about a topic. The important contribution of Mind Genomics is its ability to create these mind-sets at the level of the granular, at the level of the problem and its specificities. By having a bottom-up approach, one can create mind-sets for any specific problem, such as the one we are dealing with right now. One does not need mental gymnastics to translate macro mind-sets to specific topics, an issue often calling for creative re-thinking, with the mind-set data reworked and analyzed to produce an answer for a specific granular problem.
To create the mind-sets, one uses k-means clustering, a well- recognized statistical approach [22]. In our specific case of 16 elements, each respondent has 16 coefficients. We compute the distance between all pairs of the 99 respondents—a simple statistic. That statistic is called D, for distance, and is defined as (1 – Pearson correlation). The Pearson correlation quantifies the strength of the linear relation between two sets of data. A Pearson correlation of +1 means a perfect linear relation, whereas a Pearson correlation of -1 means a perfect inverse relation. Respondents with high values of D, near 2 are always in the same mind-set or cluster. Respondents with low values of D near 0 are generally in different mind-sets or clusters.
Once the respondents are assigned to either two clusters or mind- sets or separately three clusters or mind-sets, it is simple to create new groups for OLS regression, which we saw above for the Total Panel in Table 6. This time we run five regressions, first for the two mind-sets, and then for the three mind-sets.
Table 6 shows us the coefficients for the two mind-sets and then for the three mind-sets. The sum of the number of respondents is always 99. Each respondent fits into only one of the three mind- sets. There are empty cells in Table 6, corresponding to the elements whose coefficients are 5 or lower. Finally, Table 6 is sorted by the mind-sets, with all elements failing to score strongly in at least of the mind-sets put at the bottom of the Table. The mind-sets for the three- cluster segmentation by k-means make intuitive sense. The mind- sets are coherent, even though the entire analysis was done strictly by mathematical principles without any appeal whatsoever to the meaning of the elements. The mind-sets emerge quite clearly.
Table 6: How the elements performed when the 99 respondents were separately divided into two mind-sets, and then into three mind-sets respectively. Strong performing coefficients of 21 or higher are shaded. The table is sorted by the coefficients for the three mind-sets to highlight the differences among the mind-sets.
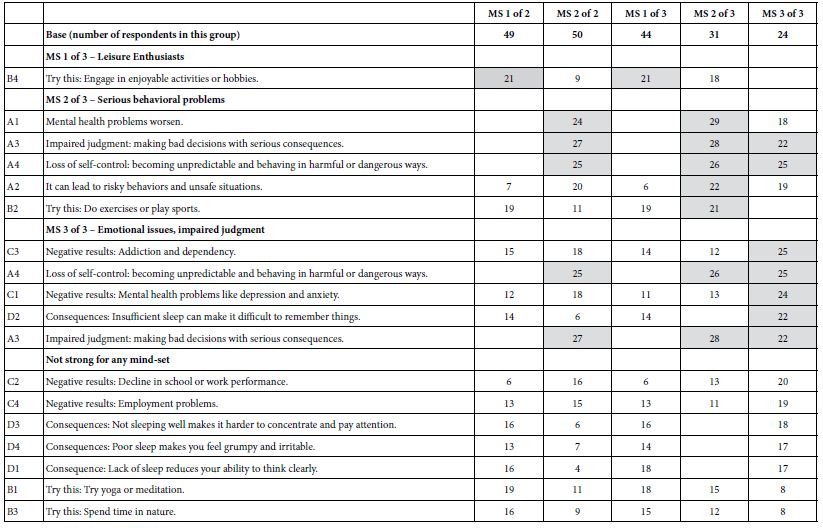
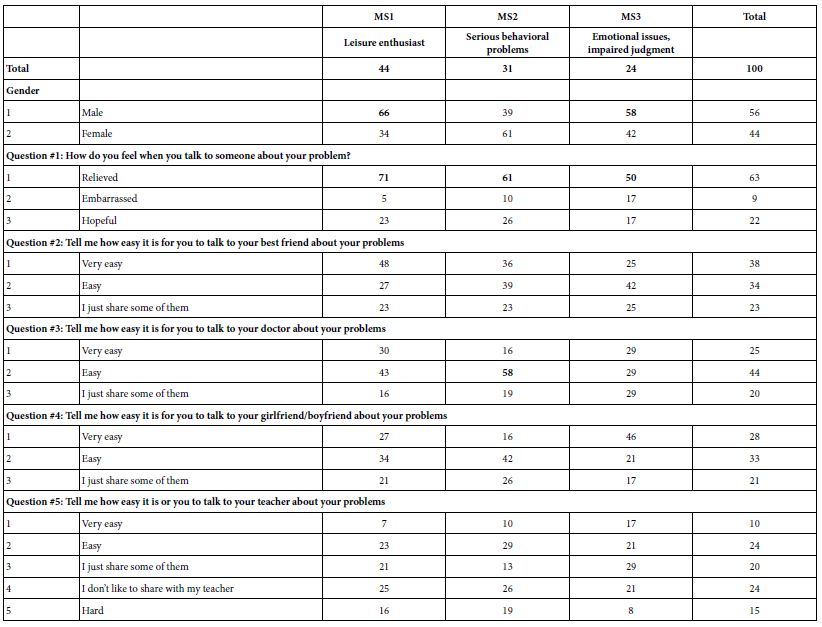
Table 7 shows the distribution of the selected answers for the three mind-sets, and for total panel. The distribution of the self-profiling answers by mind-set is unclear, in contrast to the clarity emerging from strong performing elements for each mind-set. There are some differences among the mind-sets, but the patterns are hard to discern, even though one might have expected to see more pronounced differences among the segments. It is this interpretability of mind-sets based upon very strong performing elements which enables Mind Genomics to create easy-to-understand “new knowledge.”
Table 7: The distribution of answers by mind-set and total for the self-profiling classification
Putting AI to the Task of Adding Insights to the Mind-Sets
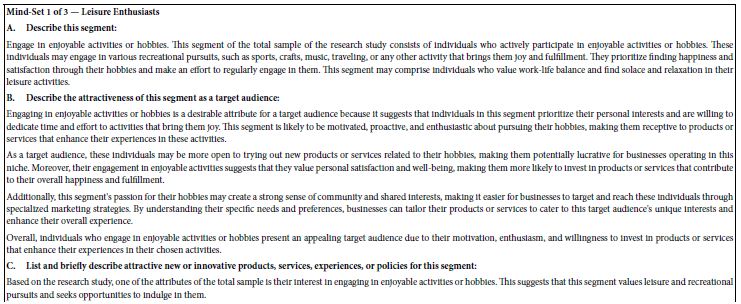
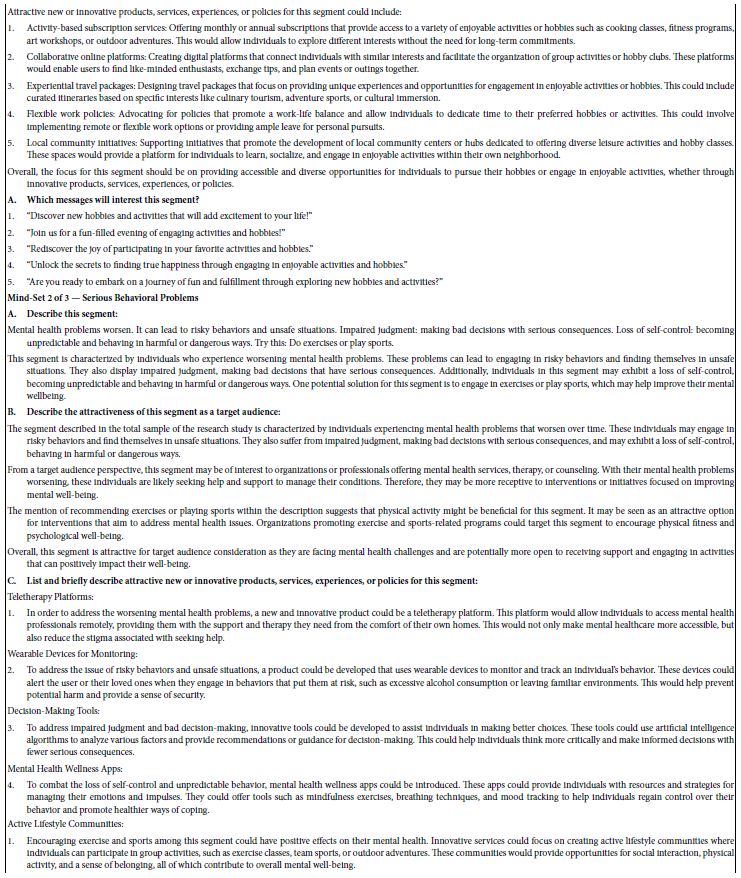
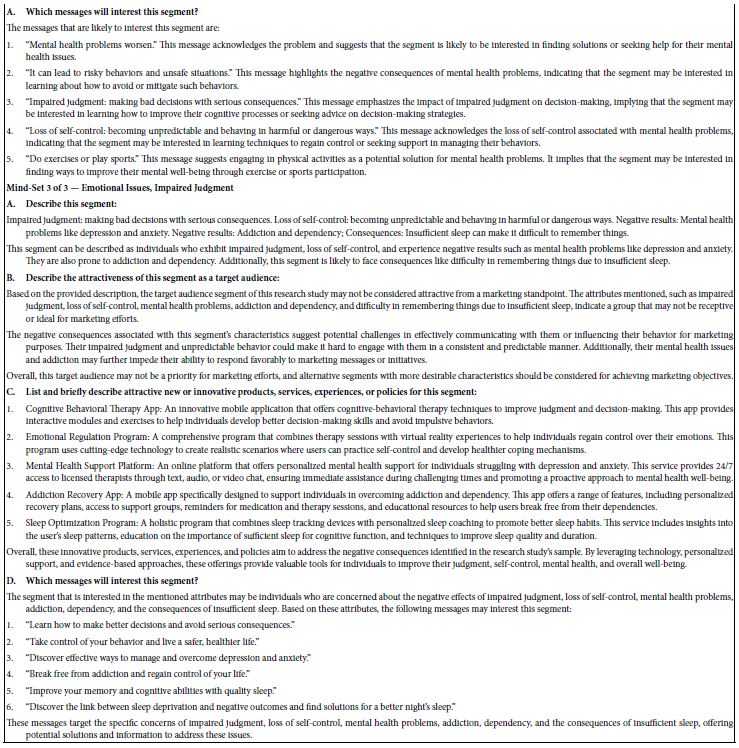
The last part of our analytics from the study itself is the interpretation of the findings through artificial intelligence. The automated re-analysis looks at the results from each mind-set, considering only those elements in the mind-set which generated a coefficient of 21 or higher. Through generative AI (ChatGPT 3.5) the AI answers a fixed set of questions as shown in Table 8. The results for each mind-set and to answer a variety of prompts. AI looks only at the strong performing elements, previously defined as elements which have coefficients of 21 or higher. Therefore, if a mind-set does not have any elements of 21 or higher, it does not appear in this AI analysis.
Table 8 shows the analysis. The prompts shown in Table 8 give a sense of some of the deeper information and insights that might emerge from the data. We might characterize the material in Table 8 as preliminary material for additional insights. Or, to take a phrase from the late Professor of Computer Science at Havard University, Anthony Gervin Oettinger, the material in Table 6 could be considered TACT, Technical Aids to Creative Thought [23].
Table 8: AI summarization and deeper analysis of the strong performing elements for each of the three mind-sets
Instructing AI to Provide a Simple Overview
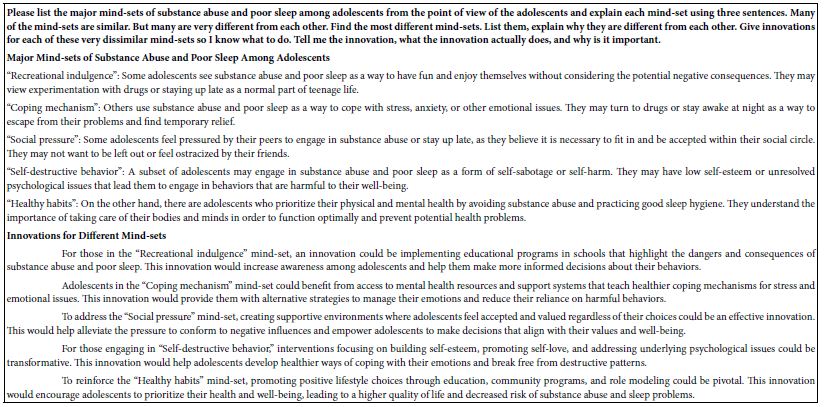
Final analysis is based on the need to simplify the results. We can take all of the information provided by AI detailed analysis in Table 8 and summarize it through one simple query as shown in Table 9. The artificial intelligence does a very good job of taking the material that it itself has generated and summarizing it. The bottom of Table 9 shows the summarization in terms of what the mind-sets are, in what aspects they differ, and what innovations can AI suggest. The important thing here is that we can have artificial intelligence summarize and summarize more. Here is a situation where less is more.
Table 9: AI summarization of the results previously presented in Table 8
Discussion and Conclusions
Mind Genomics studies offer a unique approach to understanding human behavior and decision-making, unlike traditional questionnaires. By presenting respondents with descriptions and scenarios, researchers can tap into their instinctual responses and emotions, providing a more accurate representation of their feelings about a topic or product. This method often involves experiments where participants are presented with varying descriptions or messages, making it difficult for them to guess the “right” answer. This allows researchers to capture genuine gut-level reactions, revealing hidden insights that may not be apparent through traditional questioning methods.
Mind Genomics studies offer a practical and efficient way to gather data, as they focus on individuals’ reactions to descriptions or messages, allowing researchers to quickly compile large databases of knowledge. Dividing people into groups based on their responses to different messages and descriptions allows for a deeper understanding of how individuals process information and make decisions. By identifying patterns in how different groups respond, researchers can tailor messaging and communication strategies to better reach and engage specific audiences.
The study presented here is an example of the effort put in versus the output emerging. The time to create the questionnaires can be measured in hours, certainly less than half a day. The time to set up the study itself and launch was another hour or two. The time to obtain the fully analyzed data was an hour or two, with the fully analyzed data emerging in the form of a user-friendly Excel file. Finally, the time to summarize the data a second time through AI was less than an hour. Altogether, the project could have been completed within 24 hours. The time to write the paper is, of course, longer, at least for the current iteration of Mind Genomics, but that time will “collapse” in future iterations.
Acknowledgment
The authors would like to thank Vanessa Marie B. Arcenas, Angela Louise C. Aton, and Isabelle Porat for helping to produce this manuscript.
References
- Johnson EO, Breslau N (2001) Sleep problems and substance use in Drug and Alcohol Dependence 64: 1-7. [crossref]
- Kwon M, Park E, Dickerson SS (2019) Adolescent substance use and its association to sleep disturbances: A systematic Sleep Health 5: 382-394. [crossref]
- Novacek J, Raskin R, Hogan R (1991) Why do adolescents use drugs? Age, sex, and user Journal of Youth and Adolescence 20: 475-492. [crossref]
- Brand S, Kirov R (2011) Sleep and its importance in adolescence and in common adolescent somatic and psychiatric conditions. International Journal of General Medicine 4: 425-442.
- Chattu VK, Manzar MD, Kumary S, Burman D, et al. (2019) The Global Problem of Insufficient Sleep and Its Serious Public Health Healthcare 7(1): 1.
- Roberts RE, Roberts CR, Chen IG (2001) Functioning of Adolescents With Symptoms of Disturbed Journal of Youth and Adolescence 30: 1-18.
- Becker SP, Langberg JM, Byars KC (2015) Advancing a Biopsychosocial and Contextual Model of Sleep in Adolescence: A Review and Introduction to the Special Journal of Youth and Adolescence 44: 239-270. [crossref]
- Dahl RE, Lewin DS (2002) Pathways to adolescent health sleep regulation and Journal of Adolescent Health 31: 175-184. [crossref]
- Kwan M, Bobko S, Faulkner G, Donnelly P, et al. (2014) Sport participation and alcohol and illicit drug use in adolescents and young adults: a systematic review and longitudinal studies. Addictive Behaviors 39: 497-506. [crossref]
- Bolanowski W (2005) Anxiety about professional future among young doctors. International Journal of Occupational Medicine & Enviornmental Health 18: 367-374. [crossref]
- O’Cathain A, Thomas KJ (2004) “Any other comments?” Open questions on questionnaires – a bane or a bonus to research? BMC Medical Research Methodology 4: 25. [crossref]
- Piccialli F, Di Somma V, Giampaolo F, Cuomo S, et al. (2021) A survey on deep learning in medicine: Why how and when? Information Fusion 66: 111-137.
- Gopal DP, Chetty U, O’Donnell P, Gajria C, et (2021) Implicit bias in healthcare: clinical practice, research and decision making. Future Healthcare Journal 8: 40-48.
- Choi BC, Pak AW (2005) A catalog of biases in Preventing Chronic Diseases 2: A13 [crossref]
- Siversten B, Skogen JC, Jakobsen R, Hysing M (2015) Sleep and use of alcohol and drug in A large population-based study of Norwegian adolescents aged 16 to 19 years. Drug and Alcohol Dependence 149: 180-186. [crossref]
- Krosnick JA. (2018) Questionnaire Design. In: Vanette D, Krosnick J, editors. The Palgrave Handbook of Survey Palgrave Macmillan, Cham. 439-455.
- Kahneman D (2001) A psychological point of view: Violations of rational rules as a diagnostic of mental Behavioral and Brain Sciences 23: 681-683.
- Moskowitz H, Kover A, Papajorgji P (2022) Applying Mind Genomics to Social IGI Global.
- Moskowitz HR, Wren J, Papajorgi P (2020) Mind genomics and the law. LAP LAMBERT Academic Publishing.
- Moskowitz H (2024) ‘Diabesity’ – Using Mind Genomics thinking coupled with AI to synthesize mind-sets and provide direction for changing American Journal of Medical and Clinical Research & Reviews 3: 1-13.
- Moskowitz HR, Rappaport S, Saharan S, Mulvey T (2024) Envisioning the World STEM Teaching Organisation: Combining AI with Mind Genomics to Map a Sustainable In: Thrassou A, Vrontis D, Efthymiou L, Weber Y, et al., editors. Non-Profit Organisations, Volume III. Springer Nature Switzerland. 151-175.
- Likas A, Vlassis N, Verbeek JJ (2003) The global k-means clustering Pattern Recognition 36: 451-461.
- Bossert WH, Oettinger AG (1973) The Integration of Course Content, Technology and Institutional Setting. A Three Year Report, 31 May 1973. Project TACT, Technological Aids to Creative Thought.