Abstract
Through the use of Mind Genomics coupled with AI (artificial intelligence), the researchers explored responses to an almost totally new topic, retail analytics, specifically what might be the applications in the business environment. AI generated four questions about the use of retail analytics, and subsequently four answers (elements) to each question. These AI-generated answers were combined into unique sets of 24 vignettes, one set for each of 50 respondents. The ratings of the respondents in terms of ‘interests me’ were then deconstructed into the contribution of each element to the rating. The deconstruction by regression analysis was done for total panel, for two viewpoints about what a company would do with the data (better prices; better service), and three mind-sets or ways of thinking about the topic (MS1 – Focus on price/profitability; MS2 – Focus on innovation/operations; MS3 – Focus on outside world behavior, MS 3). The paper concludes with AI analysis and summarization of the strong performing elements for each identified group, using the same six queries for summarization. The paper demonstrates the potential for rapid, insightful learning for new topics, a learning promoted by AI and by human ‘validation’ of the ideas generated.
Introduction
This paper presents an exploration into what might be considered a specialized topic, subjective responses to retail analytics.
“Retail analytics involves using software to collect and analyze data from physical, online, and catalog outlets to provide retailers with insights into customer behavior and shopping trends. It can also be used to inform and improve decisions about pricing, inventory, marketing, merchandising, and store operations by applying predictive algorithms.” [1]
As this definition shows, retail analytics involves extensive data collection, complex analysis and presentation so that executives can make decisions for the benefit of their retail operations. For the analytics, there is the analyzed. Today’s marketing savvy consumers know that data is collected from them, and they expect the data to be used for their benefit, viz. personalized services and an improved shopping experience [2]. It’s an implicit contract.
For years now, retailers and most brands, promote their goal to be “consumer-centric,” i.e., putting the consumer at the center of everything a retailer or brand does, in effect placing the consumer in the driver’s seat, a position allowing them to tell brands how to shape brand experiences for them. Oddly, when it comes to retail analytics, the conversations are about executives interpreting consumer data – sales, trends, satisfaction levels to name three, but we could not find examples where the views of consumers about the use of – and how to use – retail analytics, which is derived from their data, to improve their shopping experiences. This gap provided the novel opportunity to contribute new knowledge by turning the research of subjective responses to retail analytics on its head – to explicate the bottom-up perspectives of consumers to executives, leaders who may then become even more consumer-centric in ways that benefit their operations and improve their customers’ experiences.
Our modern age continues to grow in technological capabilities, empowered as it is by the computer, by the Internet, by the so-called Internet of Things, and by the hyperfocus on optimizing in real time. One can scarcely go through a day without being exposed to ceaseless streams of advertisements and calls to take a buying action. Often, the advertisements are for items already purchased, for items recently viewed or for items abandoned in an e-commerce shopping cart, such advertisements and calls to act emerging from rapid, micro-second analysis of people’s shopping behaviors. Indeed, the analytic capabilities are so strong that the previous fad for gaining substantial insight, big data, looks almost antiquated in terms of the ability to deal with small, immediate, personalized data, generated nonstop.
It is no wonder that the world is awash in data. Our ability to formulate scientific questions, to track trends, to subject this rapid life to the slow majesty of scientific inquiry seems to vanish as the speeds and volumes of data feeds increase to an accelerating beat. It is difficult, indeed, to, ‘think slowly’ while in in the throes of massive data, massive opportunities to optimize.
We are accustomed to the slow, majestic, ingrained, now entrenched system of hypothetico-deductive reasoning [3]. The basic idea is that science, or perhaps even people personally, ‘advance’ by forming a hypothesis about something, and rigorously testing that hypothesis, attempting to falsify Whatever is not falsified begins to have the ring of truth to it. At the same time as technology is speeding up data production and acquisition, there is a need to speed up knowledge acquisition and thinking. It may require exceptional innovation to create knowledge in the hard sciences, such as biology and chemistry, but to create valuable knowledge in the softer human-centered sciences may be less of a problem. Indeed, with the advances already made in computers some of the paradigm changes may be within today’s grasp.
Mind Genomics, the Promise of AI, and a Vision of the Future
The study is part of the new effort in Mind Genomics to accelerate the acquisition of knowledge and insight for the world of the everyday, and for topics involving human feelings about situations and activities that we often overlook because of their sheer invisibility, such as our present topic of subjective feelings towards retail analytics. There is another motivation as well, the desire to demonstrate through an ongoing research program, whether the combination of artificial intelligence with systematized testing among humans can reveal new aspects of daily life, and even point to weak signals of attitudes which are evolving.
The underlying science, Mind Genomics, is an emerging discipline with rooms in a number of areas, including experimental psychology to search for causation of behavior, statistics which allow researchers to work with combinations of independent variables in the way which often occurs in nature, and finally consumer research which looks at how people make decisions about the world of the ‘ordinary’, the quotidian reality in which people actually live, function, thrive or fail.
The history of how Mind Genomics emerged or better ‘evolved’ has been told before, in detail. The story is simple, involving the basic question of how people respond when asked to evaluate a compound stimulus comprising a variety of features. The question is simple, and even the thinking is rudimentary. The sole focus is simply to see ‘what happens.’ The effort is simply to find patterns in nature. There is no effort to create a theory, to prove or disprove a theory, although those noble efforts can certainly occur. The worldview underneath searching for patterns in nature come from psychophysics, the branch of experimental psychology, which searches for regularities in nature, such as the perceived sweetness of different concentration of sucrose in a water solution [4], or perhaps more of interest to industrial concerns, the perceived sweetness of different combinations and concentrations of artificial, high-potency sweeteners, in beverages. The effort is to discover relations in nature, regularities. The mass of such discoveries, especially in a defined and coherent field, becomes technological know-how and even the basis of science.
The project itself was run on an accelerated timetable, the total involvement being less than three hours, although spread over two periods, the first being the set up and empirical experiment, the second being the automated analysis using artificial intelligence. These two together constituted the period of less than three hours. The writing of the paper took considerably longer, but plans are underway to make the writing as quick as the design and the field research. In that way the Mind Genomics approach can be a living instantiation of what studies are, namely decision making in real time in the real world of the everyday. It is worth noting that the first use of AI in Mind Genomics goes back four years, with the process being long because it was a handcrafted combination of AI and Mind Genomics [5].
Part 1 – The Creation of the Study, and the Execution with Respondents
Mind Genomics studies are now scripted, following a templated procedure which reduces both the effort to acquire data as well as the ‘angst’ involved in doing an experiment. A half-century of experience by author Moskowitz in the world of science has continued to reveal that anxiety reported by individuals who are not scientists in their daily lives but are asked to ‘do science’ for a specific objective.
The scripting for Mind Genomics is set up to ensure that the researcher can provide the necessary information, in the proper format. The actual experiment involves combining relevant ‘messages’ about a topic (called ‘elements’) into small, easy to read ‘vignettes’, a vignette comprising 2-4 such messages. The combinations are then evaluated by people, using a rating scale. The respondents each end up evaluating 24 different vignettes, the vignettes for one respondent different from the vignettes for another respondent, but the set of elements being the same. Each respondent rates a unique set of 24 vignettes [6].
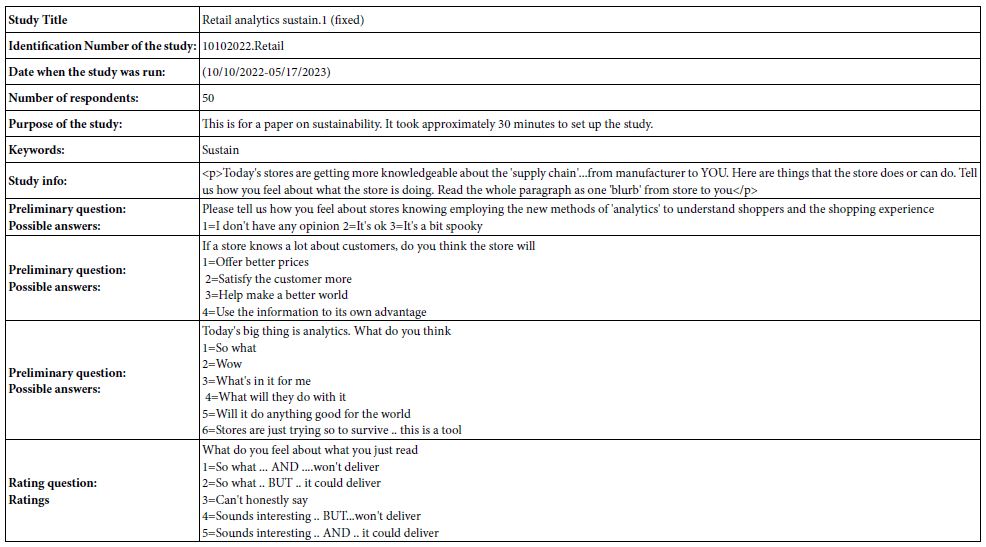
Mind Genomics studies are now scripted so that the studies can be set up on either a computer or a smartphone, run, and results downloaded with a short period of time. Table 1 provides key information about the study, information that will be explicated. The text in Table 1 comes directly from the report, contained in an Excel workbook, which can be downloaded either immediately for partial analysis (without the artificial intelligence summarizer), or after 30 minutes for complete analysis (with the artificial intelligence summarizer).
Table 1: Key information about the study provided by the Excel report.
The set-up begins with the naming of the study, and then the instruction to provide four questions germane to the study topic. The researcher is prompted to structure the four questions so that they ‘tell a story.’ During more than a decade, from the time that Mind Genomics was opened to the public as a ‘software as a service,’ there has been increasing number of situations where researchers seemed to have been overwhelmed by the task of creating elements. With the advent of artificial intelligence, such as Chat GPT, it has become easy to use AI to create questions. All the researcher has to do is write down a short paragraph in the Idea Coach ‘box’ in the Mind Genomics template, and the AI returns with 30 different questions.
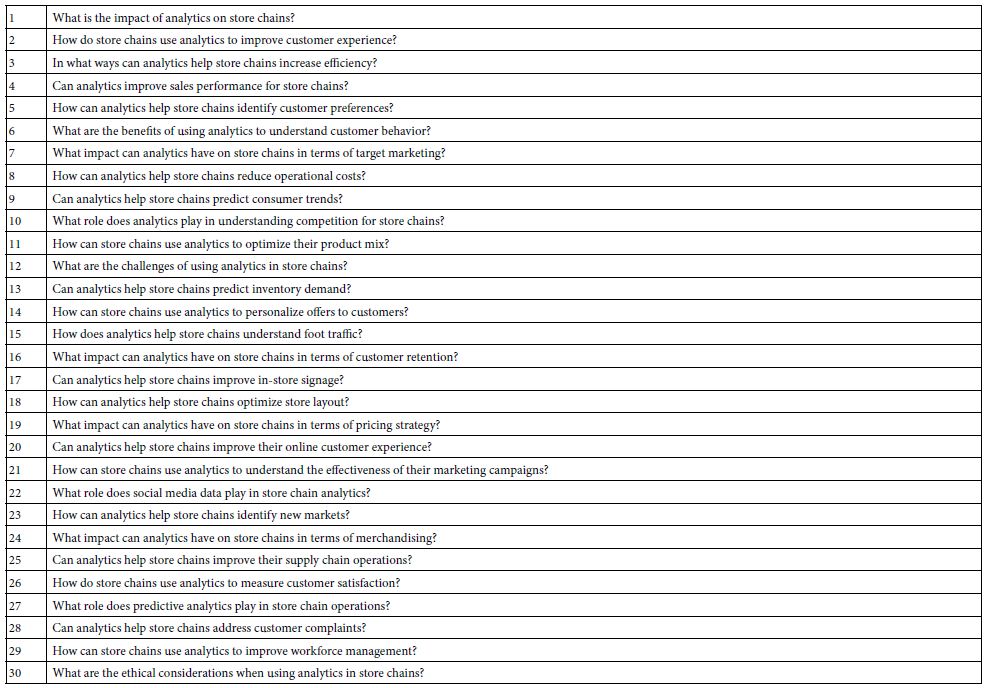
Figure 1 shows the request for four questions (left panel), and the four questions provided by the researcher (right panel). Table 2 shows one run of the Idea Coach, returning with the 30 questions after the AI has been prompted by a short description of the project. The actual time for this first step with the Idea Coach is approximately one 60-90 seconds after the researcher provides the Idea Coach with the small description. The researcher can select 0-4 questions. The questions selected are automatically put into the template. The researcher can then repeat the action to get other answers. The actions are independent of each other, so that each use of the Idea Coach to provide questions is independent of the previous use. In this way a person new to the topic can learn a great deal about the topic, even without selecting questions. It is the sheer number of different questions presented in a short period of time which constitutes an ‘education’ for the researcher on the very topic being studied. It is for that reason that the approach is considered ‘Socratic.’
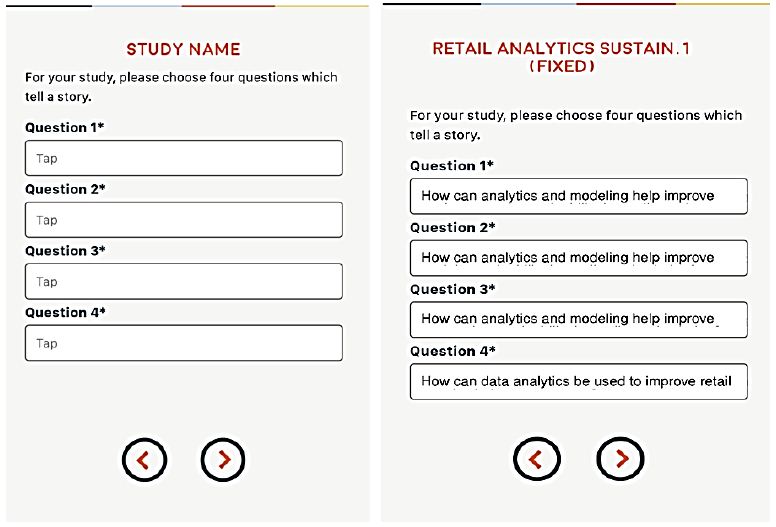
Figure 1: The templated request for four questions (left panel), and the four questions provided by the Idea Coach (right panel).
Table 2: The 30 questions returned by Idea Coach after being prompted by a small paragraph about the purpose of the study.
The next step consists of providing four answers to each question. Once again the Idea Coach comes into play. This time the information provided to Idea Coach is in the form of a query, that query created directly from the text of the specific question. When the researcher wants to change the query, it becomes a simple task of editing the question.
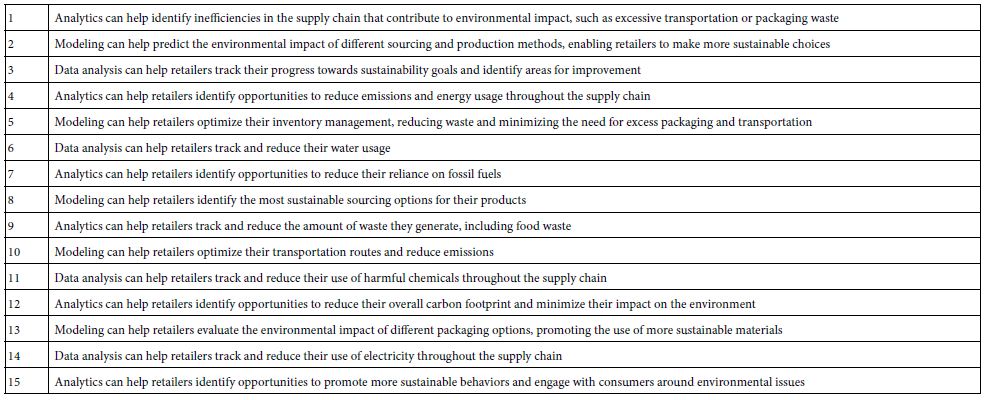
Figure 2 shows the formatted screen for Idea Coach, with the left panel showing the request for four answers, and the panel showing the completed set of answers used in the study. Table 3, in turn, shows 15 answers generated from one run of the Idea Coach, with the first question. The time elapsed in about 30 seconds.
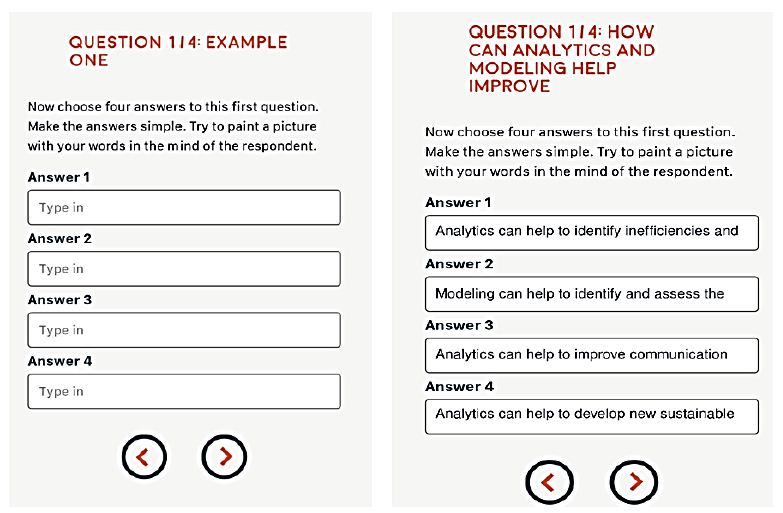
Figure 2: The templated request for four answers for question #1 (left panel), and the four questions provided by the Idea Coach (right panel).
Table 3: The 15 answers returned by Idea Coach after being prompted by Question #1.
Once the study has been launched with the appropriate respondents, done easily within the BimiLeap program, the researcher selects the source of respondents, using the screen shown in Figure 3.
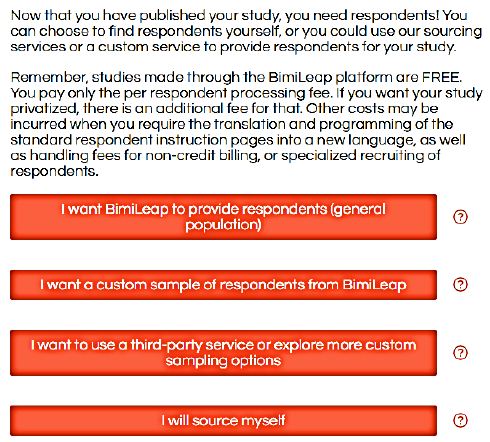
Figure 3: Source of respondents, selected by the researcher as the last part of the project set-up.
The respondent is ‘sourced’ from a panel provider specializing in on-line surveys. Across the world there are many such panel providers. These providers have lists of respondents and qualifications, individuals who have agreed to participate in similar studies for a reward provided by the supplier. The researcher need not know the agreement. All that is necessary is for the panel provider to source the correct respondent.
The Mind Genomics study can have elements (questions and answers) from different languages, and different alphabets, although the instructions for the actual set-up as done by the research are currently available in just a few languages (e.g., English, Chinese, Arabic Hebrew.
The actual experiment with the participant lasted approximately 3-5 minutes. The experiment begins with a short orientation provided by the researcher, obtains responses to the self-profiling questions (including age and gender, not shown here), and then presents the respondent with the 24 different, systematically designed vignettes. The vignettes comprise 2-4 answers (elements), at most one answer from a question, but often no answers from a question.
The experimental design ensures that the ratings from each respondent can be analyzed separately, as well as being able to be analyzed as part of the group. The vignettes are set up so that each individual evaluates a unique set of 24 vignettes, a design structure which enables the researcher to explore many different aspects of an issue, without having to choose what combination of elements give the best chance of discovery.
It is important at this juncture to keep in mind that the effort is more in the world of ‘hypothesis-generating’ than in the world of ‘hypothesis-testing.’ Quite often researchers really have no hypotheses to test but are constrained to do the study as if it were guided by a hypothesis. Mind Genomics disposes with that, freely representing that it is a discovery tool, to identify patterns which may be of interest in the way people think about a topic. The respondent sees an introduction to the study, usually presented in shortened form so that the specific information must come from the elements selected by the researcher. Figure 4 (top panel) shows the orientation question. Figure 4 (bottom panel) shows the five-point scale used by the researcher. Some of the text is cut off from the scale description. Figure 5 (top panel) shows the additional self-profiling questions as these appear to the respondent at the start of the evaluation by the respondent. Figure 5 (bottom panel) shows a clear reproduction of a vignette, as prescribed by an underlying experimental design. To the respondent there is no ’underlying pattern’ to be discovered. Rather, the vignette itself looks like it was randomly assembled, in virtually a haphazard manner.
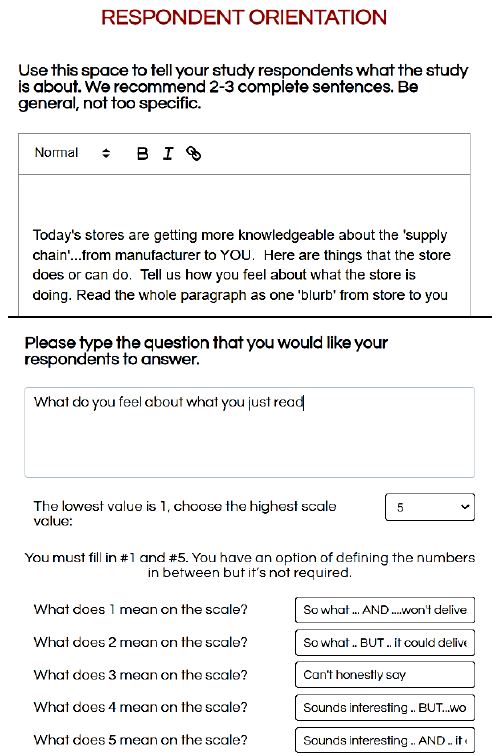
Figure 4: Respondent orientation screen in set-up program (top panel), and rating scale specifics in set up program (bottom panel).
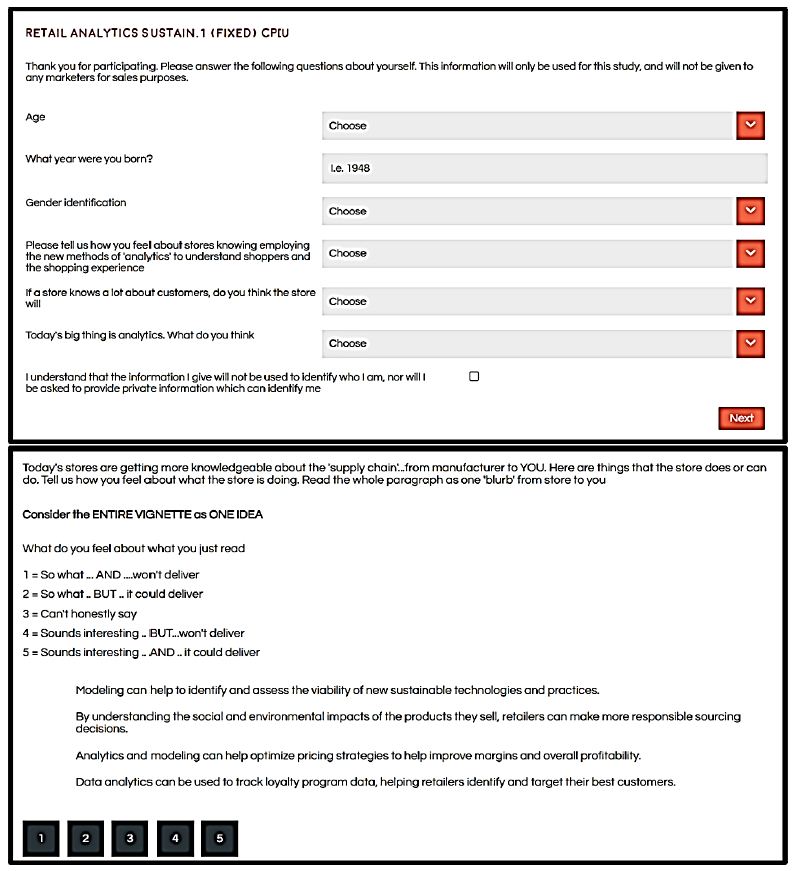
Figure 5: Screen shot for the pull-down menu of self-describing questions (top pane), and example of a four-element vignette plus rating question/scale as the respondent would see it on a full screen (bottom panel).
Database Structure, Analysis, and Reports – Total Panel
Almost fifty years ago, it was possible to accelerate the acquisition of data and even the preliminary analysis of such data. One could gather data quickly, and using mark sense cards and later electronic input one could analyze the data by programs then available, usually programs which specialized in descriptive analysis. The objective for this exercise is to move dramatically beyond that simple original analysis, pushing the limits by making use of smart experimental design, clustering, and applied artificial intelligence using GPT.
The actual data analysis is straightforward, made so by the judicious use of the experimental design, pre-selected so that the different sets of 24 combinations are really isomorphs of each other. Although the actual combinations, the vignettes, all differ from each other, mathematically the structure of each set of 24 vignettes is the same. In this way the researcher is assured of having a powerful analytic tool, which explores a great deal of the ‘design space’ (the possible combinations). Clearly, more individuals, more respondents means more of the design space is covered.
The analysis is made possible by the creation of a simple to use database. Each row of the database corresponds to one of the 24 vignettes tested by a respondent. Thus, for this study, comprising as it does the responses of 50 individuals, the database contains 50×24 or 1200 rows of data. The columns themselves are divided not bookkeeping columns (row number, study name, respondent number, test order number for the respondent, via 1-24), then 16 columns devoted to showing absence of element (value 0) or presence of element (value 1), and finally, the rating assigned, and the response time. Response time is defined as the number of seconds from the appearance of the vignette to the actual response assigned.
After the data are collected, the program creates new variables, specifically a binary variable TOP (ratings 5 and 4 transformed to 100; ratings 3, 2 and 1 transformed to 0), and a second binary variable BOT (ratings 1 and 2 transformed to 100, ratings 3, 4 and 5 transformed to 0). The BimiLeap program adds a vanishingly small random number (<10-4) to each BOT and TOP value, in order to ensure variation in the values of TOP and BOT. This prophylactic action ensures that there will be the necessary variability even when the respondent rated all vignettes either 1 or 2, or 3, 4 or 5,.
The first analysis generates an equation relating the presence/absence of the 16 elements to the newly created dependent variable TOP. Table 4 shows the parameters of the equation, expressed as: TOP = k0 + k1(A1) + k2(A2) … k16(D4). . The use of an experimental design, permuted across the 50 respondents to create 1200 vignettes, ensures that the OLS regression will not encounter any problems in terms of variables correlated with each other. The coefficients have absolute value, viz., a 5 is half the value of a 10. This is important. Often it is only differences in coefficient values which are relevant, e.g., when the experimental design calls for each vignette to have exactly one element from each question. That ‘tempting’ requirement substantially weakens the results.
Table 4: Elements for the Total Panel which drive TOP (Sounds interesting).
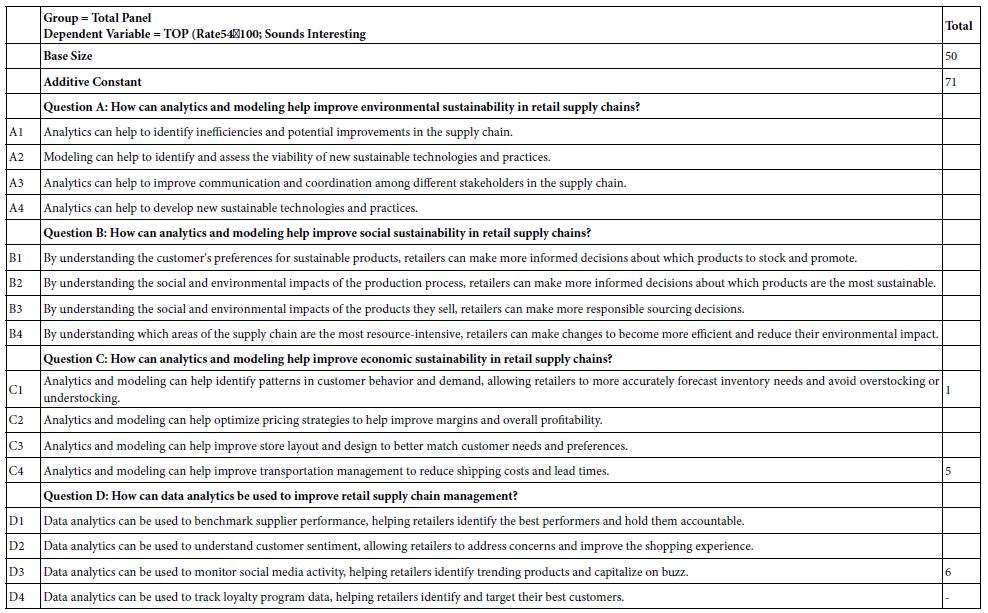
With the recognition of these properties of the regression results, the researcher can quickly understand the dynamics revealed in the experiment. The results are immediate and obvious once the meaning of the coefficients is understood. The coefficients tell us the proportion of times a response to the vignette will be 5 or 4 (here … ‘sounds interesting’) when the element is put into the vignette.
Note: Other binary dependent variables can be created
BOT = rating 1,2 transformed to 100. ‘Does not sound interesting’
RATE52 = rating 5,2 transformed to 100. ‘Could deliver’
RATE 41 = rating 4, 1 transformed to 100. ‘Won’t deliver’
Table 4 shows us 17 numbers, the additive constant and 16 coefficients. Mind Genomics studies generate a large number of coefficients. We are not interested in the coefficients which are 0 or lower. These low coefficients say that the presence of the element in the vignette ‘does not add’. It does not mean that the element actually detracts, or perhaps just as likely, the element is irrelevant, leading to a rating of 3.
The additive constant tells us the proclivity of the respondents to say ‘sounds interesting’ in the absence of any elements in the vignette. By underlying design, the vignettes all comprise a minimum of two elements and a maximum of four elements. Therefore, the additive constant is simply a correction factor in statistics. ON the other hand, we can use it as a baseline, a proclivity for the respondent to say, ‘sounds interesting’. We will use it to gain that insight. Table 4 shows the additive constant to be 70, meaning that when it comes to knowing that the topic will be store analytics, 70% of the respondents will be strongly positive. Had we done this type of experiment across years ago we could have measured the change in this additive constant to get a sense of how new ideas are accepted.
Only three of the 16 elements generate coefficients of 1 or above. The remaining generate coefficients of 0 or negative. For the sake of clarity, and for the sake of allowing patterns to come through, we do not show any 0 or negative coefficients. If we discard the element with coefficient 1, quite close to 0, we are left with the finding that of our 16 best guesses using artificial intelligence, edited by a human researcher, we end up with only two strong performing elements, and indeed only modest performers at that.
Shown these results and presented with the Mind Genomics approach for the first time, the critic of artificial intelligence might aver, perhaps even strongly aver, that these results contradict the claims of AI proponents that AI can be as good or better than people. The reality is not as positive, however. When a person selects the elements alone, quite often the person does about as poorly, or perhaps slightly better.
C4: Analytics and modeling can help improve transportation management to reduce shipping costs and lead times.
D3: Data analytics can be used to monitor social media activity, helping retailers identify trending products and capitalize on buzz.
Before moving on to an analysis of subgroups and mind-sets, it is instructive to see what AI can provide in terms of a standardized interpretation of the results. The analysis by AI should be considered simply as tentative observations made by a heuristic. It will still take a person to go through the data, but in the interests of speed, one might employ the AI heuristic to get a sense of the answers before spending time with the results.
Table 5 shows the response of AI to six queries. These queries are listed below.
- Interested in
- Create a label for this segment
- Describe this segment
- Describe the attractiveness of this segment as a target audience:
- Explain why this segment might not be attractive as a target audience:
- Which messages will interest this segment?
Table 5: AI first scan and interpretation of the strong performing elements (6 and higher) for the Total Panel, on six queries.
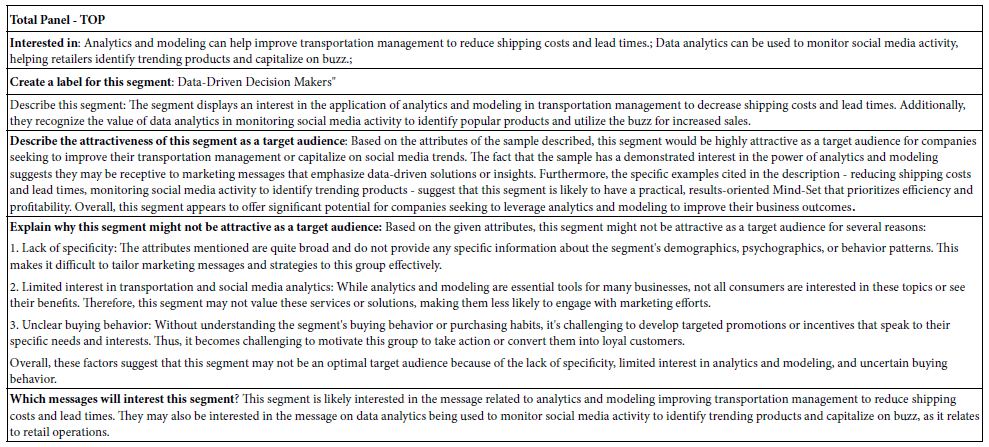
The queries look only at the moderate and higher elements, viz., those with coefficients of +5 or higher. Elements with coefficients of 4 or lower are ignored. For our data in Table 4 using the Total Panel the AI uses only two of the 16 elements to write its analysis.
Results from Self-profiling Questionnaire – What will the Store Do with the New Analytics
Our second analysis parallels the first, this time focusing on how the respondent feels about what the store will do with the analytic information. The actual question and answers appear below. Out of four possible answers, most of the respondents (43 of 50) chose only two, better price and better service, respectively.
If a store knows a lot about customers, do you think the store will
1=Offer better prices
2=Satisfy the customer more
3=Help make a better world
4=Use the information to its own advantage
Two groups or segments emerge, those who feel that the store will offer better prices using the analytics data (15 of 50), and those who feel that the store with use the information to better satisfy customers (29 of 50). Both have similar additive constants (63 and 69) but respondent in radically different ways to the elements.
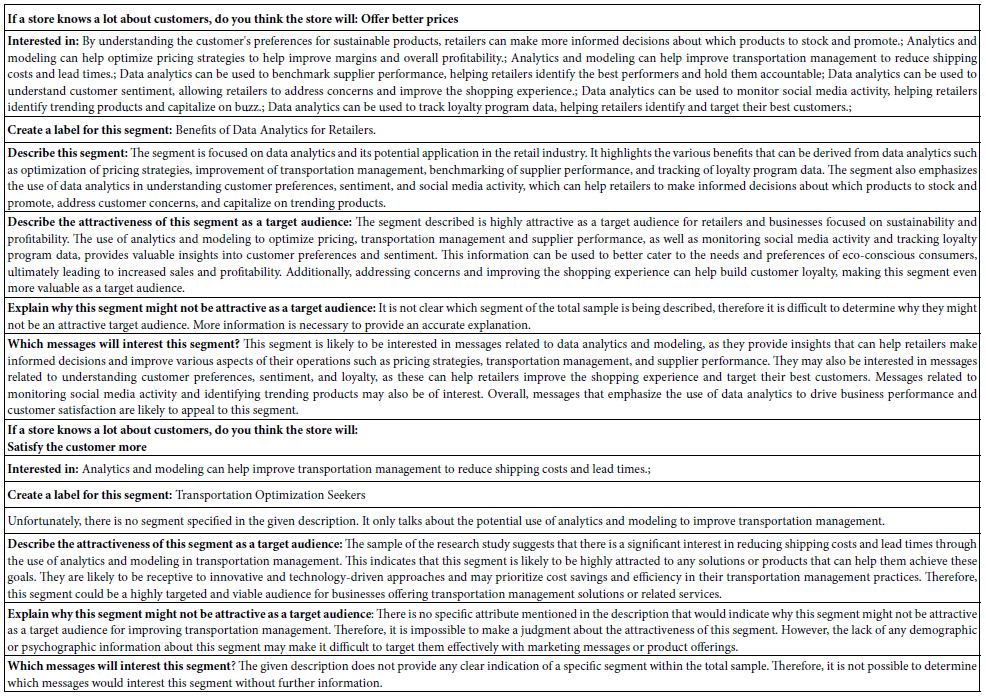
The data for this new analysis comparing different points of view on what will the store do with the analytics appear in Table 6 for the coefficients, and Table 7for the AI summarization. Once again all coefficients of 1 or lower are not shown. In the interests of simplicity, all elements without at least one coefficient of ‘2’ Table 6 suggests that the response of those in Segment 1 (believe the store will offer better prices) are strong and focused, whereas there are no strong performing elements for Segment 2 (believe that the operations will be better) (Table 7).
Table 6: Elements which drive TOP (Sounds interesting) for the two segments emerging from the question self-profiling question: If a store knows a lot about customers, do you think the store will…
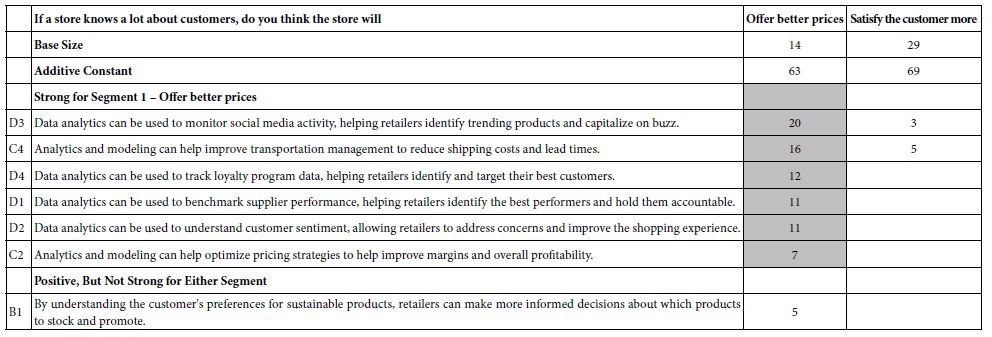
Table 7: First scan and interpretation of the strong performing elements (6 and higher) by for the two segments, based on the self-profiling question of what the store will do with the results from the data analytic.
Results from Dividing Respondents into Mind-Sets Based Upon the Pattern of Coefficients
Our final data analysis will focus on the creation of mind-sets, groups of respondents who are put together by the k-means clustering program [7], based upon the similarity of the patterns made by their coefficients. For the clustering we use all 16 coefficients, whether positive or negative, although we only show the positive coefficients in the results. Clustering does not use the additive constant.
The clustering program is embedded in the BimiLeap program, generating at first two mind-sets, and then totally once again, three mind-sets. Each respondent is assigned to only one of the two or three mind-sets. Furthermore, the mind-sets encompass all respondents.
The objective of the clustering exercise is to discover hitherto unexpected groups of respondents based upon the patterns of their coefficients from thousands of small studies clustering based on coefficients emerges with meaningful, interpretable groups of respondents, even though the process is purely mechanical and mathematical.
Table 8 shows the positive performing elements for the three-mind-solution. The two-mind-solution is not shown in the interest of space. Table 9 once again shows the AI interpretation of the results, obtained by applying six queries to each of the three mind-sets.
Table 8: Elements which drive TOP (Sounds interesting) for the three mind-sets, emerging from k-means clustering of all the element coefficients from the 50 respondents. Only those elements with at least one coefficient of 2 or higher are shown.
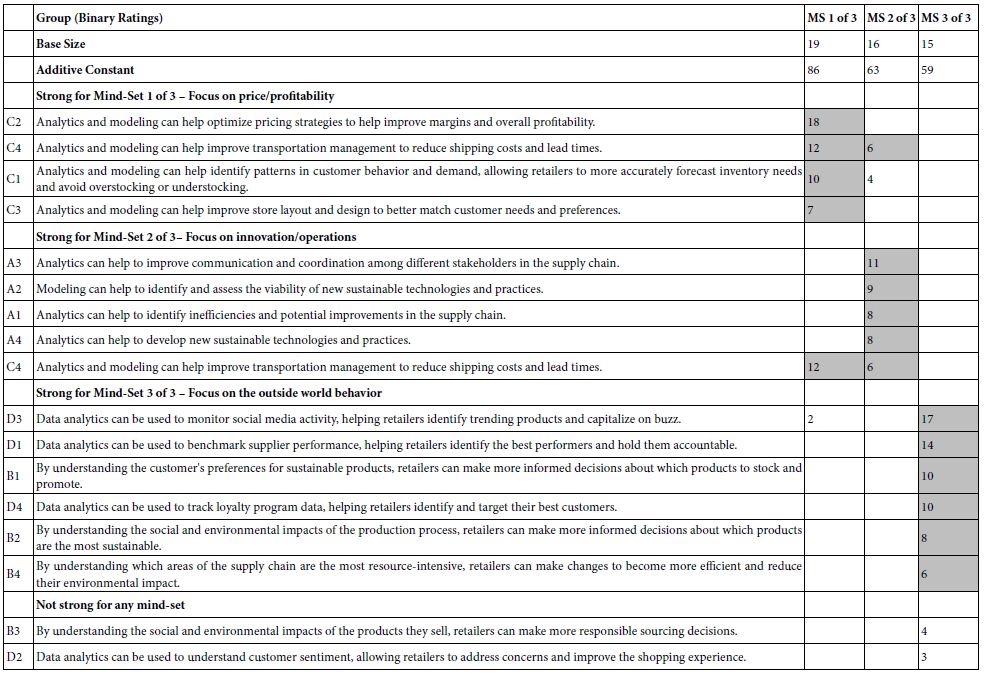
Table 9: AI interpretation of the strong performing elements (6 and higher) by AI for the three-mind-set solution.
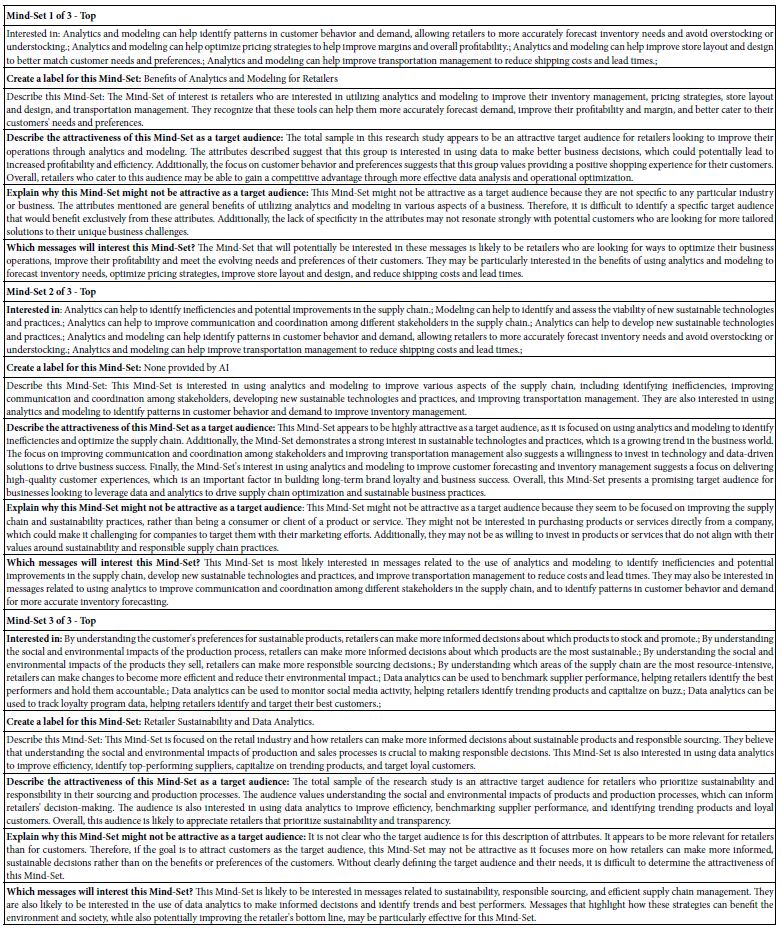
In contrast to the data from the Total Panel, and the data from the Self-Defined Segments regarding what the company will do with the segments, the division by the pattern of coefficients shows strong performing coefficients, and meaningful stories which repeat from the two-mind-set solution (data not shown in the interest of space.).
Beyond Interpretation to Understanding Performance at a Glance
A continuing issue emerging from these small-scale studies is ‘How did we do?’ The same question is asked by researchers in most areas, with the underlying issue touching on ‘did the experiment work?’ With Mind Genomics coupled with AI at the very early stages, and available world-wide at the press of a key, the issue becomes the degree to which the study generated anything of value. The notion of ‘value’ is not the personal value of the data to the researcher, nor value in terms of scientific reproducibility and validity, but rather did the effort lead to any strong performing elements. We learn that when we have strong performing elements there is a strong link between an element and the rating question. That linkage is what the researcher seeks in these studies. Knowing that some elements get high scores and other elements get low scores tells the researcher she or he can move in the direction of the high scoring elements. It is in those elements that the relevant issue can be further understood, at least in the minds of the people who are the respondents.
As part of the effort to ‘systematize’ the use of Mind Genomics in this era of easy-to-use techniques empowered by AI, we present the IDT, Index of Divergent Thought.
The objective of IDT is to measure the impact of the elements. The IDT generates a simple index, shown in Table 10. Each positive element is weighted by the relative number of respondents when we consider the entire study as six groups (Total, Mind-Sets 1 and 2 in the 2-Mind-Set solution, and Mind-Sets 1, 2 and 3 in the 3-Mind-Set Solution). Each of the six groups has a specific number of respondents, which add up to 3x the base size, or 3×50, viz. 150. The IDT is simply the weighted sum of the positive coefficients, the weight being the ratio of the number of respondents in a group versus the total number of 150. Note that the two-mind-set solution was developed, but not shown in the interest of space.
Table 10: The IDT, Index of Diverged Thought, showing the performance of the elements, and thus the strength of the thinking behind the specific Mind Genomics study.
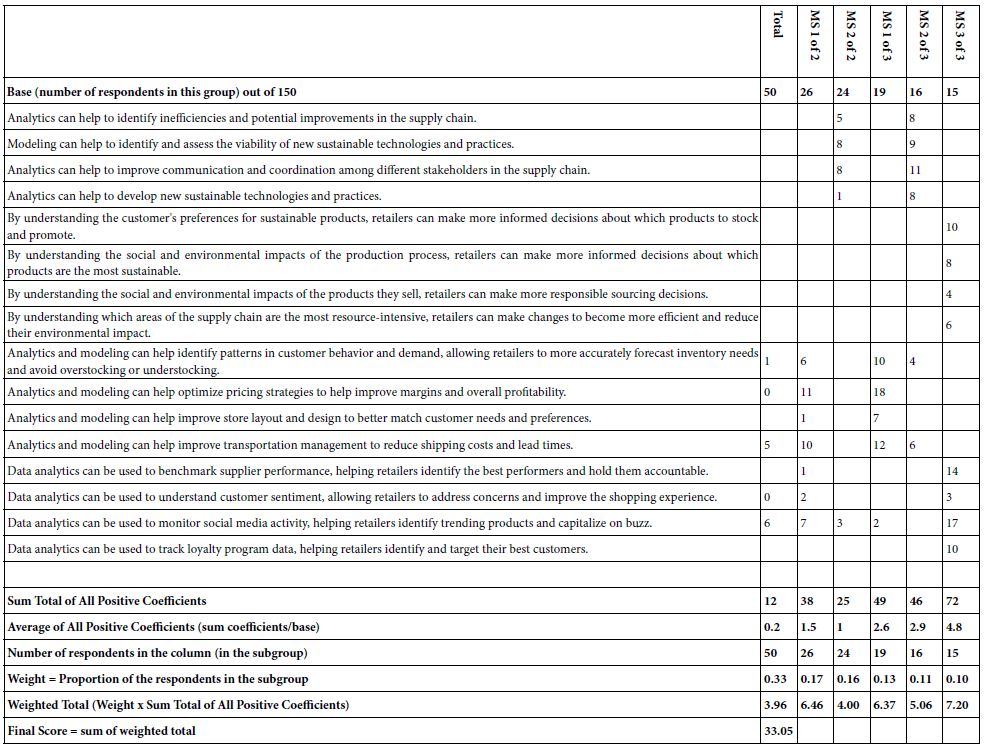
The ideal use of the IDT at these early days of implementation is to determine how good was the choice of elements. The IDT for this study is 33.05, on the low side. Keeping in mind that the elements were obtained from AI, and only modestly edited, we have with the IDT a way to quantify the strength of the ideas as they are perceived by people.
Discussion and Conclusions
As emphasized above, this study was undertaken as a study of an experience, the experience being the efforts to learn about a topic new to the senior author, viz., sustainability in the world of retail analytics. The original idea for this study came from a call for papers from the newly founded journal ‘Sustainability.’ The fact that the senior author had little experience with the topic of retail analytics, and indeed scarcely, if ever, thought about the topic, made the study more interesting. As a senior scientist, with 54 years of experience after the PhD., the topic was interesting simply because it asked the question ‘what really could be learned by and contributed by a novice, albeit a novice with professional experience.’
In fact, we learned that our respondents, who are also consumers, can easily grasp the features and uses of retail analytics, and that they reveal three distinct Mind-sets towards retail analytics. Mind-set 1: Focus on price/profitability; Mind-set 2: Focus on innovation/operations; and Mind-set 3: Focus on the outside world behavior. Each of these newly discovered mind-sets educates retail executives with knowledge never known to them before, guidance from consumers about how they might leverage retail analytics for their customers’ benefit and, perhaps, unleashing innovation benefitting both the shopper and the retailer. They can break from past tradition of analyzing from on high what they think is best for their shoppers.
The actual study was easy to implement. The use of the Idea Coach made things easier, although it was not clear to whether these were the ‘right questions’ to ask. The answers were not the issue. Rather, it was the questions, leading to the realization that emphasis is research should be put on asking an appropriate, meaningful question. So many of the AI generated questions seemed real until thought through, with the question of ‘what type of answer would this question engender’
The actual process itself revealed some unexpected benefits. The key benefit might be said to be ‘sharpening’ and improving the question, until one reaches a powerful question. The reality of this single powerful question is important. We are not taught important, seminal questions to ask. And all too often, when these questions are asked, their importance is often unrecognized.
To sum up, this paper demonstrates the increasing ease with which a novice can use computer technology to learn by exploration. The templated version of Mind Genomics makes it possible for the novice to move quickly from issue to empirical results. At the front-end AI provides a Socratic way of creating questions, that create an education on the topic. At the back end, the AI allows the researcher to understand the results from a variety of perspectives, provided by the different queries.
If we were to surmise the potential of the approach, we might find its greatest use in the world of education, to teach [8]. Teaching may not be limited to students, but rather ‘teaching’ here is used in the general sense, to instruct a person about a specific topic [9,10]. The unique combination of AI at the front and back, coupled with real human responses, provides a powerful tool to explore many dimensions of being, from the simplest to the profound, rapidly, iteratively, and with the potential of opening entirely new disciplines as the information from related studies is aggregated into a coherent whole with many different facets.
References
- Oracle Corporation (2023) “What Is Retail Analytics? The Ultimate Guide.”
- Kinsey MC & Co. (2021) “The value of getting personalization right—or wrong—is multiplying.”
- Sprenger J (2011) Hypothetico‐deductive confirmation. Philosophy Compass, 6: 497-508.
- Moskowitz HR (1971) The sweetness and pleasantness of sugars. The American Journal of Psychology, 84: 387-405.
- Zemel R, Choudhuri SG, Gere A, Upreti H, Deitel Y, et al. (2019) Mind, Consumers, and Dairy: Applying Artificial Intelligence, Mind Genomics, and Predictive Viewpoint Typing. In Current Issues and Challenges in the Dairy Industry. Intech Open.
- Gofman A, Moskowitz H (2010) Isomorphic permuted experimental designs and their application in conjoint analysis. Journal of Sensory Studies 25: 127-145.
- Likas A, Vlassis N, Verbeek JJ (2003) The global k-means clustering algorithm. Pattern Recognition 36: 451-461.
- Clancey WJ, Hoffman RR (2021) Methods and standards for research on explainable artificial intelligence: lessons from intelligent tutoring systems. Applied AI Letters 2:53.
- Kim TW, Mejia S (2019) From artificial intelligence to artificial wisdom: what Socrates teaches us. Computer 52: 70-74.
- Lara F, Deckers J (2020) Artificial intelligence as a socratic assistant for moral enhancement. Neuroethics 13: 275-287.