Abstract
The document shows strong isotope fractionation between 13C and 12C of diamonds transported and formed by supercritical fluids related to Variscan mineralizations in Germany and the Czech Republic at a crustal level. Furthermore, we give evidence that the formation of diamonds at low pressure and temperature at a crustal level is also possible. Beyond that, diamonds can form at the interface of metals and graphite crucibles by catalytic activation of methane at low pressure. On an exotic example, the growth of diamond during the Stockbarger growth of fluorite, we show that the range of diamond formation is vast in pressure and temperature.
Keywords
13C-rich diamond, Supercritical fluid, Strong isotope fractionation, Variscan mineralization, Extensive range of diamond formation
Introduction
According to Cartigny (2005) [1], the abundance for 12C is about 98.9%, and for 13C, 1.1% in natural diamonds formed in Earth’s mantle. Therefore, the ratios of both isotopes are expressed in parts per thousand relative to an internationally accepted standard. However, the finding of very high 13C values in natural diamonds is a novum and needs an acceptable interpretation (e.g., Thomas, 2025). The low 13C concentration of diamonds is more or less the same for the principal diamond types: peridotitic or P-type and eclogitic or E-type. That is also true for the strange diamonds carbonado and framesite [2]. Traditionally, the formation of diamonds is associated with extremely high pressures and temperatures deep in the Earth’s crust or upper mantle. However, in the last years, this canonical view has been challenged by recent data and interpretations that suggest metastable growth of diamonds in low-pressure environments [3]. Diamonds were found in various regions of the world embedded in geological structures that do not exhibit the typical conditions for diamond formation. For example, in recent years, diamonds have been discovered in the Brazilian state of Bahia in rock layers that have experienced only low pressure and moderate temperatures. These diamonds demonstrate that the rock environment can play a crucial role in stabilizing the diamond structure, even in the absence of the usual extreme conditions regarding pressure and temperature. Thomas et al. (2023a) [4] have shown that diamonds can transported fast via supercritical fluids from the mantle region into the crust. Such diamonds, mostly spherical with a very smooth surface, are entirely out of the formation place. However, further studies show unusual diamond and lonsdaleite crystals for which a high-pressure and high-temperature formation is at least unlikely [5] because some such crystals are on growth zones of fluorite from Zinnwald. Also, the occurrence of moissanite whiskers (together with nano-diamonds) in beryl crystals [6] speaks against the high-pressure and high- temperature formation. Melt inclusion studies [7] yield data for the pressure and temperature of about ≤ 3 kbar and ≤ 750°C. This data is very different from the classic results.
Recently, Gong et al. (2024) [8] have produced diamonds under normal pressure and high temperatures of about 1175°C in a metal bath in a graphite crucible under a low-pressure methane atmosphere. Together with our results and the results from Gong et al. (2024) [8] and Pujol-Solà et al. (2020) [3], there are obviously more possibilities for the formation of diamonds in nature and technique: (i) classic way at high pressure and high temperature, (ii) via high-pressure and high-temperature transport of diamonds via supercritical fluids into the moderate pressure and temperature range in the Earth’s crust (iii) direct formation at crustal conditions and (iv) formation at high temperature and very low pressure at technical processes (e.g., Gong et al. (2024) [8] and this work).
Sample Material and Methodology
Sample Material
A brief description of the sample material used and basic results is provided in a row of old and recent publications [4-7,9-13] and the references cited in them.
Here, we want to restrict ourselves to two different samples, which have not been described up to now; however, they give new views on the formation of diamonds under very different conditions.
The beryl-quartz sample (Figure 1) from Schlaggenwald (Slavkovský les) is from a small symmetric shaped vein (Mining Academy Freiberg, old archive material from an underground mine from the 1930s years) – see René (2018) [14] and Sejkora et al. (2006) [15].
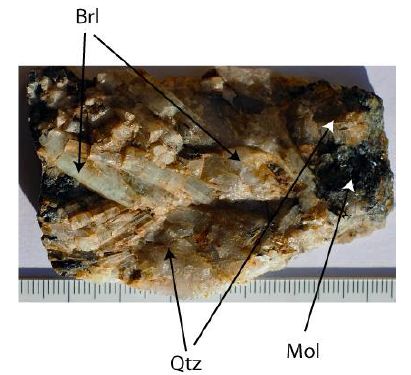
Figure 1: Beryl-quartz sample from Schlagenwald (Slavkovský les). Brl: beryl, Qtz: quartz, Mol: molybdenite. Scale is in cm.
Synthetic fluorite (Figure 2) grown in graphite crucible after the Stockbarger method (in Jena, Germany) – see Leeder 1979 [16].
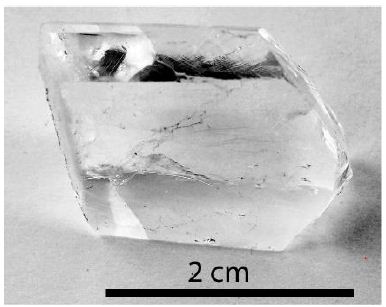
Figure 2: Synthetic water-clear and very pure fluorite grown by the Stockbarger method at atmospheric pressure.
Beryl Crystals from SLAVKOVSKÝ les (Kaiserwald)
The beryl-quartz sample contains the primary minerals beryl, quartz, and molybdenite, as well as many tiny graphite and moissanite crystals in beryl. The thickness of the small vein is about 7 cm. Genetically, the beryl crystals are earlier than the quartz. Beryl grows from the wall to the center of the vein (The sample looks like the beryl sample from the Sauberg mine near Ehrenfriedersdorf [6,10]. The graphite is characterized by nano-, micro-diamonds, and moissanite, which are obviously formed during the graphite crystallization.
Synthetic Fluorite Crystal, Grown After the Stockbarger Method
Sample 2, a water-clear fluorite aggregate, is a cropped piece from a larger one grown using the Stockbarger method (Figure 2). This sample contains a very small number of tiny spherical melt inclusions (~20µm in diameter) and has never dealt with diamonds for preparation.
Microscopy and Raman Spectroscopy
We performed all microscopic and Raman spectroscopic studies with a petrographic polarization Microscope (BX 43) with a rotating stage coupled with an EnSpectr RamMics M532 Raman spectrometer. Raman spectra were recorded in the spectral range of 0–4000 cm-1 using a 50 mW single mode 532 nm laser, an entrance aperture of 20 µm, a holographic grating of 1800 g/mm, and a spectral resolution of 4–6 cm-1. Depending on the grain size, we used microscope objectives with magnifications between 3.2× and 100×. For most measurements on diamonds, lonsdaleite, and moissanite, we used a long-distance LMPLFLN 100× objective from Olympus. The laser energy on the sample was continuously adjusted down to 0.02 mW. The position of the Raman bands was controlled before and after each series of measurements of the Si band, using a single crystal chip of semiconductor-grade silicon. The run-to-run repeatability of the line position (from 20 measurements each) was ± 0.3 cm-1 for Si (520.4 ± 0.3 cm-1) and 0.5 cm-1 for diamond (1332.3 ± 0.5 cm-1 over the range 0–2000 cm-1), respectively. For diamond reference, we used a water-clear natural diamond crystal from Brazil (Mining Academy Freiberg, No 2453/37). For azimuth-dependent measurements, we used a scaled rotating microscope stage. For the identification of the different mineral phases using Raman micro-spectroscopy, we used the data from Hurai et al. 2015 [17] and the RRUFF database (Lafuente et al. (2016) [18]. We also routinely determined the zero point of the Raman spectrometer to test the first-order band position of the diamonds. The position of the first-order Raman bands of the used diamond sprays 0.25 and 1 µm (Struers A/S, Pederstrupvej 84, DK-2750 Ballerup/Denmark) for polishing, measured with Raman spectrometer M532 (n = 10 diamond grains each):
DP-Spray 0.25 µm, 1332.1 ± 1.9 cm-1, FWHM = 65.7 ± 12.8 cm-1,
DP-Spray 1.0, µm, 1332.6 ± 0.7 cm-1, FWHM = 75.4 ± 4.4 cm-1.
FWHM is the Full-Width at Half Maximum.
Results
Slavkovský les (Kaiserwald)
The beryl sample from Slavkovský les is similar to the beryl samples from Ehrenfriedersdorf [10]. However, diamond and moissanite are significantly rarer. In some of the graphite needles, there are also calcite crystals that hint at the starting of a hydrothermal reworking.
Raman measurements on diamond and graphite of such graphite needles give the following values (see also Figures 3 and 4):
Diamond: 1326.8 ± 2.6 cm-1 and Graphite: 1570.0 ± 7.2 cm-1 (n = 18 each).
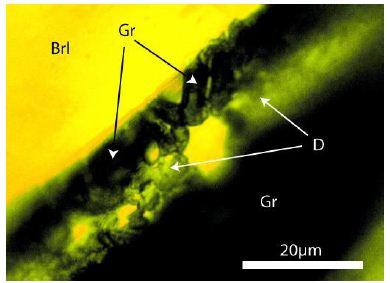
Figure 3: Graphite (Gr) crystals (arrows) at the rim of the graphite/carbon needle in beryl (Brl) and diamond cluster (D).
In contrast to the spherical diamond crystals, which came with the supercritical fluid from the mante region into the crust, the graphite needles crystallized together with beryl on the spot.
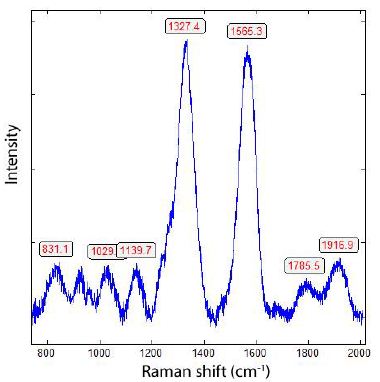
Figure 4: Raman spectrum of nano-diamond (1327.4 cm-1) in the graphite needle (Figure 3) shows the strong G-band of graphitic carbon (1565.3 cm-1).
Generalizing the Finding of Diamonds in a Crustal Level
During the Raman spectrometric study of different minerals (mostly beryl, cassiterite, fluorite, quartz, and topaz) in the Variscan tin-tungsten mineralizations of the Slavkovsky les and Erzgebirge as well as in quartz of quartz veins and granites in the Lusation Mountains we often found nano- and micro-diamonds. To avoid contamination by the preparation [19], the samples were carefully cleaned in an ultrasonic bath, and only diamond, lonsdaleite, and SiC grains that lay under the polished surface were generally used. Cropped pieces that have never seen diamonds for preparation are also suitable. Polishing with Al2O3 or a suspension of silica gel in an alkaline solution is an alternative, which we used in the case of cassiterites. In Figure 5, the results are plotted for diamonds and belonging graphite. Conspicuously, the measuring points often accumulate around 1330 cm-1 for diamonds and 1570 cm-1 for graphite. The most spherical diamonds, transported via supercritical fluids (as inclusions), belong to this group. Noteworthy are the trends A and B. Both trends show a decrease in the first-order Raman position of the diamond with a decline in the carbon band position. The diamonds of the B-trend are more strongly related to the 13C-rich graphite/carbon than trend A. Note, however, that the Raman band of pure 13C-graphite is at 1519 cm-1. The points under these values correspond to the D-band of carbon or can be attributed to vibrations of trans-polyacetylene molecules (see Zaitsev 2001) [20]. The small group of diamonds (point C) represents, according to Zaitsev (2001) [20], a low-temperature formation.
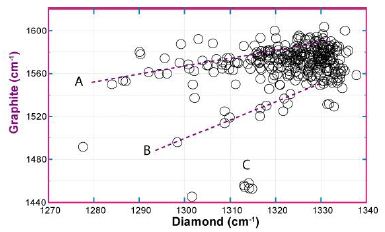
Figure 5: Correlation of the first-order diamond line with the belonging graphite band (475 points). A, B: show the correlations of diamond vs. graphite; C: diamond cluster, grown according to Zaitsev (2001) [20] at low temperatures (below 500°C).
Figure 6 shows the frequency distribution of the 13C content in diamonds (475 sample points) – calculated according to Enkovich et al. 2016 [21]. Such extreme isotope fractionation is remarkable (see Thomas 2025b) [22] and was, up to now, never found. An explanation is a strong isotope fractionation of CH4 or CO2 (12C/13C) in the supercritical fluid and the crystallization of the 13C-rich diamond from it in the crust. Because most 13C-rich diamonds are related to beryl crystals, another explanation should be discussed: Does beryllium, maybe as an intermediate and metastable salt-like carbide [23] at supercritical or near supercritical conditions, have a catalytic meaning for the crystallization of moissanite (often as whiskers) and also favor the formation of 13C-rich diamonds? We know that the solubility of BeO (bromelite) under near-critical conditions is extreme (see Figure 5 in Thomas and Davidson 2010) [24]. It is also essential here that 13C-rich diamonds were never used for sample preparation because the effort to produce such material is too considerable.
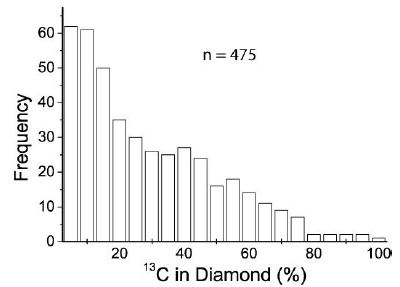
Figure 6: Frequency distribution of 13C in diamond, calculated according to Enkovich et al. 2016 [21].
Two bands dominate most diamonds in crustal rock: the diamond band ≤ 1332.7 cm-1 and the G-band of graphitic carbon around 1584 cm-1 (see Figure 5). However, there are a small number of diamonds that show no or only a very small G-band (Figure 7). That means that the shielding effect of graphitic and amorphous carbon (see Al- Tamimi et al. 2019) [25] usually surrounding the nano-diamonds does not work. That means that the diamonds without the characteristic G-band are micro-diamonds greater than 1 µm.
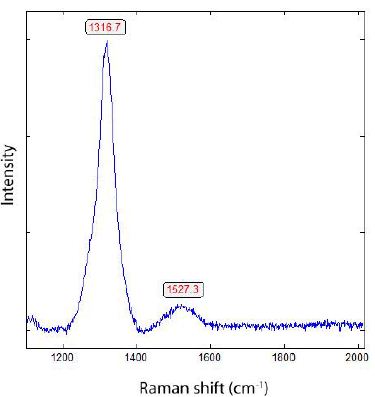
Figure 7: Raman spectrum of 13C-rich diamond in cassiterite (Sn-23) from Zinnwald [12]. The Raman band at 1527 cm-1 is the G band from the 13C-rich graphite [26].
Figure 8 gives the frequency distribution of diamonds without the graphite/carbon band, corresponding to about 30% of all measurements. Table 1 shows the Gaussian fitting results of Figure 8.
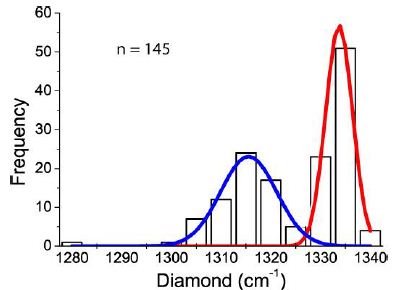
Figure 8: Frequency distribution of the Raman first-order diamond band for diamonds without a graphite band (n = 145 measurements).
Table 1: Gaussian fitting results of the data plotted in Figure 9 (R2 = 0.99344).
|
Peak |
Area |
Center |
Width |
Height |
|
1 |
386.68 |
1333.7 |
5.42 |
56.88 |
|
2 |
226.11 |
1315.5 |
11.26 |
23.10 |
The difference between peaks 1 and 2 is significant. A classification of these diamonds as lonsdaleite, according to Shumilova et al. (2011) [27], is not convincing.
Some Remarks on the Low-Pressure Formation of Diamonds
We have shown that at least two different diamonds occur in Variscan minerals in the Earth’s crust: (i) diamonds transported via supercritical fluids from the mantle region into the crust (mostly very smooth spherical crystals) and (ii) diamonds (often together with moissanite) formed directly in the crust level under low pressure (~3 kbar, ≤ 750°C). The possibility of the formation at low pressure and temperature of nano-diamonds has also been shown, for example, by Pujol-Solà et al. (2020) [3] at the serpentinization of ocean lithosphere under strong reducing conditions (350°C and 1 kbar). However, see Yang et al. 2020 [28], which does not accept this interpretation.
The Formation of Diamonds at Low Pressure and High Temperatures in Technological Processes
The formation of diamonds is traditionally associated with extremely high pressures and temperatures deep in the Earth’s crust or upper mantle. These conditions are also necessary for the technique of transforming carbon atoms into the dense, crystalline structure of diamonds. However, recent research and discoveries have shown that diamonds can also form under less extreme conditions. These findings shed new light on the diverse processes of diamond formation and expand our understanding of geological activities. Gong et al. (2024) [8] have shown through laboratory experiments that diamonds can form under less extreme conditions than previously thought. In controlled experiments, these authors were able to synthesize diamonds at lower pressures and temperatures by using specific chemical catalysts. These experiments confirm that diamond formation is not exclusively dependent on high pressures and temperatures but can also be facilitated by chemical processes. We show here that the unforeseen (and overlooked) formation of diamonds is possible at high temperatures (~1418°C) and very low (~10-4 Torr) pressures during the Stockbarger growing of optical fluorite (CaF2) in a graphite crucible [29]. Figure 2 shows such a water- clear cropped piece of optical fluorite fragment, which contains very rare melt inclusions. These inclusions contain calcium carbide (CaC2), graphite, and tiny diamond crystals (see Figure 9).
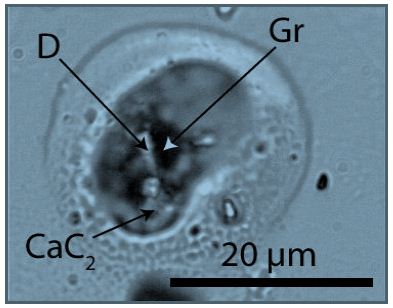
Figure 9: Melt inclusion in fluorite. CaC2: calcium carbide, D: diamond, Gr: graphite.
Figure 10 shows a Raman spectrum of diamond and carbon in such inclusion in optical fluorite. The strong band at 1875 cm-1 in some Raman spectra is characteristically for CaC2 [30]. From 9 measurements, the mean for the first-order Raman band of the diamond is 1320 ± 13.7 cm-1. The FWHM = 31.9 ± 13.4 cm-1.
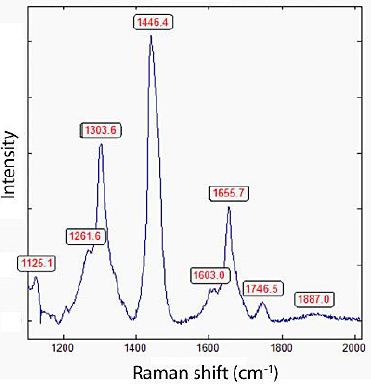
Figure 10: Raman spectrum of diamond in synthetic CaF2 characterized by the 1303.6 cm-1 band and the strong band at 1446 cm-1 corresponding to Zaizev (2001) [20] to nondiamond carbon phases.
Conclusion
The traditional view that diamonds can only form under extreme conditions deep in the Earth’s crust or upper mantle is being challenged by new evidence and research findings. The discovery of diamonds in geological structures with less extreme conditions, such as the Variscan mineralizations represented by them, and experimental evidence expands our understanding of diamond formation processes. These insights open new perspectives for the search for diamonds and the exploration of geological activity on Earth, as well as the technique of production of synthetic diamonds.
Acknowledgment
This paper is dedicated to Paul Davidson (Hobart/Tasmania) for his 20 years of productive cooperation with the first author.
References
- Cartigny P (2005) Stable isotopes and origin of Elements 1: 77-84.
- Heaney PJ, Vicenzi ER, De S (2005) Strange diamonds: The mysterious origins of carbonado and Elements 1: 85-89.
- Pujol-Solà N, Garcia-Casco A, Proenza JA, González-Jiménez JM, delCampo A, et (2020) Diamond forms during low pressure serpentinisation of oceanic lithosphere. Geochemical Perspectives Letters 15: 19-24.
- Thomas R, Davidson P, Rericha A, Recknagel U (2023a) Ultrahigh-pressure mineral inclusions in a crustal granite: Evidence for a novel transcrustal transport mechanism. Geoscience 194: 1-13.
- Thomas R, Trinkler M (2024) Monocrystalline lonsdaleite in REE-rich fluorite from Sadisdorf and Zinnwald/E-Erzgebirge, Geol Earth Mar Sci 6: 1-5.
- Thomas R, Recknagel U, Rericha A (2023b) A moissanite-diamond-graphite paragenesis in a small beryl-quartz vein related to the Variscan tin-mineralization of the Ehrenfriedersdorf deposit, Aspects in Mining & Mineral Sci 11: 1310- 1319.
- Thomas R, Klemm W (1997) Micrometric study of silicate melt inclusions in Variscan granites from SE Germany: Volatile content and entrapment Journal of Petrology 38: 1753-1765.
- Gong Y, Luo D, Choe M, Seong WK, Bakharev P, et (2024) Grow of diamond in liquid metal at 1 atm pressure. Nature 629: 348-354.
- Thomas R (1982) Ergebnisse der thermobarogeochemischen Untersuchungen an Flüssigkeitseinschlüssen in Mineralen der postmagmatischen Zinn-wolfram- Mineralisation des Erzgebirges. Freiberger Forschungshefte C370, Pg: 85.
- Thomas R (2023) Growth of SiC whiskers in beryl by a natural supercritical VLS Aspects in Mining & Mineral Sciences 11: 1292-1297.
- Thomas R (2024) Rhomboeddric cassiterite as inclusions in tetragonal cassiterite drom Slavkovský les – North Bohemia (Czech Republic). Geol Earth Mar Sci 6: 1-6.
- Thomas R (2025a) Extremely 13C-rich diamond in orthorhombic cassiterites in the Variscan Erzgebirge, Saxony/Germany. Geol Earth Mar Sci 7: 1-5.
- Thomas R, Recknagel U (2024) Lonsdaleite, diamond, and graphite in a lamprophyre: Minette from East-Thuringia/Germany. Geol Earth Mar Sci 6: 1-4.
- René M (2018) Petrology, geochemistry and mineralogy of greisens associated with tin-tungsten mineralisation: Hub Stock deposit at Krásno–Horní Slavkov Ore District, Czech Chapter 1 in: Contributions to Mineralization, ed. by Ali Al-Juboury, IntechOpen Limited, London. 1-21.
- Sejkora J, Onduš P, Fikar M, Veselovský F, March Z, et (2006) New data on mineralogy of the Vysoký Kámen deposits near Krásno, Slavkovský les area, Czech Republic. Journal of the Czech Geological Society 51: 43-55.
- Leeder O (1979) VEB Deutscher Verlag für Grundstoffindustrie, Leipzig, Pg: 266.
- Hurai V, Huraiova M, Slobodnik M, Thomas R (2015) Geofluids—Developments in Microthermometr, Spectroscopy, Thermodynamics, and Stable Isotopes; Elsevier: Amsterdam, The Pg: 489.
- Lafuente B, Downs RT, Yang H, Stone N (2016) The power of databases: The RRUFF In: Highlights in Mineralogical Crystallography; Armbruster, T., Danisi, R.M., Eds.; De Gruyter: Berlin, Germany; München, Germany; Boston, MA, USA, pp: 1–30.
- Keller DS, Ague Jj (2022) Possibilities for misidentification of natural diamond and coesite in metamorphic rocks. N Jb Miner Abh 197: 253-261.
- Zaitsev AM (2001) Optical Properties of A Data Handbook. Springer, Pg: 502.
- Enkovich PV, Brahkin VV, Lyapin SG, Novikov AP, Kanda H, et (2016) Raman spectroscopy of isotopically mixed (12.5) diamond single crystals at ultrahigh pressures. Journal of Experimental and Theoretical Physics 123: 443-451.
- Thomas R (2025b) Orthorhobic cassiterite and 13C-rich diamond in a sample from Land’s End granite, SW England, and some remarks on the origin of the 13C-rich diamond and Geol Earth Mar Sci 7: 1-4.
- Everest DA (1964) The Chemistry of Elsevier. Pg: 151.
- Thomas R, Davidson P (2010) Hambergite-rich melt inclusions in morganite crystals from the Muiane pegmatite, Mozambique and some remarks on the paragenesis of Minr Petrol 100: 227-239.
- Al-Tamimi BH, Jabbar II, Al-Tamimi HM (2019) Synthesis and characterization of nanocrystalline diamond from graphite flakes via a cavitation-promoted process. Heliyon 5: 1-5.
- Gutierrez G, Le Normand F, Aweke F, Muller D, Speisser C, Antoni F (2014) Mechanism of thin layers graphite formation by 13C implantation and Appl Sci 4: 180-194.
- Shumilova TG, Mayer E, Isaenko SI (2011) Natural monocrystalline Doklady Earth Sciences 441: 1552-1554.
- Yang J, Lian D, Robinson PT, Qiu T, Xiong F, et (2020) Geological evidence does not support a shallow origin for diamonds in ophiolite. Acta Geologica Sinica 94: 70-72.
- Wilke K-Th, Bohm J (1988) Kristall Züchung. VEB Deutscher Verlag der Wissenschaften Pg: 1088.
- Konar S, Nylén J, Svensson G, Bernin D, Edén M, et al. (2016) The many phases of CaC2. Journal of Solid State Chemistry 239: 204-213.