DOI: 10.31038/AFS.2021323
Abstract
A dredge survey was conducted in September 2015 to provide the first assessment of sea urchin resources in southern Breiðafjörður (65°07´N, 22°31´W). An underwater photography of the sea floor was undertaken as well. The efficiency of the dredge was assessed by comparing the number of sea urchin/m2 seen on photos to the number/m2 caught by the dredge. The efficiency varied between sub-areas investigated with average of 29%. The whole area investigated was 9.7 km2, consisting of seven sub-areas. Sea urchins were found in significant concentration in all sub-areas with the average density ranging from 1.7 to 6.9 ind/m2. The density was correlated with depth and bottom topography. The mean density for all areas combined was 3.5 ind/m2, giving a stock size of 2.700 tonnes.
Introduction
In Icelandic waters the green sea urchin (Strongylocentrotus droebachiensis) is the only targeted urchin species. It is common around Iceland but its distribution is very pachy. Harvesting started in 1983 by divers which was not economically feasible and stopped in 1989. In 1993 the fishing started again and now by dredging and peaked in 1994 when 1 500 tonnes were landed. After that the fishery diclined extremely and stopped 1997. More than half of the catches in these years came from Breiðafjörður west Iceland, but the fishery was conducted wiedly. In 2004 exploitation of the stock started again and now only in Breiðafjörður. The landings were minimal (<50 t) until 2007 when it reached 134 tonn. Since then the landings have been 130-400 tonn [1]. The main fishery has alway been in the the southern part of Breiðafjörður and focused on small hot spots. Since 1993 sea urchins have only been harvested by dredging but the selectivity and efficiency of the dredges used in Iceland is unknown.
The information on geographical distibution and size of the stock around Iceland is limited and no estimates of biomass, trends in relative abundance or assessments of sutainable yield existed before 2015. No fishery-indipendent survey has been done until now (2015) and the only data (location, landed catch, fishing effort) that have been abailable are from the fishery. However, some investigations on densities (ind./m2) and population structures in very small areas off Iceland have been carried out by diver sampling. The results have shown patchy distribution, either low densities or high with grate range at the same locations at different time [2-4].
The main objective of the present study was to assess the stock size and distribution in the main fishing area in Breiðafjörður west Iceland and the efficiency of the dredge used.
Material and Methods
In September 2015 a survey was conducted to assess the usable sea urchin stock in southern Breiðafjörður the main fishing area in west Iceland at depth of 8-60 m. The survey was carried out on a commercial sea urchin fishing vessel using a commercial dredge measuring 250 cm in width and with 150 cm long bag. The mask size of the bag was 100 mm. The main fishing area in the fjord was divided into seven smaller sub-areas differing in size, depth and bottom type.
In order to determine the distribution and biomass/abundances two methods were used, bottom photogrpahy and area swept method, conducted at the same time at the same site. An underwater photocamera was used to estimate the density of urchins from photograps. Photographs were taken at 22 sites within four of the seven investigated areas (I, II, VI, and VII) (Figure 1). A total of 160 photos were captured and the sea urchins from the photos were counted. When the area swept method was used, each catch was weighed and the distance covered by the dredge was caluclated. The total catch weight was divided by the size of the area covered in each tow to give abundance in kg/m2. Biomass estimates in a given area were calculated from the mean biomass in that area multiplied by the total size of the area. The density of the green sea urchins (no/m2) was calculated by dividing the mean wet weight of the individuals in an area (which differed between areas) into the abundance (kg/m2) of the area. This was carried out for all subareas except area V where the abundance was assessed from previous fishing surveys.
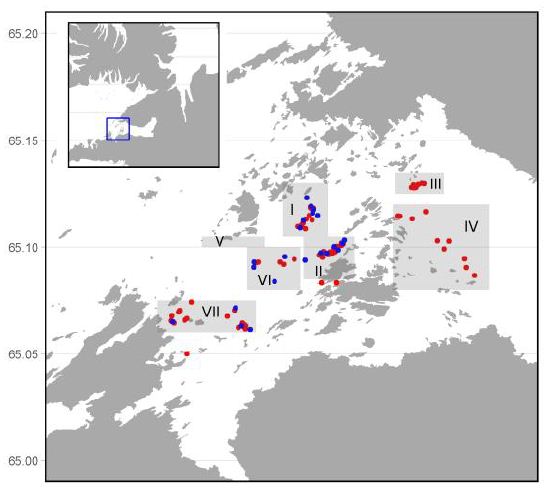
Figure 1: A map of the seven fishing subareas (shaded) investigated in Breiðafjörður. The red dots denote the dredge stations and the blue are photo stations.
The density (no/m2) of sea urchins from the photos and the results from the dredge survey (no/m2) from the same area at the same time were compared and the dredge efficiency assessed as a percent of captured individuals of what was observed from the photographs. The assessed efficiency of the dredge was then used to calculate the stock size within an area and as a whole for all areas combined.
Results
The mean number of sea urchins counted from the bottom photographs within an area, range and the mean number caught by the dredge as well as the efficiency of the dredge is shown in Table 1. The highest mean density (6.6 ind/m2) from photos as well as the smallest catch by the dredge 0.5 ind/m2 was in area VI at 55 m depth, resulting in the lowest efficiency (8%). The efficiency was highest (57%) in area VII at 20 m depth, where the lowest density was observed from the photos (1.5 ind/m2). The mean efficiency of the dredge was 29%, ranging from 8-57% between areas (Table 1).
Table 1: Mean number of urchins/m2 from photos, range, percentage of photos without urchins, mean number of urchins/m2 from catch and mean efficiency of the dredge.
|
Area |
No. of | No. of | Mean no/m2 | Range | % zero | Mean no/m2 |
Mean efficiency |
|
stations |
photos | no/m2 | photos | Dredge |
of dredge |
||
|
I |
7 | 54 | 2.8 | 1.3-3.8 | 2 | 0.9 |
32 |
|
II |
5 | 45 | 5.4 | 2.9-8.6 | 7 | 1 |
20 |
|
VI |
5 | 31 | 6.6 | 3.9-13.7 | 10 | 0.5 |
8 |
|
VII |
3 | 30 | 1.5 | 1.2-2.0 | 70 | 0.8 |
57 |
|
All areas |
20 | 160 | 4.1 | 1.2-13.7 | 18 | 0.9 |
29 |
The whole area investigated measured 9.7 km2 and contained seven smaller harvesting areas (sub-areas) that differed in size, depth and bottom topography (Figure 1). Sea urchins were widely distributed and found at all stations sampled (91) at 8-60 m depth. The estimated mean abundance, assessed by the area swept method corrected for the dredge efficiency, ranged from 0.14-0.41 kg/m2 and the density from 1.7-6.9 ind./m2. The standing stock for all areas combined was assessed to be 2.700 tonnes (Table 2).
Table 2: Mean wet weight ± SD of sea urchin in each area. Depth, area size, estimated mean abundance and range (kg/m2), density (no/m2) and total standing stock/biomass (wet weight t) for green sea urchin at 8-60 m depth. The abundance, density and biomass is corrected with the efficiency of the dredge which was calculated as 29%.
|
Area |
No. of | Weight (g) | Depth range | Area | Abundance | Range | Denstiy | Standing |
| no | samples | mean ± SD | mean (m) | km2 | kg/m2 | kg/m2 | no/m2 |
stock (mt) |
|
I |
21 | 90 ± 32 | 28-55 | 0.7 | 0.28 | 0.14-0.69 | 3.1 | 196 |
| mean=35 | ||||||||
|
II |
28 | 81 ± 33 | 18-60 | 0.3 | 0.28 | 0.14-0.52 | 3.4 | 84 |
| mean=32 | ||||||||
|
III |
14 | 78 ± 32 | 8-14 | 1.4 | 0.41 | 0.07-0.72 | 5.1 | 574 |
|
mean=11 |
||||||||
|
IV |
7 | 46 ± 26 | 8-13 | 2.7 | 0.31 | 0.14-0.48 | 6.9 | 837 |
| mean=11 | ||||||||
|
V |
0 | 0.8 | 0.28 | Estimated | 3.4 | 224 | ||
| VI | 2 | 85 ± 33 | 14-55 | 3.4 | 0.14 | 0.07-0.21 | 1.7 |
476 |
|
VII |
19 | 113 ± 46 | 14-33 | 0.4 | 0.24 | 0.07-0.38 | 2.1 | 96 |
| mean=19 | ||||||||
|
All areas |
91 | 93 ± 38 | 8-60 | 9.7 | 0.28 | 0.24-0.72 | 3.5 |
2716 |
*The abundance in area was estimated from previous fishing surveys but the size of the area was measured in the study.
The density of the green sea urchin in the areas differed, but the mean density for all areas combined was 3.5 ind/m2 . The maximum was found at the lowest mean depth (11m) at stations III (5.1 ind/m2) and IV, (6.9 ind/m2) at gravel bottom with kelp beds. The size of these areas were moderate giving the maximum biomass in these areas. Average density was observed in area I (3.1 ind/m2) and II (3.4 ind/m2) where the mean depth was 35 and 33 m respectively. Here the bottom was covered with gravel and drifting kelp was observed. These were the smallest areas in the investigation. The lowest density was observed at area VI (1.7 ind. m-2) (only 2 tows taken) and VII (2.1 ind. m-2), where the depth varied greatly between stations with a mean of 19 m at area VII. The bottom was gravel and rocky with kelp beds. The size of area V was measured but the density was estimated from previous fishing as beeing 3.4 ind. m-2 (Table 2).
Discussion
The total green sea urchin stock investigated in the main fishing area in southern Breiðafjörður was estimated to be around 2.700 tonnes. The distribution of the urchins was patchy in seven sub-areas observed, differing in depth, size and density of the urchins. Most of the tows (88%) were taken at 8-35 m depth and the most common bottom type was sand and gravel, although rocky substrata and mud were also observed. The maximum density (area III and IV) was observed at the lowest depth (mean 11 m) in kelp beds at gravel bottom. Kelp beds might indicate a high food supply but nutrition influences growth and reproduction [5]. At greater depths as 35 m (area I and II) the density was rather low, kelp was observed probably drifting, as kelp beds occur at maximum 30 m depth [6]. The lowest density (area VI) was observed in a single tow taken at the gratest depth (50m) on muddy bottom where food supply might be a limited factor.
In Icelandic waters the green sea urchin is most common in the shallow subtidal zone at depts above 50 m but have been observed down to 600 m [7]. The density generally decreases with depth to about 20-30 m which in many areas corresponds to the distribution of kelp [6]. The green sea urchin is most often distributed on a rocky bed but is also found on gravel and sandy bottoms [8] especially where there are strong currents and good food supply [6,9]. Upper depth limits vary with season and wave action that can dislodge the urchins or limit their change to graze on macroalgae. On sedimentary bottoms urchins rely on drift algae and are more sparsely distributed [8]. Sea urchin mainly feed on kelp but are also known for feeding on various bottom species, dead animals and even on lime algae scraping from rocks [10,11]. In this study, the greatest distribution was observed at lower depths in kelp beds. However, at greater depths, drifting algae [12] and detrital kelp [13] can supply food enough for sea urchin to grow and reproduce.
In the present study an indirect method was used to estimate the efficiency of the dredge. The number of sea urchins seen on bottom photographs were compared to the number that was fished by the dredge at the same site just after photographing. The mean efficiency of the dredge for all areas combined was estimated 29%. The efficiency differed between all areas and was related to depth, highest at the moderate depth. Efficiency and selectivity of dredges are influenced by numerous factors such as their design, on operational factors i.e. towing speed, the ratio of warp length versus water depth, duration of the tow, and on environmental factors such as depth, current speed and bottom type. The efficiency can be estimated by various methods as by comparing the abundance, size and biomass of urchins in the dredge catch with those remaining in tracks after dredging (direct method) [14-17] or with that of un-dredged sediments (indirect method) [18]. Efficiency and selectivity can also be assessed by repeatedly fishing the same area until the target species is markedly reduced [19]. Capture efficiency for dry dredges has been estimated for several bottom-dwelling commercial bivalves, primarily scallops with different methods giving different efficiency from 1-40% depending on investigations [14,17,20-22].
References
- Hafrannsóknastofnun (2019) ÍGULKER – SEA URCHIN Strongylocentrotus droebachiensis. Ástand nytjastofna sjávar og ráðgjöf 2019. Hafrannsóknastofnun júní 2019. (In Icelandic with English summary).
- Einarsson ST (1991) Ígulkerarannsóknir. Hafrannsóknastofnun 29. (In Icelandic).
- Ásbjörnsson HP (2011) Management and utilization of Green sea urchin (Strongylocentrotus droebachiensis) in Eyjafjördur, nothern Iceland. Master´s Thesis University of Akureyri Iceland
- Hjörleifsson E, Kaasa Ö, Gunnarsson K (1995) Grazing of kelp by green sea urchins in Eyjafjörður, North Iceland. In: Skjöldal HR, C Hopkins, KE Erikstad, HP Leinaas (eds.) Ecology of Fjords and Coastal Waters. Amst., Elsevier, 593-598.
- Minor M, Scheibling R (1997) Effects og food ration and feeding regime on growth and reproduction of the sea urchin Strongylocentrotus droebachiensis. Marine Biology 129: 159.
- Himmelman JH (1986) Population biology of green sea urchins on rocky barrens. Marine Ecology Prog Series 33: 295-306.
- Botndýragrunnur (2018) Gagnagrunnur um botnlægar tegundir sjávardýra á Íslandsmiðum. A vegum Hafrannsóknastofnunar, Náttúrufræðistofnunar Íslands og Líffræðistofnunar Háskóla Íslands. (In Icelandic).
- Filbee-Dexter K, Scheibling RE (2012) Hurricane mediated defoliation of kelp beds and pulse delivery of kelp detritus of offshore sedimentary habitats. Marine Ecology Prog Series 445: 51-64.
- Scheibling RE, Raymond BG (1990) Community dynamics on a subtidal cobble bed following mass mortalities of sea urchins. Marine Ecology Prog Series 63: 127-145.
- Himmelman JH, Steele DH (1971) Foods and predators of the green sea urchin Strongylocentrotus droebachiensis in Newfoundland waters. Marine Biology 9: 315-322.
- Briscoe CS, Sebens KP (1988) Omnivory in Strongylocentrotus droebachiensis (Müller) (Echinodermata, Echinoidea): Predation on subtidal mussels. Journal of Experimental Marine Biology and Ecology 115: 1-24.
- Kelly JR, Krumhansl RE, Scheibling E (2012) Drift algal subsides to sea urchins in low productivity habitats. Marine Ecology Prog Series 452: 145-157.
- Filbee-Dexter K, Scheibling RE (2014) Detrial kelp subsidy supports high reproductive condition of deep living sea urchins in a sedimenatry basin. Aquatic Biology 23: 71-86.
- Caddy JF (1968) Underwater observations on scallop (Placopecten magellanicus) behaviour and dredge efficiency. Journal of fisheries Research Board Can 25: 2123-2141.
- Caddy JF (1971) Efficiency and selectivity of the Canadian offshore scallop dredge C.M. 1971/K: 25. 8.
- Medcof JC, Caddy JF (1971) Underwater observations on performance of clam dredges of three types. ICES, C.M. 1971/B:10, 7.
- Mason J, Chapman CJ, Kinnear JAM (1979) Population abundance and dredge efficiency studies on the scallop, Pecten maximus (L.). Rapp Pv Réun Cons Int Explor Mer 175: 91-96.
- Fifas S (1991) Analyse et modélisation des paramétres d´exploitation du stock du coquilles Saint- Jacques (Pecten maximus, L) en baie de Saint-Brieuc (Manche quest, France). PhD thesis, Universite de Bretagne Occidentale, Brest. 422.
- DeLury AB (1947) On the estimates of biological populations. Biometrics 3: 145-164.
- Fifas S, Berthou P (1999) An efficiency model of a scallop (Pecten maximus, L.) experimental dredge: Sensitivity study. ICES Journal of Marine Science 56: 489-499.
- Beukers‐Stewart BD, Jenkins SR, Brand AR (2001) The efficiency and selectivity of spring‐toothed scallop dredges: A comparison of direct and indirect methods of assessment. Journal of Shellfish Research 20: 121-126.
- Einarsson ST (1993) Lífríki sjávar, Skollakoppur. Reykjavík, Námsgagnastofnun‐Hafrannsóknastofnun. 6pp. (In Icelandic).