Abstract
Evidence of climate change in the tropics is often depicted by declining rainfall patterns, as mean tropical temperatures are high. A 12-month Standardized Precipitation Index was used in assessing drought recurrence as an indicator to evaluate climate change in Bamenda from 1963-2019. Results showed that the mean annual rainfall is 182.52 mm, with a Standard Deviation of 29.16 and a Coefficient of Variation of 15.96%, while rainfall has reduced by 2.07 mm. This deficit matches with a declining mean annual rainfall trend. The mean Standardized Precipitation Index is -0.17 (mild dryness), with 16 episodes of mild dryness, 4 moderate dryness, 3 severe dryness and 3 extreme dryness incidents. There is a need for the population to engage in water-saving activities to adapt to rainfall deficits.
Keywords
Climate index, Drought, Rainfall
Introduction
Rainfall events across the earth’s surface, for varied reasons, are unevenly distributed. Such variation is reflective of the availability of water for human use and the cycles of activities like agriculture [1]. In this era of global environmental changes, a sound knowledge of the climate of human-populated territories is indispensable, considering the current phenomenon of climate change [2]. Rainfall variability, which refers to changes in the amount of rain received in a specified geographic space within a defined period, can be daily, monthly, seasonal or annual. Precipitation change averaged over global land areas is low before 1951 and medium afterwards because of insufficient data, particularly in the earlier periods of the records [3]. The long-term mean rainfall for a month, season or year does not often indicate the regularity with which given amounts of rainfall can be expected, especially in the low latitudes where rainfall is known to be highly variable in its incidence from one year to another [1]. In the tropics, rainfall tends to be more variable seasonally than annually. Rainfall variability is a measure of the degree of likelihood that the mean amount of rainfall may be repeated each year, season or month depending on the period under consideration [4-6]. The paper bridges some methodological gaps in previous studies on climate variability in Cameroon. Ngakfumbe [7] analysed rainfall probability and reliability over Cameroon, using Standard Deviation (SD) and Coefficient of Variation (CV), with no other climatic index. Molua and Lambi [8] made a descriptive analysis of rainfall variability and its impact on water resources over Cameroon, to note that mean annual rainfall decreases inversely to latitude, without specifying the indices that show regional variations. Tume [9-11] assessed the susceptibility of water resources to climate variability on the Bui Plateau, using the Rainfall Seasonality Index (SI) and Standardized Precipitation Index (SPI), which failed to reveal regional disparities at a mesoscale. Meteorological drought has different impacts on groundwater, reservoir storage, soil moisture and streamflow and as such, McKee, Doesken and Kleist [12] develop the SPI in 1993 in which precipitation is the only required input parameter that is used in analyzing wet and dry cycles. Data sets required to compute SPI require 90% or even 85% complete records. The SPI was designed to quantify precipitation deficits for multiple timescales that best reflect drought impact on the availability of water resources. Moisture responds to precipitation anomalies on a relatively short scale. McKee [12] originally calculated the SPI for 3-, 6-, 12-, 24- and 48-month timescales. Positive SPI values indicate greater than median precipitation and negative values indicate less than median precipitation. Since the SPI is normalized, wetter and drier climates can be represented in the same way. The recurrence of meteorological, hydrological and agricultural droughts indicate that that climate is changing. This is critical in a tropical location like Bamenda where livelihood sources are rain-fed, such as agriculture and recharge of surface and groundwater resources.
Study Area
Bamenda is the headquarters of the North West Region and the socio-economic nerve wire of the region. Bamenda is a primate city considering her situation which is gradually merging with satellite towns like Bambui, Bambili, Bafut, Mbengwi, Bali, Bafut and Santa. The study area covers three Sub-Divisional Councils (Bamenda I, Bamenda II, Bamenda III). It is located between longitudes 10o09″ and 10o11″E of the Greenwich Meridian and between latitudes 5o56″N and 5o 58″N (Figure 1).
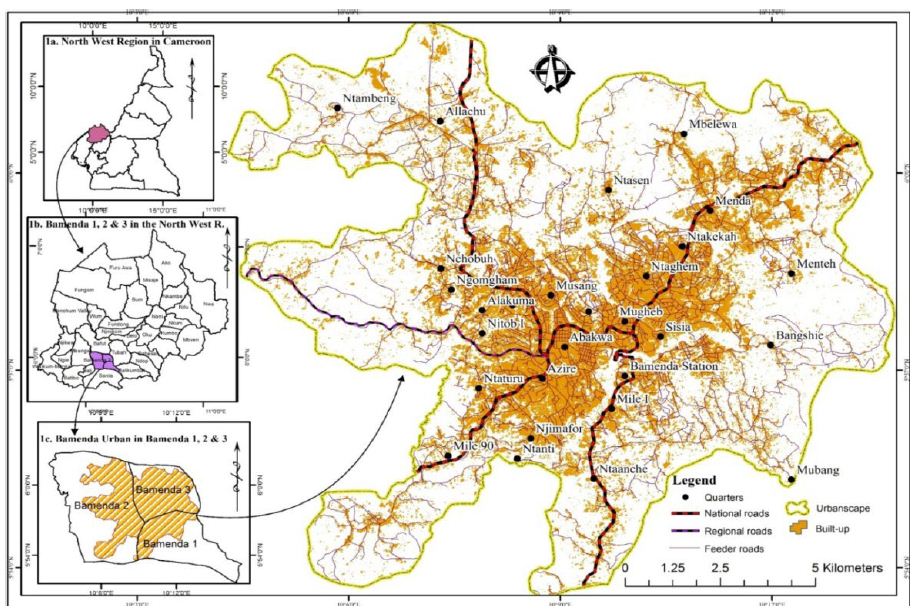
Figure 1: Location of Bamenda
Bamenda has a tropical climate, with a rainy and dry season. The dry season sets in from November till April, while the rainy season runs from April to November. It has been observed that the dry season has been prolonged over time. Even when the wet season sets in April, it is often characterised by recurrent dry spells that linger on till June [11]. Such dry spells are detrimental to agriculture and water resources as rainfall is often below a threshold to sustain tender crops and recharge surface and groundwater resources. These are shreds of evidence of agricultural, meteorological and hydrological droughts [13].
Data Collection and Analysis
Rainfall data were collected from the Regional Meteorological Service at the Northwest Delegation of Transport for a period of 56 years (1963-2019). Standardized Precipitation Index (SPI) is a tool that was developed primarily for defining and monitoring drought. It allows an analyst to determine the rarity of a drought at a given time scale of interest for any rainfall station with historic data. It can also be used to determine periods of anomalously wet events. Conceptually, SPI is the number of standard deviations by which the precipitation values recorded for a location would differ from the mean over certain periods. In statistical terms, the SPI is equivalent to the Z-score. It is calculated thus:
![]()
Where: Z-score expresses the x score’s distance from the mean (µ) in standard deviation (δ) units.
The SPI is the cumulative probability of a given rainfall event occurring at a geographic location (Table 1).
Table 1: Drought probability of recurrence
|
SPI Value |
Category | Probability | Freq. in 100 years |
Severity of event |
| >2.00 | Extreme wet |
2.3 |
100 |
1 in 1 year |
| 1.5 to 1.99 | Severely wet |
4.4 |
70 |
1 in 1.1 years |
| 1.00 to 1.49 | Moderately wet |
9.2 |
50 |
1 in 1.3 years |
| 0 to 0.99 | Mildly Wet |
34.1 |
45 |
1 in 1.5 years |
| -0.1 to -0.99 | Mild dryness |
34.1 |
33 |
1 in 3 years |
| -1.00 to -1.49 | Moderate dryness |
9.2 |
10 |
1 in 10 years |
| -1.50 to -1.99 | Severe dryness |
4.4 |
5 |
1 in 20 years |
| <-2 | Extreme dryness |
2.3 |
2.5 |
1 in 50 years |
Source: McKee et al., (1993, 1995); World Meteorological Organization (2012) [13]
A 12-month SPI time series was used to assess the recurrence of meteorological, agricultural and hydrological droughts. All anomaly graphs generated were fitted with trend lines and linear equations. The trend lines indicate an increase or decrease. Rainfall reliability was assessed using the Coefficient of Variation (CV). CV is calculated thus:
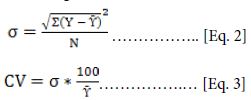
Where: Ῡ = mean, N = sample size.
Results
The results are divided into mean monthly and annual rainfall patterns, and SPI valuation of climate change.
Mean Monthly and Annual Rainfall Pattern
Rainfall in Bamenda increases from the onset of the wet season to a peak in July to September and gradually drops as the dry season sets in Figure 2.
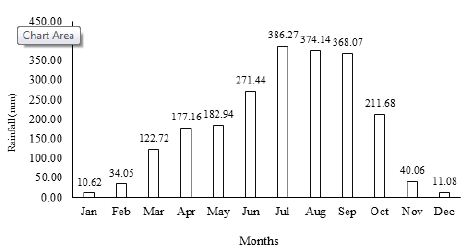
Figure 2: Mean monthly rainfall for Bamenda
The lowest rainfall is recorded from December to March. To assess how much rainfall has changed, the data were grouped into 3-month segments (Table 2).
Table 2: Rainfall change over Bamenda (1963-2019)
|
Months |
Decadal mean rainfall (mm) | |||||
| 1963-1972 | 1973-1982 | 1983-1992 | 1993-2002 | 2003-2012 |
2013-2019 |
|
| DJF |
25.07 |
19.85 | 16.5 | 9.7 | 17.71 |
24.5 |
| MAM |
184.17 |
161.78 | 158.82 | 149.1 | 138.9 |
178.01 |
| JJA |
387.6 |
361.9 | 364.2 | 356.4 | 325.9 |
235.06 |
| SON |
238.81 |
240.9 | 202.5 | 210.9 | 195.97 |
126.5 |
| Mean |
208.91 |
196.11 | 185.51 | 181.53 | 169.62 |
141.02 |
| Change |
26.39 |
13.59 | 2.98 | -1.00 | -12.90 |
-41.50 |
DJF: December, January, February; MAM: March, April, May, JJA: June, July, August, SON: September, October, November
From 1963-1972, rainfall had an excess of 26.39 mm and has been declining over time. Between 1973-1982, the rainfall had dropped by 13.59 mm and 2.98 mm from 1983-1992. Since 1993, Bamenda has witnessed rainfall deficits (-1 mm from 1993-2002, -12.9 mm from 2003-2012 and -41.5 mm from 2013-2019). The average rainfall decline from 1963-2019 is -2.07 mm. This proves that the climate is changing and is affirmed by the declining inter-annual rainfall trend (Figure 3).
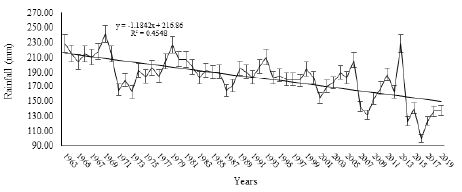
Figure 3: Inter-annual rainfall for Bamenda (1963-2019)
The mean annual rainfall for Bamenda is 182.52 mm, with a Standard Deviation (SD) of 29.16 and a Coefficient of Variation (CV) of 15.96% (reliable).
Standardized Precipitation Index Valuation of Climate Change
The climatic index used in assessing climate variability and change for this study is SPI. The SPI inter-annual pattern is the same as the inter-annual rainfall, with the same Coefficient of Determination (R2) of 0.4548 (45.48%) (Figure 4).
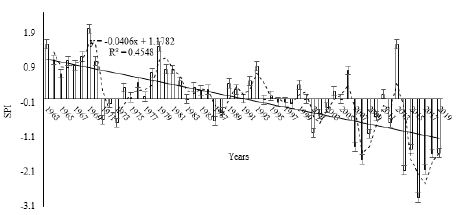
Figure 4: Inter-annual Standardized Precipitation Index for Bamenda (1963-2019)
More insights into rainfall change over Bamenda are presented through decadal SPI trends. From 1963-1972, the SPI trend decreased above the average (Figure 5).
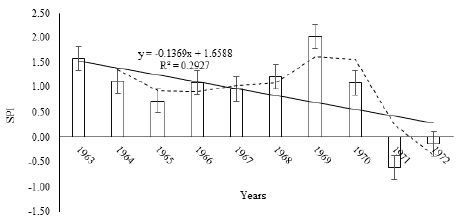
Figure 5: Standardized Precipitation Index for Bamenda (1963-1972)
The SPI episodes were 1963 (1.57-moderately wet), 1964 (1.12-moderately wet), 1965 (0.73-mildly wet), 1966 (1.09-moderately wet), 1967 (0.96-mildly wet), 1968 (1.21 (moderately wet), 1969 (2.02-extreme wet), 1970 (1.09-moderately wet), 1971 (-0.6-mild dryness) and 1972 (-0.13-mild dryness). Eight out of the ten years of this decade were wet years, except 1971 and 1972. The dry years continued till 1973. The decade 1973-1982 experienced an increasing SPI trend, with nine wet years out of the ten (Figure 6).
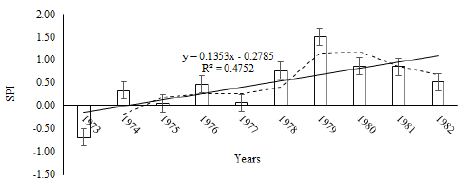
Figure 6: Standardized Precipitation Index for Bamenda (1973-1982)
The SPI episodes were, 1973 (-0.69-mild dryness), 1974 (0.32-mildly wet), 1975 (0.04-mildy wet), 1976 (0.46-mildly wet), 1977 (0.06-mildly wet), 1978 (0.75-mildly wet), 1979 (1.51-moderately wet), 1980 (0.86-mildly wet), 1981 (0.84-mildly wet) and 1982 (0.51-mildly wet). The SPI trend increased above the average from 1983 to 1992 (Figure 7).
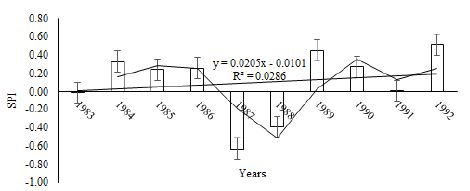
Figure 7: Standardized Precipitation Index for Bamenda (1983-1992)
In 1983, the SPI value was (-0.01-mild dryness), 1984 (0.33-mildly wet), 1985 (0.24-mildly wet), 1986 (0.26-mildly wet), 1987 (-0.63-mild dryness), 1988 (-0.39-mild dryness), 1989 (0.45-mildly wet), 1990 (0.27-mildly wet), 1991 (0-mildly wet) and 1992 (0.51-mildly wet). The 1993 to 2002 period can be seen as a dry decade, with a decreasing SPI trend and seven years of negative SPI (Figure 8).
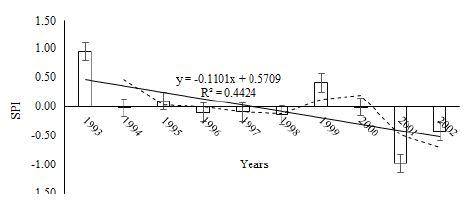
Figure 8: Standardized Precipitation Index for Bamenda (1993-2002)
The SPI episodes were 0.95 (mildly wet) in 1993, 1994 (-0.03-mild dryness), 1995 (0.09-mildly wet), 1996 (-0.10-mild dryness), 1997 (-0.10-mild dryness), 1998 (-0.14-mild dryness), 1999 (0.4-mildly wet), 2000 (-0.01-mild dryness), 2001 (-0.99-mild dryness) and 2002 (-0.43-mild dryness). The 2003 to 2012 period was also another dry decade, with a decreasing SPI below the average (Figure 9).
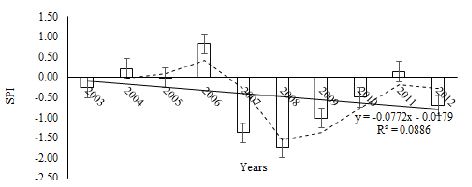
Figure 9: Standardized Precipitation Index for Bamenda (2003-2012)
The SPI values were, 2003 (-0.26-mild dryness), 2004 (0.21-mildly dry), 2005 (-0.01-mild dryness), 2006 (0.82-mildly wet), 2007 (-1.38-moderate dryness), 2008 (-1.75-severe dryness), 2009 (-1.01-moderate dryness), 2010 (-0.50-mild dryness), 2011 (0.14-mild dryness and 2012 (-0.69-mild dryness). From 2013 to 2019, the SPI continued to decline below the average (Figure 10). It is also another dry decade.
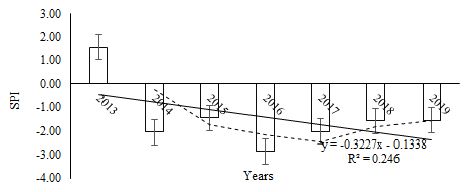
Figure 10: Standardized Precipitation Index for Bamenda (2013-2019)
The SPI incidents were, 2013 (1.57-severely wet), 2014 (-2.06-extreme dryness), 2015 (-1.46-moderate dryness), 2016 (-2.86-extreme dryness), 2017 (-2.03-extreme dryness), 2018 (-1.58-severe dryness) and 2019 (-1.56-severe dryness). Rainfall and SPI characteristics for Bamenda can be summarized (Table 3).
Table 3: Summary of rainfall characteristics and SPI
|
Period |
MAR (mm) | CV (%) | Mean SPI | SPI class | Trend |
Reliability |
| 1963-1972 |
208.92 |
10.69 |
0.91 |
Mildly wet | Decreasing | Reliable |
| 1973-1982 |
196.1 |
8.84 |
0.47 |
Mildly wet | Increasing | Reliable |
| 1983-1992 |
185.52 |
5.78 |
0.1 |
Mildly wet | Increasing | Reliable |
| 1993-2002 |
181.51 |
8.05 |
-0.03 |
Mild dryness | Decreasing | Reliable |
| 2003-2012 |
169.62 |
13.49 |
-0.44 |
Mild dryness | Decreasing | Reliable |
| 2013-2019 |
141 |
29.04 |
-1.42 |
Severe dryness | Decreasing | Unreliable |
| Mean |
180.445 |
15.96 |
-0.07 |
Mild dryness | Decreasing | Reliable |
MAR: Mean Annual Rainfall, CV: Coefficient of Variation
Rainfall was reliable from 1963 to 2012. Since 2013, dry episodes have been recurrent with a mean SPI of -1.42 and an unreliable CV of 29.04%. These characteristics show that rainfall has been deficient, thereby resulting to water scarcity. In all, the 1963-2019 period was characterised by 1 episode of extreme wet conditions (1969), 2 severely wet (1963, 2003), 5 moderately wet (1964, 1966, 1968, 1970, 1979), 23 mildly wet (1965, 1967, 1974, 1975, 1976, 1977, 1978, 1980, 1981, 1982, 1984, 1985,1986, 1989, 1990, 1991, 1992, 1993, 1995, 1999, 2004, 2006, 2011), 16 mild dryness (1971, 1972, 1983, 1987, 1988, 1994, 1996, 1997, 1998, 2000, 2001, 2002, 2003, 2005, 2010, 2012), 4 moderate dryness (1973, 2007, 2009, 2015), 3 severe dryness (2008, 2018, 2019) and 3 extreme dryness (2014, 2016, 2017) (Figure 11).
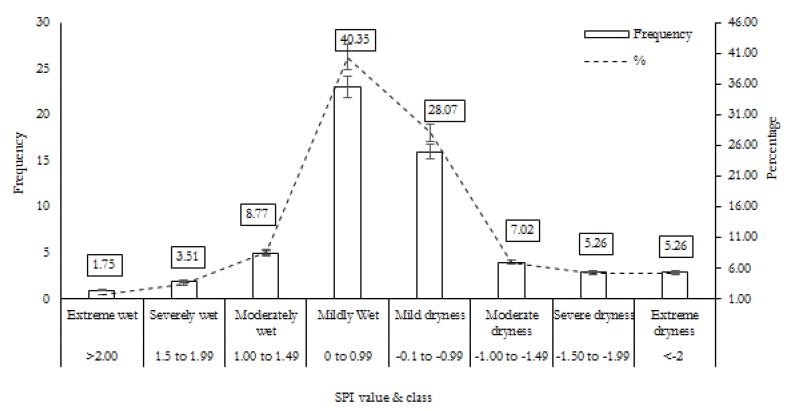
Figure 11: Standardized Precipitation frequency
The overall mean SPI for the period under study is -0.07 (mild dryness) and a mean CV of 15.96% (reliable). It is worth noting that all the classes of SPI have been recorded in Bamenda from 1963-2019, distributed as: extreme wet, 1 (1.75%), severely wet, 2 (3.51%), moderately wet, 5 (8.77%), mildly wet, 23 (40.35%), mild dryness, 16 (28.07%), moderate dryness, 4 (7.02%), severe dryness, 3 (5.26%) and extreme dryness, 3(5.26%). Although the study period had more wet episodes than dry incidents, rainfall has continued reducing since 2014.
Discussion
Precipitation is projected to decrease over the tropics and sub-tropics (Inter-governmental Panel on Climate Change-IPCC, 2021) [14] as indicated by the rainfall trend in Bamenda that has decreased by 2.07 mm from 1963-2019 [9]. Several climatic indices have been developed from simple indices such as percentage of normal precipitation and precipitation percentiles to more complicated indices such as the Palmer Drought Severity Index (PDSI) (World Meteorological Organization (2012). Precipitation is the only required input parameter for the SPI. It is effective in analyzing wet and dry cycles with changes in latitude. It is more likely that data sets would only have 90% or even 85% complete records. Many users of SPI do not have this luxury and may have to settle for less (75-85% complete data sets) unless they look for estimation techniques to fill in the gaps in the record. Long and pristine data records are neither practical nor typical in many cases, so the user needs to be aware of the statistical shortcomings of extreme events when dealing with shorter periods of records for various locations [15]. Depending on the confidence and method of calculation, the use of estimated data is acceptable to show climate variability and change. Naturally, the fewer estimated data used the more reliable the results (World Meteorological Organization, 2012). The SPI is a good indicator of precipitation change over time. Its flexibility permits precipitation change to be calculated over different time scales like 3-, 6-, 12-, 24- and 48-months. Rainfall deficits assessment using SPI are recorded within a threshold of zero because a drought sets in when SPI values fall below the zero thresholds. The climate of Bamenda broadly falls under tropical climates per the Köppen classification (Aw tropical savannah climate). Tropics show seasonal precipitation changes [16,17] due to the influence of continentality (Rohli and Vega, 2018). Assuming that all other factors are equal, the interiors of continents like Bamenda have severe dry seasons due to their long distance from the sea [17]. In addition, the onset of the wet seasons is delayed significantly over continents due to the overriding effect of harmattan winds [2]. The Aw climatic regime is directly influenced by the Inter-Tropical Convergence Zone (ITCZ). The dominant prevailing winds during the wet season are the warm-moist SE from the Atlantic Ocean that pushes the ITCZ northwards with the onset of the wet season. As a zone of convergence of SE and NE trade winds, tropical rainfall is largely influenced by the position of the ITCZ. From late October to November, the NE trade winds have a dominating influence and the ITCZ is pushed to the south so that dry weather conditions prevail because of harmattan. From March to April, the SE trade winds have an urge over the NE trade winds, such that the ITCZ is gradually moved northwards, announcing the start of the wet season [2,6,12,18,19].
Conclusion
A 12-month SPI time series analysis showed that rainfall has been decreasing in Bamenda from 1963-2019, with 45.6% of dry episodes. These include 16 episodes of mild dryness (28.07%), 4 periods moderate dryness (7.02%), 3 events of severe dryness (5.26%) and 3 incidents of extreme dryness (5.26%). Rainfall deficits have been recorded since 2014. Inter-annual rainfall is not always a good measure of rainfall variability, because decreasing rainfall can still be reliable while increasing rainfall can be unreliable. That is why the inter-annual CV for Bamenda is 15.96%, (reliable). The overall SPI from 1963-2019 is -0.17 (mildly dryness), while rainfall has decreased by 2.07 mm. The characteristics show that Bamenda is getting drier, although rainfall is still reliable. Spatio-temporal variations of SPI have implications for agriculture, water resources and other aspects of the man-environment relationship such as subsistence agriculture and other agro-pastoral ventures. Water resources occur mostly in perched aquifers of volcanic origin and are recharged by seasonal rainfall. The Bamenda highlands have suffered severe highland montane forest loss as a result of deforestation for subsistence agriculture, settlement and the conversion of patches of natural vegetation into eucalyptus plantations. As such, the population must engage in water-saving activities as an adaptation to rainfall deficits.
References
- Ayoade JO (1998) Introduction to Climatology for the Tropics. Fourth edition, Spectrum Books Ltd., Ibadan, pg: 125-139.
- Ahrens CD, Henson R (2019) Meteorology Today: An Introduction to Weather, Climate and the Environment, Twelfth Edition. Cengage Learning, New York pg: 479-486.
- Strangeways I (2006) Precipitation: Theory, Measurement and Distribution. Cambridge University Press, Cambridge, pg: 1-15.
- World Meteorological Organization (2008) Guide to Meteorological Instruments and: Methods of Observation. Seventh edition, Geneva, WMO, 8: 5-16.
- World Meteorological Organization (2011) Guide to Climatological Practices. WMO (100) Geneva pg: 6-19.
- Barry RG, Chorley RJ (2003) Atmosphere, Weather and Climate, Eighth Edition: Routledge, Taylor and Francis Group, London pg: 262-230.
- Ngakfumbe SN (2001) Rainfall Probability and Reliability: The case of Cameroon: Readings in Geography, Unique Printers, Bamenda pg: 156-175.
- Molua EL, Lambi CM (2006) Climate, Hydrology and Water Resources in Cameroon. CEEPA Discussion Papers, Special Series on Climate and Agriculture in Africa, Centre for Environment and Policy in Africa, University of Pretoria pg: 1-37.
- Tume SJP (2019) Standardized Precipitation Valuation of Water Resources Vulnerability to Climate Variability on the Bui Plateau, Northwest Cameroon. Environment and Ecology Researc, 7: 83-92.
- Tume SJP (2021a) Impact of Climate Change on Domestic Water Accessibility in: Bamenda III Sub-Division, North West Region, Cameroon. Journal of the Cameroon Academy of Sciences 17: 131-145.
- Tume SJP (2021b) Rainfall Seasonality and Standardized Precipitation Valuation of: Water: Resources Susceptibility to Climate Variability on the Bui Plateau, Northwest Region, Cameroon. Advances in Hydrology & Meteorology 1: 1-20.
- McKee TB, Doesken NJ, Kleist J (1993) The Relationship of Drought Frequency and Duration to Time Scales. Proceedings of the Eighth Conference on Applied Climatology. American Meteorological Society Boston 179-184.
- World Meteorological Organization (2012) Standardized Precipitation Index User Guide. WMO (1090) Geneva, 50.
- Intergovernmental Panel on Climate Change-IPCC, (2021) Summary for Policymakers. In: Climate Change 2021: The Physical Science Basis. Contribution of Working Group I to the Sixth Assessment Report of the Intergovernmental Panel on Climate Change. Cambridge University Press, 41.
- Guttman NB (1999) Accepting the Standardized Precipitation Index: A Calculation: Algorithm. Journal of the American Water Resources Association 35: 311-322.
- Patt AG, Winkler J (2007) Applying Climate Information in Africa: An Assessment of Current Knowledge. University of Boston, 19.
- Rohli RV, Vega AJ (2018) Climatology, Fourth Edition. Jones and Bartlett Learning, Wall Street, Burlington, 25-33.
- Strahler A (2013) Introducing Physical Geography, Sixth Edition. John Wiley and Sons, London pg: 235-239.
- Dashew S, Dashew L (1999) Mariner’s Weather Handbook: A Guide to Forecasting and Tactics. First edition, Beowulf, Inc., Tucson, Arizona pg: 35-53.