DOI: 10.31038/AFS.2021353
Abstract
Physico-chemical parameters, mollusc distribution and diversity in Shiroro Lake, Minna, Niger State was investigated between the months of March and August, 2017 spanning through the wet and dry seasons. Water samples for physico-chemical parameters and snails samples were collected and identified on monthly basis following standard methods. From the results; the temperature ranged from 26.5-32°C. The pH was all basic throughout the period of the study which ranged from 8.5-9.2 across all the stations. Dissolved Oxygen concentration ranged from 2.6-5.2 mg/L, while the BOD ranged from 2.2-4.9 mg/L. Nitrate level (0.43-0.83 mg/L) was high, while phosphate concentration (0.24-0.42 mg/L) was relatively low in all the sampling stations. A total number of 7 snail species were encountered. Station 3 had the highest number (403), station 2 with 363 species and station 1 had the lowest with 345 species. The family Viviparidae and Bithyniidae has 2 species each. The Bellamya phthinotropis has the highest number of species followed by Bellamya capillata; and the lowest was recorded among the species of Gebtella barthi. In general, the abundance of snails was higher during the rainy season than during the dry season. Taxa richness determined as Margalef index showed significant difference among the sampling stations. Similarly, diversity indices (Shannon Wiener, Simpson, dominance) also showed significant difference among the sampling stations. Lower values of diversity and Eveness indices were recorded at station 1. Station 2 had the highest record of diversity and eveness indices. Shiroro Lake is moderately organically polluted and adequate measures should be taken to check-mate this.
Keywords
Shiroro Lake, Physico-chemical parameters, Molluscs, Pollution and water quality
Introduction
Seasonal variations, pollution and its effects have over the years influenced the chemical contents of water and the survival of biotas in the aquatic environment. This is why it is difficult to understand the biological phenomenon fully because the chemistry of water levels tells much about the metabolism of the ecosystem and explains the general hydro-biological relationship (Basavaraja et al., 2011). Due to the pressures of increasing population and developing economy all over the world, the present situation of water quality management is far from satisfactory (Sawaya et al., 2003). Organic pollution is rampant in municipal water bodies posing health hazards to the neighbouring communities. Also, faecal pollution of drinking water causes water borne disease which has led to the death of millions of people [1]. The quality of drinking water is a complex issue and vital elements of public health. Poor water quality is responsible for the death of an estimated few million children annually (Holgate, 2000). The interaction of physical and chemical properties of water have a significant role in the composition, distribution and abundance of aquatic organisms which are therefore, used to determine the water quality and structural composition of aquatic community (Youne et al., 2003). Some of the major physico-chemical parameters that indicate water quality are the dissolved oxygen (DO) and biological oxygen demand (BOD). The dissolved oxygen is important in the natural self-purification capacity of the river; and the BOD is often used as a measurement of pollutants in natural and waste waters and to assess the strength of waste, such as sewage and industrial effluent waters [2]. BOD is an important parameter of water indicating the health scenario of freshwater bodies [3].
Gastropods are single-valve, soft-bodied class of animals in the phylum Mollusca. It is the largest, extremely diverse taxa that includes over 40,000 species of which 5,000 are fresh water snails found in wetlands like lakes, ponds and streams worldwide. Freshwater snails are an important food source for many fish, turtles, and other species of wildlife. As a result of their sensitivity to certain chemicals, many species are excellent water-quality indicators. Over the years, conservation and recovery efforts for freshwater snails include artificial culture or heliculture, water pollution control, and most importantly, habitat protection and restoration. Cleaning waterways not only improves the habitat for snails and other aquatic life, but it also improves the quality and supply of water for human consumption. Dam construction and other channel modifications, siltation, and industrial and agricultural pollution have all degraded the river habitats on which most species depend. As a result, the species richness and the abundance of freshwater snails have declined. Likewise, anthropogenic activities around the reservoir are on the increase, further compounding the problems and effects of pollution on the biota living within the aquatic habitat.
Shiroro Lake was constructed for domestic consumption within the Shiroro Local Government Area of Niger State and its environment. But there is little or no information about the snail’s distribution, diversity, and some selected physico-chemical parameters. This present research would serve as baseline information on the distribution, diversity of snails and changes in some physico-chemical parameters of the lake.
Materials and Methods
Description of the Study Area
Shiroro Lake was created with major objective of providing domestic water to Shiroro Local Government and its environment; however, fishing and irrigation have become other established uses of the reservoir. The area has a tropical climate with mean annual temperature, relative humidity and rainfall. The climate presents two distinct seasons: a rainy season and a dry season. The vegetation in the area is typically grass dominated savanna with scattered trees. The people are mostly engaged in agriculture, trading, artisanship and civil service for their living. Shiroro Lake was created in May, 1984 by damming the Kaduna River at Shiroro village, Niger State, Nigeria. Its coordinate is: Latitude 9.9724, Longitude 6.83532. The reservoir has an estimated surface area of 312 km2 and a mean depth of 22.4 meters and continues to grow. It is now the second largest man-made lake in Nigeria followed by Jebba. The Shiroro Lake, like most other large man-made lakes in Nigeria and throughout the tropics, was expected to provide favourable conditions for large scale fish production and fishery development in Nigeria.
Water Sampling
Monthly sampling of the three study stations were carried-out from March to August, 2017 during the period of wet and dry seasons. Water samples were collected using 1 L plastic container from three sampling sites and transported to the Laboratory of the Department of Water, Aquaculture and Fishery Technology (WAFT), Federal University of Technology, Minna. Parameters like temperature, total dissolved solid, dissolved oxygen, pH and electrical conductivity were measured immediately from the sampling sites (Figure 1).
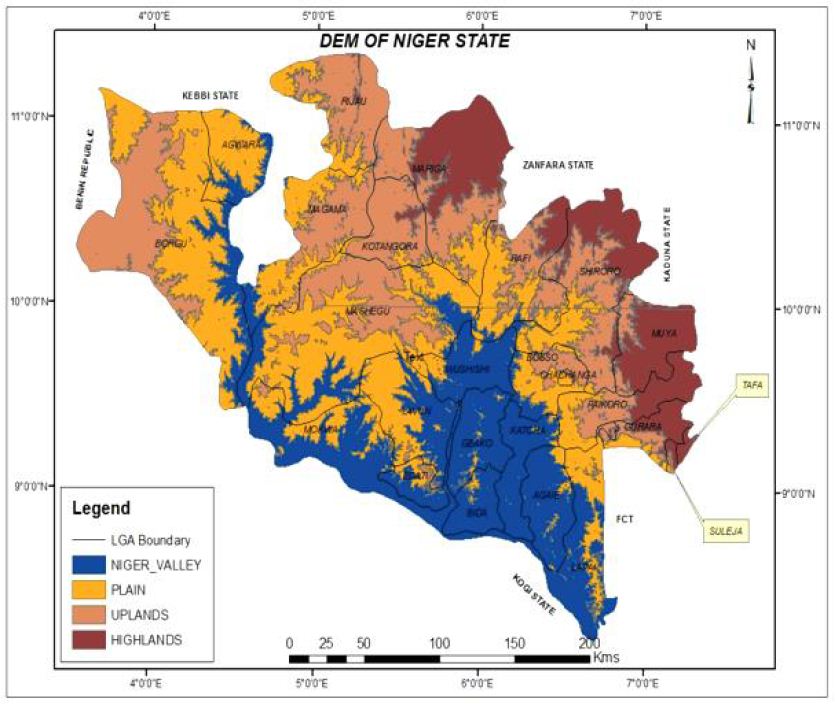
Figure 1: Map of the sampling stations of the Shiroro Lake, Niger State, Nigeria.
Snails Collection
Snails were collected from the study areas in the three sampling sites with the use of scoop net. Collected snails were transferred to a 1 L well labeled sample bottle with a cork and was preserved in 10% formalin. The samples were taken to the laboratory, viewed with the hand lens and subsequently identified using modified keys as described by [4] and pictorial diagrams.
Physico-chemical Parameters Analyses
Water Temperature
Water temperature at various sites were determined using mercury-in-glass thermometer which was immersed in water 6 cm below the water surface and left to stabilize for about two-five minutes before the readings were taken and recorded in °C.
DO, BOD, TDS, pH and EC Determination
Dissolved oxygen was determined with Hanna instrument (Hanna microprocessor pH /EC/TDS, P.R. (1970). This was done in duplicate for each site and each month of the sampling periods. The BOD was also determined using Hanna instrument after the samples had been incubated in the dark at laboratory temperature for five days. These were measured in mg/L. The Total Dissolved Solids (TDS in mg/L) and Electrical Conductivity (EC in µS/cm) were determined by the same instrument after rinsing in distilled water each time. The probe meter was standardized with buffer solutions of pH 4.0, 7.0, 9.0 before taking the reading for the pH in each station.
Sodium
Stock sodium was prepared by measuring 2.542 g of dried NaCl which was then diluted with a litre of distilled water. Intermediate sodium solution was prepared from stock solution by diluting 10 ml of stock solution with 100 ml distilled water. Standard sodium solution was then prepared from the intermediate sodium solution by diluting 10 ml of intermediate sodium solution with 100 ml distilled water. This was then used to prepare various concentrations in the range of 0.1 to 1.0 mg/L. The emission of these various concentrations was determined with a flame photometer at 589 nm. The Na content of the water sample was determined by measuring their emission with the flame photometer.
Potassium
Stock solution was prepared by dissolving 1.907 g of dried KCl crystal in distilled water which was then made up to 1 litre. Intermediate potassium solution was prepared by diluting 10 ml of stock potassium solution with 100 ml distilled water. Standard potassium solution was prepared by mixing 10 ml of intermediate potassium with 100 ml distilled water. Various concentrations in the range of 0.1 to 1.0 mg/L were prepared from the standard and were measured with flame photometer at 768 nm.
Nitrate
The nitrate concentration in the sampled water was determined using phenol disulphonic acid method. This method was carried out using spectrophotometer, laboratory glassware, hot water bath and reagents. Phenol disulphonic acid; 25 g of white phenol was dissolved in 150 ml (concentrated) and 85 ml of concentrated sulphuric acid was further added. The solution was heated until it dried out. 25 ml of water sample was placed in a porcelain basin and was evaporated to dryness on a hot water bath. 0.5 ml of phenol disulphonic acid (reagent 1) was then added to the residue and stirred with glass spatula. 5 ml of distilled water was added and 1.5 ml of potassium hydroxide solution (reagent 2) was also added. The mixture was thoroughly stirred by mixing. It turned yellow indicating the presence of Nitrate. The absorbance was read using spectrophotometer at 410 nm [5].
Phosphate
The concentration of phosphate in the water sample was determined by placing 25 ml of water sample in an Erlenmeyer flask and evaporated to dryness. The residue was cooled and dissolved in 1 ml of 70% perchloric acid (reagent 1). The flask was heated gently until the contents became colourless. It was cooled and 10 ml of distilled water was added together with 2 drops of Phenolphtalein indicator (reagent 2)_ this was prepared from 1.0 g of phenolphthalein dissolved in 100 ml of ethyl alcohol and 100 ml of distilled water. The above was titrated against sodium hydroxide solution (reagent 3) which was prepared by dissolving 4.0 g of the sodium hydroxide in 100 ml distilled water until there was an appearance of a slight pink colour. Volume was made up to 25 ml by adding distilled water; 1 ml of ammonium molybdate solution was added (reagent 4 made from 62 ml concentrated sulphuric acid and 80 ml distilled water and allowed to cool. 5 g of ammonium molybdate was then dissolved separately in 35 ml of distilled water and mixed with the sulphuric acid solution to 200 ml). 3 drops of stannous chloride solution (reagent 5_this was made from 0.5 g stannous chloride and dissolved in 2 ml hydrochloric acid and then, diluted to 20 ml with distilled water and used fresh). A blue colour indicates the presence of phosphate. The absorbance was recorded on spectrophotometer 690 nm after 10 minutes.
Data Analysis
One way Analysis of Variance (ANOVA) was used to determine the monthly variations in physico-chemical parameters using SPSS IBM (Version 20 for window) statistical package at P<0.05 level of significance. Taxa richness (Margalef and Menhnick indices), Diversity (Shannon and Simpson dominance indices), Eveness indices and Huctchenson T-test for inter-site comparison were determined using the computer basic programme SP DIVERS.
Results and Discussions
Monthly Variation in Physico-chemical Parameters of the Sampling Stations of Shiroro Lake, Minna Niger State
Water Temperature
The highest water temperature was recorded in station 1 with 30.5°C in the month of May and the lowest was recorded at station 1 in the month of August (Table 1).
DO. The highest dissolved oxygen was recorded in station 1 with 5.4 mg/L in the month of March and the lowest was recorded at station 2 in the month of August (Table 1).
BOD. The highest BOD was recorded at station 1 with 5.2 mg/L in the month of March and the lowest was recorded at station 2 in the month of August (Table 1).
TDS. The highest TDS was recorded in station 1 with 108 mg/L in the month of June and the lowest was recorded at stations 2 and 3 in the month of August (Table 1).
pH. The highest pH was recorded in station 1 with 10 in the month of March and the lowest was recorded at station 3 in the month of August (Table 1).
Electrical Conductivity. The Electrical conductivity for the three stations was the same through-out except for the Electrical conductivity of station 1 which increased slightly from 0.03 to 0.04 µS/cm in June (Table 1).
Sodium. The highest Sodium concentration was recorded in station 1 with 8.83 mg/L in the month of July and the lowest was also recorded at station 1 in the month of May (Table 1).
Potassium. The highest potassium concentration was recorded in station 3 with 4.11 mg/L in the month of March and the lowest was recorded at station 2 in the month of April (Table 1).
NO3. The highest Nitrate concentration was recorded in station 3 with 0.83 mg/L in the month of July and the lowest was recorded at station 2 in the month of March (Table 1).
PO4. The highest phosphate concentration was recorded in station 3 with 4.11 mg/L in the month of March and the lowest was recorded at station 2 in the month of April (Table 1).
Table 1: Summary of the physico- chemical parameters of the study stations in Shiroro Lake, Niger State from March to August, 2017. The highest and lowest values obtained during the sampling periods are indicated in parenthesis.
|
Parameter |
Station 1 | Station 2 |
Station 3 |
| Temperature (0C) |
28.1 ± 5.21(26.5-30.5) |
27.9 ± 0.54 (26.7-29.4) |
29.32 ± 0.95 (27-32) |
| pH |
9.04 ± 0.04 (8.9-9.1) |
8.8 ± 0.09 (8.6-9.0) |
8.84 ± 0.11 (8.5-9.2) |
| Conductivity (µS/cm) |
0.03 ± 0.02(0.03-0.04) |
0.03 ± 0.00 (0.03-0.03) |
0.03 ± 0.00 (0.03-0.03) |
| TDS (mg/L) |
87.8 ± 5.21(79-108) |
83.8 ± 3.10 (76-95) |
83.4 ± 2.84 (76-91) |
| Dissolve Oxygen (mg/L) |
3.95 ± 0.37 (3.0-5.2) |
3.62 ± 0.37(2.6-4.8) |
3.92 ± 0.36 (2.7-4.9) |
| Biological Oxygen Demand (mg/L) |
3.26 ± 0.37(2.7-4.9) |
3.00 ± 0.39 (2.2-4.5) |
3.60 ± 0.34 (2.4-4.5) |
| Sodium (mg/L) |
6.45 ± 0.85 (4.4-8.8) |
6.85 ± 0.68 (4.5-6.6) |
6.85 ± 0.49 (5.9-8.5) |
| Potassium (mg/L) |
1.77 ± 0.15 (1.36-2.2) |
1.72 ± 0.17 (1.26-2.16) |
|
| Phosphate (mg/L) |
0.34 ± 0.03(0.26-0.42) |
0.33 ± 0.02 (0.24-0.38) |
0.31 ± 0.02 (0.27-0.36) |
| Nitrate (mg/L) |
0.56 ± 0.06(0.43-0.73) |
0.51 ± 0.05 (0.42-0.64) |
0.58 ± 0.07 (0.45-0.83) |
Abundance and diversity of snail species collected from Shiroro Lake. Total number of 7 species of snails was encountered during the study period. 2 species of Melanoides polymorpha were found in stations 2 and 3 but none in station 1. Ballamya phthinotropis was the major species with relative aboundance of 413 species (37%) followed by Ballamya capillata with 346 species (31%), Afrogyrus rodriguezensis with the total number of 178 species (16%) and Melanoides polymorpha with the lowest number of species (0.4%) (Table 2). Shannon index and Eveness index analyses showed that there were significant differences (P< 0.05) among the stations (Table 3).
Table 2: Spatial variations in snail species collected from Shiroro Lake, Niger State from March to August, 2017.
|
Species |
Station 1 | Station 2 | Station 3 | Species Total |
% |
| Ballamya phthinotropis |
154 |
108 | 151 | 413 |
37% |
| Ballamya capillata |
106 |
128 | 112 | 346 |
31% |
| Lanitus intortus |
43 |
33 | 63 | 139 |
12% |
| Afrogyrus rodriguezensis |
42 |
83 | 53 | 178 |
16% |
| Sierraia leonensis |
2 |
3 | 2 | 7 |
0.6% |
| Gabtella barthi |
8 |
6 | 20 | 34 |
3% |
| Melanoidees polymorpha |
0 |
2 | 2 | 4 |
0.4% |
Table 3: Taxa richness, Diversity, Eveness and Dominance Indices of Snail species collected from Shiroro Lake, Niger State from March to August, 2017.
| Station 1 | Station 2 |
Station 3 |
|
| Taxa_S |
17 |
23 |
19 |
| Individuals |
355 |
363 |
403 |
| Dominance_ D |
0.2352 |
0.1415 |
0.1156 |
| Simpson_1-D |
0.7648 |
0.8585 |
.8844 |
| Shannon_H |
1.918 |
2.377 |
2.45 |
| Eveness_e^H/S |
0.4003 |
0.4682 |
0.6101 |
| Margalef |
2.725 |
3.732 |
3.001 |
Taxa-S, Dominance_ D, Simpson_1-D, Shannon_H and Eveness_e^H/S stand for Taxa richness, Dominance Diversity, Simpson indices, Shannon indices and Eveness indices respectively.
Discussion
During the dry season the water temperature recorded was high in March, April, and May, 2017. This may be due to the increase in solar radiation (which is a usual phenomenon during dry season) during the period of the study. The mean water temperature obtained in this study was typical of tropical inland fresh water and river. This is in line with the findings of [6]. This is also in agreement with the studies of [7], [8] and [9] who also recorded high temperatures during the dry season. In addition, the relatively low temperature recorded in the months of June, July, August, 2017 may be due to the onset of the raining season and increasing water volume. This finding is also in agreement with the reports of [7] and [8].
The mean dissolved oxygen values obtained during the period of the study for the stations were low. The low level of DO probably indicated polluted nature of the water body. Similar low level of DO was reported in Dal Lake, Kashmir [10]. Monthly variations in DO for all the three stations were fluctuating. This fluctuation in the levels of DO could be as a result of differential influx of pollutants as run-offs from the neighbouring communities. It could also be due to rainfall regime pattern.
The BOD values indicate the extent of organic pollution in the aquatic system which affects the water quality [10]. Based on the BOD classification of [5], the mean BOD values in station 1 was high (2.7 mg/L), while stations 2 and 3 were low (2.4 mg/L) and (2.2 mg/L), respectively compared to that of station 1. The fluctuations in the BOD of each station and month probably indicate that the water in these stations was moderately polluted. This may be due to anthropogenic activities around the lake and the presence of the market at the lake side which may have led to organic pollution.
The monthly variations in Nitrate level were relatively high in all the sampling stations with the highest value of 0.83 mg/L in the month of July. Slightly higher range of values was reported in the studies of [12] in Bahir Dar Gulf of lake Tana, Ethiopia and [13] in a perturbed Tropical Stream in the Niger Delta, Nigeria; and [9] in River Galma, Zaria with 0.92-4.18 mg/L, 0.22-2.87 mg/L, 0.03 ± 0.0-1.11 ± 0.04 mg/L, respectively). Furthermore, the mean phosphate concentration ranged from 0.24-0.42 mg/L. This is higher than the mean values of 0.01 ± 0.01-0.20 ± 0.01 mg/L reported by [9]. Lower levels of phosphates, sulphates, nitrates indicate low level of organic pollution. The highest sodium content was recorded in July with 8.83 mg/L. This is probably because the most common source of elevated sodium levels in the lake water are: erosion of salt deposit and sodium bearing rock minerals, infiltration of surface water contaminated by road salt, irrigation and precipitation of leachate from landfill or industrial sites [14]. And during the rainy season there was influx of run-offs from the surrounding environment into the water body.
The EC in this research was very low (0.03 μs/cm) and would probably not pose any threat to the biota of the lake. The FEPA acceptable limit for conductivity in domestic water supply is 70 μs/cm [15]. Higher values were recorded from the same study site by [16]. This is also in contrast to the findings of [9] who reported a range mean value of 69.20 ± 3.12-157.80 ± 24.69 μS/cm in River Galma, Zaria. Likewise, the TDS are very low in comparison with previous studies. This may have arisen from improved maintenance of the lake.
The snail species in Shiroro Lake is highly diverse with Bellamya phthinotropis dominating the Shiroro Lake. The numerical density and species richness of snails were higher in the raining season than in the dry season. The snail species may have responded to changes in the water quality parameters as it was observed in changes in composition of species assemblage and abundance in the various sites. They may also have came out of their hiding places since there are now increased vegetation cover that could portend improved feeding and fertile ground for reproduction. Similar studies by [17] reported 29.06% relative abundance of mollusc in Obazuwa Lake, Benin city and attributed the abundance of the molluscs and oligochaetes in all the stations to the non-occurrence of habitat restriction in the study areas.
Conclusions and Recommendations
Anthropogenic activities and changes in season influenced the environmental conditions of the Shiroro Lake, thus affecting the snail species composition in each station. Overall results showed that changes in water quality of the Lake have significant effects on the structure, abundance and diversity of the snail species that were found. Station 3 had the highest number (403), station 2 with 363 species and station 3 had the lowest with 345 species. The family Viviparidae and Bithyniidae has 2 species each, the Bellamya phthinotropis has the highest number of individual species followed by Bellamya capillata and the lowest was recorded among the species of Gebtella barthi. In general the abundance of Snail was higher during the rainy season than during the dry season.
The highest DO was observed in the month of March with 5.4 mg/L, the highest Electrical conductivity was observed in the month of April with 0.4 (µS/cm), the highest TDS was observed in the month of April with 108 mg/L, the highest BOD was observed in the month of March with 5.2 mg/L. The variations in the phosphate, nitrates, sodium and potassium indicate that Shiroro Lake is organically polluted but do not pose any serious danger to the survival and adaptation of the biota.
More care should be taken to minimize the entry of pollutants into the water body so that the snails species and other biota of the Lake observed in this water body can be conserved.
References
- Adefemi SO, Awokunmi EE (2010) Determination of physico-chemical parameters and heavy metals in water samples from Itaogbolu area of Ondo-State, Nigeria. African Journal of Environmental Science and Technology 4: 145-148.
- Zeb BS, Malik AH, Waseem A, Mahmood Q (2011) Water quality assessment of Siran River, Pakistan. International Journal of Physical Sciences 6: 7789-7798.
- Bhatti MT, Latif M (2011) Assessment of water quality of a river using an indexing approach during the low-flow season. Irrigation Drainage 60: 103-114.
- Brown DS (2005) Freshwater snails of Africa and their medical importance. 3rd edn. London: Taylor and Francis e-Library 12-41.
- American Public Health Association (APHA) (2005) Standard Methods for the Examination of Water and Waste Waters. 20th edn. Washington DC 1134.
- Arimoro FO, Iwegbue CMA, Osiobe O (2008) Effects of industrial Waste Water on the physical and chemical characteristics of Warri River, a coastal water in the Niger Delta, Nigeria. Research Journal of Environmental Science 2: 209-220.
- Ezra AG (2000) Planktonic Algae in relation to the Physico chemical Properties of some Fresh Water Ponds in Bauchi, Nigeria. Nigeria Journal of Experimental and Applied Biology 1: 19-26.
- Ibrahim S (2009) A survey of zooplankton Diversity of Challawa River, Kano and Evaluation of some physic chemical condition. Bayero Journal of Applied Sciences 2: 19-2.
- Samuel PO, Adakole JA, Suleiman B (2015) Temporal and Spatial Physico-Chemical Parameters of River Galma, Zaria, Kaduna State, Nigeria. Resources and Environment 5: 110-123.
- Iqbal PJM, Pandit AK, Jaceel JA (2006) Impact of sewage waste from Human settlement om physic-chemical characteristics of Dal Lake, Kashmir. Journal of Research Development 6: 81-85.
- Jonnalagadda SB, Mhere G (2001) Water Quality of Odizi River in Eastern Highland of Zimbabwe. Water research 35: 2371-2376. [crossref]
- Imoobe TOT, Akoma AC (2008) Assessment of Zooplankton Communitiy Structure of the Bahir Dar gulf of Tana, Ethiopia. Journal of Environmental Studies and Management 1: 36-34.
- Arimoro FO, Oganah AO (2010) Zooplankton community response in a Perturbed Tropical Stream in the Niger Delta, Nigeria. The Open Environmental & Biological Monitoring Journal 3: 1-11.
- Butkus SN, Hermanson RE (2007) Washington State University Extension Sodium Content of your Drinking Water.
- DWAF (1996) South African Water Quality Guidelines. Domestic Uses. 2nd. Ed. Department of Water Affairs and Forestry, Pretoria 1.
- Kolo RJ, Oladimeji AA (2004) Water quality and some nutrient levels in Shiroro Lake Niger State. Nigeria. Journals of Aquatic Sciences 19: 99.
- Olomukoro JO, Oviojie EO (2015) Diversity and Distribution of Benthic Macroinvertebrate Fauna of Obazuwa Lake in Benin city, Nigeria. Journal of Biology, Agriculture and Health care 5: 94-100.