Abstract
Background: Traditional Ghanaian culture has held that the ideal body image for women favors a larger size as symbolic of wealth and status.
Objectives: This investigation evaluated the complex relationship between social and cultural variables and the body image perspectives of women and men residents of Cape Coast, Ghana in an attempt to provide a framework for assessing the diverse factors that influence body image.
Methods: An oral survey was administered by the investigators to 400 outpatients at the Regional Central Hospital. The survey included questions on body image; weight changes; media exposure; social and cultural influences on ideal image; food security; and select SF-36 questions.
Results: Both women and men selected an Ideal Body Image (IBI) figural silhouette that represented a size greater than a normal body mass index. Television was the most frequently identified source of media exposure and had the greatest influence on IBI. Some 21.1% of participants reported that their IBI was highly influenced by television, without a statistically significant difference between men and women. Women were significantly more likely to report being highly influenced by newspapers and magazines than men (18.3% versus 10.7%, p = 0.046). Women and men who were highly or moderately influenced by family opinions were significantly more likely to be dissatisfied with current body image than those not influenced by family (80.5% versus 64.8%, p = 0.017), (75.4% versus 48.0%, p = 0.001), respectively.
Conclusion: Social media exposure is common for the inhabitants of Cape Coast. Television was the most influential form of media on the body image. Social relationships were also an important determinant of body image dissatisfaction.
Keywords
Body Mass Index, Cultural Determinants, Current Body Image, Ghana, Ideal Body Image, Social Media
Financial Support: Scholars in Medicine Program, Harvard Medical School
Introduction
The influences on body image can be multifaceted and include social, cultural, media and relationship determinants. An understanding of such influences on women’s and men’s body image can assist health care providers to address the risks for noncommunicable illnesses such as hypertension and diabetes that are linked to an increased body mass index (BMI) as well as to introduce preventive measures or medical treatments 1,2].
One of the most broadly accepted theories of the determinants that influence body image is the sociocultural model, which suggests that standards of attractiveness set by Western society are unattainable for the vast majority of individuals, leading to a disparity between ideal and reality 3–8]. In a previous study assessing the ideal body image of women residing in Accra, Ghana and testing the hypothesis that the ‘traditional build’ is the ideal, the investigators instead found that the majority of women selected the IBI as one that represented a normal body mass index, and the least healthy image was that figure that represented morbidly obesity 2]. A direct relationship exists between media exposure and thin body size for women and body image dissatisfaction, with most finding a small-to-medium effect from media 9–12]. Studies focused exclusively on men have demonstrated a relationship between body image dissatisfaction and exposure to images of idealized bodies, many with a particular focus on the idea that exposure to images of enhanced male muscularity can modify male ideal body image [13–16]. Because body image and dissatisfaction appear to be highly specific to the cultural context in which they are developed, conclusions drawn in Westernized countries should not be applied directly to other countries or even across ethnic and racial lines [17, 18]. Studies in both developing and developed countries have documented body image dissatisfaction in various degrees across cultures and have confirmed the association of exposure to media images of so-called western ideals of attractiveness with such dissatisfaction [19]. This investigation evaluated the complex relationship between social and cultural variables and the body image perspectives of residents of Cape Coast, Ghana, a medium sized regional capital city [20].
Material and Methods
Study setting and population
The study was conducted at the Central Regional Hospital (now Cape Coast Teaching Hospital) in Cape Coast, Ghana, the capital of the Central Region of Ghana. The metropolis covers an area of about 122 square kilometers with a population of approximately 170.000. The Central Regional Hospital in Cape Coast serves as the main referral center for both primary and secondary healthcare facilities within the Central Region. The 400-bed hospital serves the residents within the Cape Coast municipality [21]. The study population included participants attending the Out-Patient Department (OPD) between June and July 2012. English-speaking Ghanaian men and women 18 years or older were approached as they entered the waiting area of the OPD. English is the official language of Ghana, and many regional languages exist in spoken form. Exclusion criteria included age less than 18 years, pregnancy or lactation status, residence outside the metropolis and inability to communicate sufficiently in English to complete the survey. Few patients approached ( < 5%) declined the survey or were consider ineligible because of language restrictions.
Survey
Participants were asked to complete survey administered by the investigators comprised of the following components: demographic information; exposure and impact of media and cultural influences including television, radio, print materials, billboards, Internet cell phones, family, spouse, friends and religion; food access and select questions from the Medical Outcome Short Study Form-36 [22–25]. Each participant was provided with a card indicating their personal measurements, their BMI and waist/hip ratio, and an explanation of each measurement (underweight, normal, overweight, obese) as a token of appreciation of their participation.
Figural Stimuli
Culturally appropriate figural stimuli for men and women were created based upon the mean height and weights obtained from the Women’s Health Study of Accra from 2003 [1]. Twenty-five individual silhouettes were created ranging from a representation of underweight figures to morbidly obese figures, uniformly changing in size by 10% increments (Figure 1, 2). Silhouette 8 represents the middle of the normal body mass index range. Participants were presented with two printed posters depicting images of men and women and asked to identify, by number, the figure that most closely matched their current body image (CBI), that of their spouse/partner, as well as an ideal body image (IBI) for self, spouse/partner, and Ghanaian men and women in general.
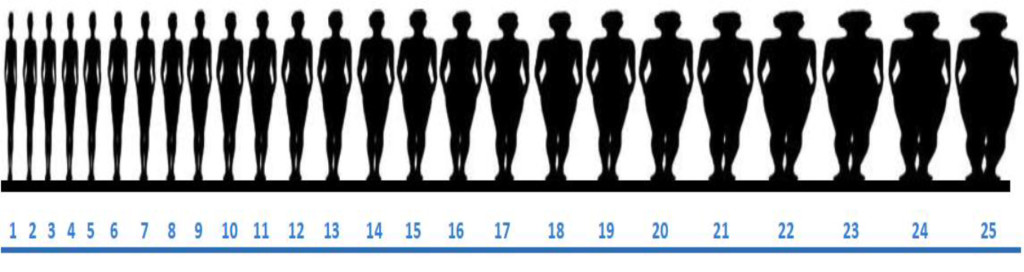
Figure 1. Figural stimuli silhouettes – Women (Figure 8 represents the mid-range of a normal body mass index).
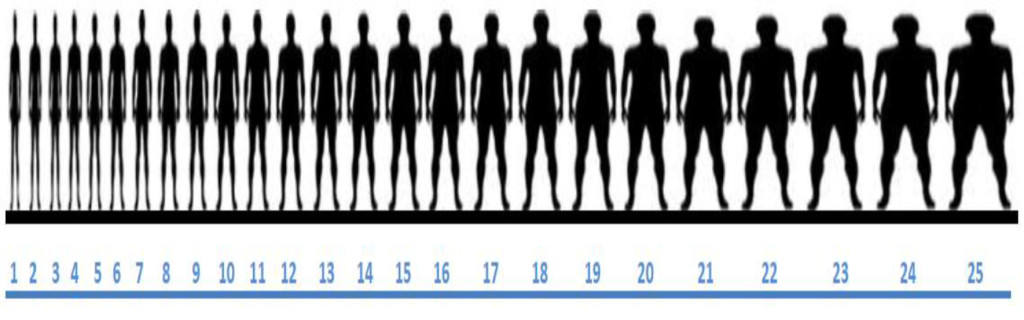
Figure 2. Figural stimuli silhouettes – Men (Figure 8 represents the mid-range of a normal body mass index).
Anthropomorphic Measures
Anthropometric measurements were taken with participants wearing light street clothes without shoes [2]. Height and weight were obtained and recorded to the nearest 0.1 centimeters and 0.1 kilograms, respectively, with a standing measuring stick and a calibrated, portable scale. Waist and hip measurements were collected to the nearest 0.5 centimeters with a flexible tape measure designed for body measurements. WHO STEPS protocols were followed, with the tape measure fitted snuggly, and with waist defined as the midpoint between the lower margin of the last palpable rib and the top of the iliac crest and hip defined as the widest portion of the buttocks [26].
Statistical Analysis
BMI was calculated for each participant and categorized according to WHO standards, with underweight ≤ 18.5, normal weight 18.6–24.9, overweight ≥ 25.0 and obese ≥ 30.0. A body image dissatisfaction score (DS) was calculated by subtracting the figure selected as the IBI for self from that selected as the CBI (DS = CBI – IBIself). Statistical analysis was performed using SPSS version 16.0 for Windows and included descriptive statistics for frequency and mean values Fisher’s Exact Test (FET) 1-sided, student T-test, chi-square test, Pearson correlation, binary logistic regression analysis and multinomial regression analysis.
Institutional Review Board Approval
The investigation was approved by the Institutional Review Boards at Harvard Medical School, Boston, MA, USA and the University of Cape Coast School of Medical Sciences, Cape Coast, Ghana. Verbal consent was considered sufficient for participation in the survey and an informed consent signature waiver obtained.
Results
Participant characteristics
A total of 400 patients agreed to participate in this study. There was an equivalent number of male and female participants (49% versus 51%) and no statistically significant difference between gender and mean age, highest level of education attained, marital status, religion, and environment of birth and current residence
(Table 1). Women, however, were two times more likely to be unemployed compared with men (14.2% versus 7.7%, p = 0.026 FET), univariate analysis Odds Ratio (OR) = 2.0, 95 CI % (1.03–3.90), p = 0.039. Responses to the Medical Outcome Short Study Form-36 revealed that most of the participants (81.7%) reported they were in good to excellent health, were in much or somewhat better health compared to last year (53.0%) and were somewhat to very happy at the time of survey (85.1%).
Table 1. Participant Characteristics.
|
|
Men n (%) |
Women n (%) |
p-value |
|
Participants |
196 (49) |
204 (51) |
NS |
|
Mean Age |
33.8 |
32.5 |
NS |
|
Highest Education level |
|
|
NS |
|
No Formal Education |
2 (1.0) |
7 (3.4) |
|
|
Primary |
5 (2.6) |
8 (3.9) |
|
|
Junior High (JSS) |
26 (13.3) |
25 (12.2) |
|
|
Senior High (SSS) |
81 (41.3) |
84 (41.0) |
|
|
Tertiary |
73 (37.2) |
75 (36.6) |
|
|
Graduate |
8 (4.1) |
6 (2.9) |
|
|
Relationship Status |
|
|
NS |
|
None |
62 (31.6) |
41 (19.8) |
|
|
Unmarried Relationship |
43 (21.9) |
71 (34.3) |
|
|
Married |
84 (42.9) |
70 (33.8) |
|
|
Divorced |
5 (2.6) |
13 (6.3) |
|
|
Widowed |
0 (0) |
12 (5.8) |
|
|
Employment Status |
|
|
0.026 |
|
Employed |
181 (92.3) |
175 (85.8) |
|
|
Not Employed |
15 (7.7) |
29 (14.2) |
|
|
Children |
|
|
NS |
|
None |
101 (51.5) |
109 (52.7) |
|
|
Religion |
|
|
NS |
|
Christian |
177 (90.3) |
189 (92.6) |
|
|
Muslim |
17 (8.7) |
12 (5.9) |
|
|
None/Other |
2 (1.0) |
3 (1.5) |
|
|
Environment, birth |
|
|
NS |
|
Urban |
98 (50.3) |
114 (56.2) |
|
|
Semiurban |
26 (13.3) |
22 (10.8) |
|
|
Rural |
71 (36.4) |
67 (33.0) |
|
|
Environment, current |
|
|
NS |
|
Urban |
59 (30.1) |
68 (33.3) |
|
|
Semiurban |
117 (59.7) |
120 (58.8) |
|
|
Rural |
19 (9.7) |
14 (6.9) |
|
|
NS = Not Significant |
|||
Body Mass Index
Height and weight measurements were available for all 400 participants. The distribution of BMI and gender are shown (Table 2). Obesity was identified significantly more often in women compared with men (20.1% versus 6.1%, p < 0.001), OR 1.6, 95% CI (1.25–1.96), p < 0.001.
Table 2. Body Mass Index by Gender.
|
Body Mass Index |
Men n (%) |
Women n (%) |
Overall n (%) |
|
Underweight |
10 (5.1) |
10 (4.9) |
20 (5.0) |
|
Normal Weight |
132 (67.3) |
92 (45.1) |
224 (56.0) |
|
Overweight |
42 (21.4) |
61 (29.9) |
103 (25.8) |
|
Obese |
12 (6.1) |
41( 20.1) |
53 (13.2) |
|
Mean |
23.3 |
25.9 |
24.6 |
|
Range |
16.9 – 38.1 |
14.7 – 45.6 |
14.7 – 45.6 |
Current Body Image
The most frequently selected CBI for women were figures 11, 13, and 14 (9.3% each), larger than the silhouette representing the middle range of a normal BMI. The mean ± standard deviation current body image (CBI) silhouette selected by women was figure 14.5 ± 4.5 (range 1 to 25). Only 8 women (3.9%) selected figure 8 (mid-range of normal BMI) as their CBI. There was a significant correlation (r = 0.727, p < 0.001) between BMI and CBI silhouette for women.
The most frequently selected CBI for men were figures 10, 12, 13, and 14 (9.2, 12.8, 14.8 and 11.2%, respectively), as found with the women, larger than the silhouette representing the middle range of BMI. Only 5 men (2.6%) selected figure 8 (mid-range of normal BMI) as their CBI. The mean ± standard deviation current body image (CBI) silhouette selected by men was figure 13 ± 3.7 (range 2 to 24). There was also a significant correlation between increasing CBI silhouette selected and increasing BMI for men (r = 0.603, p < 0.001).
Ideal Body Image for Women and Men
Both women and men selected a figure that represented a size larger than Silhouette 8, the middle of the normal body mass index range. The most frequently selected silhouette for women to represent their ideal body image (IBI) for themselves was figure number 14 (mean figure 13.6 + 3.6, range 1 – 25). The most frequently selected silhouette for IBI by men for themselves was figure number 13 (mean figure 13.8 + 3.6, range 2 – 25). There was also a significant correlation between BMI and IBI for both women and men. The Pearson correlation between BMI and IBI for women was (r = 0.260, p < 0.001) and between CBI and IBI for women was (r = 0.551, p < 0.001). The Pearson correlation between BMI and IBI was (r = 0.141, p = 0.049) and between CBI and IBI for men was (r = 0.596, p < 0.001).
Women and men most frequently selected figure 13 as the IBI for a spouse/significant (15.6% and 17.1%, respectively). The most frequently selected IBI for a Ghanaian woman in general by women was figure 14 (15.5%, range 7–25, r = 0.480, p < 0.001). Figure 15 (13.5%, range 2–23) was most commonly selected by men as the IBI for a Ghanaian woman. In comparison, women and men both selected figure 15 as the IBI for men (range 7 – 25 and 4 to 25, respectively). There was a significant correlation between a man’s IBI for himself and for a man in general (r = 0.553, p < 0.001).
Dissatisfaction Score
The dissatisfaction score (DS) was calculated by subtracting the IBI from the CBI for women and men. Less than one-third (32.6%) of participants had a DS = 0, indicating the CBI = IBI. There was no significant difference between women and men with a DS = 0 (29.4% versus 35.9%, OR 1.34, 95% CI (0.88, 2.0), p = 0.168) (Table 3). However, women were significantly more likely to select an IBI smaller than the CBI compared with men (42.2% versus 28.4%, OR 1.51, 95% CI 1.18–1.94, p = 0.001). On a multivariate analysis, the variables significantly associated with a DS = 0 included: children (any versus none), stable weight for the past year, anticipating a stable weight in the next year, being less likely to have been told as an adult to gain or lose weight, and being less likely to be influenced by spouse/partner (Table 4). In addition, 64.6% of participants with a DS = 0 had a normal BMI; however, for each BMI category, most participants were dissatisfied with CBI (p < 0.001) (Table 5).
Table 3. Dissatisfaction score = Current Body Image – Ideal Body Image by Gender.
|
Dissatisfaction |
Women (%) |
Men (%) |
Total (%) |
p-value |
|
CBI = IBI |
29.4 |
35.9 |
32.6 |
NS |
|
CBI < IBI |
28.4 |
42.1 |
35.1 |
NS |
|
CBI > IBI |
42.2 |
22.1 |
32.2 |
0.001 |
|
NS = Not Significant |
||||
Table 4. Variables significantly associated with Dissatisfaction Score (DS) = 0 on multivariate analysis.
|
Variable |
DS = 0 (%) |
DS = Any (%) |
OR |
95% CI |
p-value |
|
Children, any |
40.1 |
25.6 |
2.6 |
1.5, 4.1 |
< 0.001 |
|
Stable weight past year |
34.1 |
24.1 |
1.6 |
1.2, 2.3 |
0.003 |
|
Anticipate stable weight next year |
56.1 |
27.1 |
1.9 |
1.4, 2.5 |
< 0.001 |
|
Told to gain weight as an adult |
27.2 |
35.9 |
1.8 |
1.1, 3.0 |
0.028 |
|
Told to lose weight as an adult |
20.4 |
39.1 |
1.9 |
1.1, 3.4 |
0.027 |
|
Influenced by spouse |
20.9 |
46.2 |
2.5 |
1.5, 4.1 |
< 0.001 |
Table 5. Body Mass Index and Dissatisfaction Score.
|
Body Mass Index |
DS = 0 |
DS = Any |
p-value |
|
|
% |
% |
|
|
Underweight |
10.5 |
89.5 |
<0.001 |
|
Normal weight |
37.5 |
62.5 |
<0.001 |
|
Overweight |
35.0 |
65.0 |
<0.001 |
|
Obese |
15.1 |
84.9 |
<0.001 |
|
Total |
32.6 |
67.4 |
|
|
DS = Dissatisfaction Score |
|||
On multivariate analysis, a smaller IBI (DS = CBI > IBI) versus a larger IBI (DS = CBI < IBI) was statistically associated with: attempt to lose weight by caloric restriction, attempt to lose weight by exercise, told as an adult to lose weight, expect weight to decrease over the next year, and agree that weight has a very large effect on health, report no television viewing. Variables associated with a larger versus a smaller IBI included: unmarried status, attempt to increase weight with food (51.1% versus 18.6%), and told as an adult to gain weight (Table 6). Pertinent variables not associated with DS include environment of birth, environment of current residence, and media (television, radio, billboards, and internet usage), family, friends, religion, and food security.
Table 6. Multivariate analysis for variables that influence a positive or negative Dissociation Score.
|
Variable |
CBI > IBI (%) |
CBI < IBI (%) |
OR |
95% CI |
p value |
|
Decrease weight by restricting caloric intake |
67.4 |
12.1 |
5.2 |
2.2, 12.3 |
<0.001 |
|
Advise to lose weight as an adult |
75.0 |
9.3 |
14.5 |
6.0, 35.2 |
<0.001 |
|
Decrease weight with exercise |
71.3 |
19.3 |
10.4 |
5.9, 18.4 |
<0.001 |
|
Effect of weight on health is very large effect |
47.3 |
34.3 |
1.6 |
1.1, 2.3 |
0.007 |
|
Expected weight to decrease next year |
64.3 |
7.9 |
2.7 |
1.9, 3.9 |
<0.001 |
|
No television viewing |
76.0 |
49.6 |
1.9 |
1.2, 8.3 |
0.016 |
|
Unmarried status |
57.4 |
72.1 |
1.5 |
1.1, 2.4 |
0.045 |
|
Increased weight by increasing caloric consumption |
18.6 |
51.1 |
3.0 |
1.3, 6.8 |
0.010 |
|
Told as an adult to increase weight |
17.1 |
61.2 |
3.7 |
1.7, 8.1 |
0.001 |
|
CBI = Current Body Image; IBI = Ideal Body Image; OR = Odds Ratio; CI = Confidence Interval |
|||||
Media Influence and Ideal Body Image
A majority of participants reported exposure or access to each form of media assessed (Table 7). There was a significant difference in exposure to radio and newspaper/print between women and men. Men were significantly more likely to listen to the radio (OR = 2.51, 95% CI 1.13, 5.59) and read the newspaper (OR = 1.10, 95% CI 1.02, 1.16, p = 0.004) compared with women. A radio and television was present in 92.3% and 92.5% of all households, respectively. In addition, 97% of all participants had access to a cell phone and 60.2 percent had access to the Internet, with no statistical significant difference between women and men (97.1% versus 96.9%, p = 0.587 and 58.3% versus 62.2%, p = 0.243, respectively).
Table 7. Media Exposure and Influence on Ideal Body Image for Self by Gender.
|
Variable |
Radio |
Television |
Newspaper/Print |
|
Access overall (%) |
92.2 |
90.8 |
64.7 |
|
Women |
89.2 |
88.7 |
57.8 |
|
Men |
95.4 |
92.9 |
71.8 |
|
p value |
0.016 |
0.105 |
0.002 |
|
Exposed 7 days per week (%) |
71.8 |
75.2 |
14.0 |
|
Women |
69.1 |
76.5 |
8.8 |
|
Men |
74.5 |
74.0 |
19.5 |
|
p value |
0.140 |
0.322 |
0.002 |
|
Highly Influenced (%) |
18.0 |
21.1 |
14.6 |
|
Women |
16.2 |
24.0 |
18.3 |
|
Men |
20.0 |
17.9 |
10.7 |
|
p value |
0.363 |
0.142 |
0.046 |
|
Not Influenced (%) |
41.4 |
36.8 |
51.8 |
|
Women |
45.1 |
38.2 |
50.0 |
|
Men |
37.4 |
35.4 |
53.6 |
|
p value |
0.128 |
0.536 |
0.425 |
|
p -value represents difference between women and men for each variable. |
|||
Television was the most frequently identified source of media exposure and had the largest influence on IBI. Television was viewed daily by 75.2% of participants and 21.1% of participants reported that their IBI was highly influenced by television, without a statistically significant difference between men and women. Television was significantly associated with dissatisfaction, with those watching television seven days a week having significantly higher dissatisfaction score compared with those not watching television (–0.70 v. 0.48, p < 0.001). Although they read less print media overall, women were significantly more likely to report being highly influenced by newspapers and magazines than men (18.3% versus 10.7%, p = 0.046). Women who were highly or moderately influenced by friend or family opinions were significantly more likely to be dissatisfied (any versus none) with CBI compared with women not influenced at all (77.8% versus 60.0%, p = 0.011, and 80.5% versus 64.8%, p = 0.017, respectively, FET 2 sided). Women’s dissatisfaction score was not significantly associated with influence of television, radio, print media, billboards, spouse, or religion. However, men who were highly or moderately influenced by spouse or friend opinions were significantly more likely to be dissatisfied with CBI compared with men not influenced at all (63.3% versus 44.4%, p = 0.049, FET, 1-sided, and 75.4% versus 48.0%, p = 0.001, FET 2 sided, respectively). Men’s dissatisfaction score was not significantly associated with influence of television, radio, print media, billboards, family, or religion.
Social Influences and Ideal Body Image
Cultural, social and family determinants also had modest influence on IBI for self (Table 8). A spouse/partner had the overall influence on IBI (29.2%), although there was no statistical difference based upon participant gender. Women were significantly more likely to be influenced by friends compared with men (OR = 1.07, 95% CI 1.02, 1.14, p = 0.013).
Table 8. Cultural, Social and Family Influences on Ideal Body Image for Self by Sex.
|
Variable |
Family |
Spouse* |
Friends |
Religion |
|
Highly Influenced (%) |
19.3 |
29.2 |
18.8 |
12.8 |
|
Women |
22.1 |
26.6 |
23.5 |
9.8 |
|
Men |
16.4 |
32.0 |
13.9 |
16.1 |
|
p value |
0.164 |
0.529 |
0.015 |
0.074 |
|
Not Influenced (%) |
45.4 |
31.8 |
39.2 |
73.6 |
|
Women |
43.1 |
35.3 |
39.2 |
74.5 |
|
Men |
47.7 |
28.1 |
39.2 |
72.5 |
|
p value |
0.422 |
0.180 |
1.000 |
0.501 |
|
* Included only if married. |
||||
Social and family influences on gaining/losing weight were assessed for childhood and adulthood. During childhood, most participants were not encouraged to lose weight (91.7%), but almost one-third were told to gain weight (34.5%). Women were significantly more likely to have been told to gain weight as a child compared with men (OR = 1.68, 95% CI 1.10, 2.55, p = 0.015). In contrast, adult women were more likely to be told to lose weight compared with adult men (OR = 2.52, 95% CI 1.64, 3.88). Women were much more likely to have attempted weight loss compared with men. Women were significantly more likely to attempt to lose weight by dieting, (47.1% versus 18.4%, OR = 3.9, p < 0.001, CI = 2.0–7.9), exercising (48.5% versus 31.1%, OR 2.1, p = 0.001, CI = 1.4–3.1) and diet pills (10.8% versus 5.6%, p = 0.045, FET 1-sided).
Additional Health Related Determinants Influence on IBI
An open-ended question inquired about other possible factors that may influence IBI. Most respondents provided no additional types of influence (72%). However, of the 113 (64 men and 71 women) who did provide an open ended response, 53.1% of men and 33.8% of women stated improved health-related reasons as an important influence on their body image, while 23.9% of men and 17.0% of women mentioned a desire to appear more attractive. Only 3.1% of men and 5.6% of women noted social pressures as an external influence on IBI.
Discussion
Ghana provides a particularly unique environment to study body image. First, traditional Ghanaian culture has favored a larger image as ideal that for women, symbolic of wealth and higher status [27–30]. Second, there exists interplay between traditional and modern cultures resulting from rapid economic development, urbanization, modernization and social changes such as shifts in gender roles and exposure to western cultural practices and norms [20]. Further, rural-urban migration continues to occur at a rapid pace, with the rural proportion of Ghana’s total population dropping each year since 1960 and recently dropping below 50% [31]. The implication is that more and more traditional Ghanaian values are being brought along with such migrants to the city, even as recent migrants are exposed to new cultural values in the urban environment. Finally, the growing prevalence of overweight and obesity coupled with increasing longevity mean a rapidly increasing burden of chronic disease for Ghana, a problem that is pervasive in much of the developing world [32, 33]. Because of its position as a key parameter in understanding overweight and obesity and in shaping emotional health, body image is an important public health concern [34, 35].
The choice of 25 figures with standard variation ordered by increasing size was based on the example of the BIAS-BD figural drawing scale, the original version of which depicted 17 human figures [36]. Subsequent research on effective use of figural stimuli has shown that figural stimuli products using a discrete number of images (rather than a size range) and with images arranged in ascending/descending size order [as opposed to random) are the most accurate and effective as research tools [37]. While static figures obviously limit the creativity with which participants can express their ideal body image perspectives, we did test for and confirm that they were accurate in representing a participant’s current body image in regards to BMI, and we limited our investigation of body image to size rather than including other considerations such as shape or build.
We investigated determinants in combination with body image perspectives to better understand the factors that shape Ghanaians’ weight and their ideas about weight. Our study found a notable disparity between men and women in terms of proportion overweight and obesity, with 50.0% of women categorized as overweight or obese compared with 27.5% of men. These numbers are consistent with previous findings in Cape Coast [38]. We found only a few correlates for overweight or obesity, none of which provided a satisfying explanation for this gender disparity. As expected, age correlated with weight for both genders, as did number of children. Men were significantly more likely than women to be employed, and work of all types has been found to contribute to a less sedentary lifestyle [39] and lower rates of overweight/obesity; however, employment status was not correlated with BMI for men or women in our study. Further study might delve deeper into the relationship between employment type and body weight. We also found no relationship between education level and BMI, although such a relationship has been found in previous research in the region [28, 40].
We found no correlation between location of residence and BMI, although this has also been shown to be an important correlate of BMI [41]. This may be accounted for by the fact that participants are relatively mobile as – approximately 28.5% had lived in at least four places in their lives—and that a large number (37.5%) had lived in one or both of the two largest cities in Ghana (Accra or Kumasi) at some point, suggesting that even semi-urban and rural residents may have significant exposure to urban environments. Studies on body image have shown that both men and women are influenced by the figures they see in the media and in particular television, and that media exposure often creates unrealistic expectations for body image, leading to increased body dissatisfaction [4,13, 42]. One of the most notable findings in our research was the high level of media exposure reported by participants. These high levels of media exposure suggest that Ghanaians are susceptible to media influences that may influence their body image perceptions. One limitation to this assumption is that we did not examine amounts of daily media exposure, nor did we attempt to document the type of content participants were exposed to, both of which might have helped us better understand our participants and the influences on them.
We observed a significant relationship between high levels of television viewership and body image dissatisfaction within our sample population, suggesting the plausible presence of media content that may influence people’s body image ideals. Interestingly, unmarried men who watched television were significantly more likely to choose an IBI larger than their CBI, indicating a desire to be larger than their current size. Other studies have reported similar findings, and have suggested that men may be under increasing pressure to develop greater degrees of muscularity [4]. Indeed, formal and informal comments from men during the course of the survey confirmed that many were interested in being larger and more muscular.
Social interactions and body dissatisfaction relationships with friends and family were shown to be influential determinants in the establishment of body image, and in determining how an individual is affected by their body image [43]. Research in the United States has shown the influence of social relationships and support organizations on body image can be incredibly powerful in both positive and negative ways [44, 45]. We found that both spouse/partner and friends had a negative rather than positive influence on female body image, with women who identified strong influences from these determinants having greater body image dissatisfaction scores. However, family influence was not correlated with dissatisfaction, which may suggest either that adults are less influenced by the opinions of their families, or that family members are more likely to be supportive, making them less apparent as a source of influence.
Although our question about self-reported influence did not reveal as strong a relationship between social forces and dissatisfaction as we found for television, our secondary social influences questions, which assessed whether participants had ever been told to change their weight, were incredibly telling. Among a wide variety of factors, being told to change weight as an adult was the most strongly associated with body image dissatisfaction, and what participants had been told was tied to the type of dissatisfaction they experienced, with those who had been told to gain weight favoring a smaller ideal, and those who had been told to lose weight favoring a smaller one. This supports the idea that negative messages about weight from social networks are very powerful.
The concept of influence from media and relationships seemed to be an idea that some participants were familiar, while others appeared to have a much more difficult time contextualizing the way in which images, ideas or other people could affect their personal body image concept. This may have led to some participants providing arbitrary or inaccurate answers to our influences questions. Further study into body image in this context is warranted. In particular, drawing out more detailed information about the types of influences present in Ghanaian media, adding qualitative inquiry methods to our work and perhaps determining novel ways to inquire about the concept of influence would all be helpful in revealing more about body image attitudes in Ghana.
References
- Duda RB, Jumah NA, Hill AG, Seffah J, Biritwum (2006) Interest in healthy living outweighs presumed cultural norms for obesity for Ghanaian women. Health and Quality of Life Outcomes 4: PMC 1544332.
- Duda RB, Jumah NA, Hill AG, Seffah J, Biritwum R (2007) Assessment of the ideal body image of women in Accra, Ghana. Trop Doct 37: 241–244. [crossref]
- Thompson J, Heinberg M, Altabe M, Tantleff-Dunn S (1999) Exacting Beauty: Theory, assessment and treatment of body image disturbance. American Psychological Association, Washington DC. USA.
- Thompson JK, Heinberg LJ (1999) The Media’s Influence on Body Image Disturbance and Eating Disorders: We’ve Reviled Them, Now Can We Rehabilitate Them? Journal of Social Issues 55: 339–353.
- Cash TF, Smolak L (2011) Understanding body image: historical and contemporary perspectives. In: Cash TF, Smolak L (eds.). Body image: a handbook of science, practice, and prevention. Guilford Press, New York, USA Pg No: 3–11.
- Cash TF (2012) Cognitive-behavioral perspectives on body image. In: Cash TF (ed.). Encyclopedia of body image and human appearance. Oxford, Elsevier Pg No: 334–342.
- Laus MF, Kakeshita IS, Costa TM, Ferreira ME, Fortes Lde S, et al. (2014) Body image in Brazil: recent advances in the state of knowledge and methodological issues. Rev Saude Publica 48: 331–346. [crossref]
- Holland G, Tiggemann MA (2016) systematic review of the impact of the use of social networking sites on body image and disordered eating outcomes. Body Image 17: 100–110.
- Grabe S, Ward LM, Hyde JS (2008) The role of the media in body image concerns among women: a meta-analysis of experimental and correlational studies. Psychol Bull 134: 460–476. [crossref]
- Want SC (2009) Meta-analytic moderators of experimental exposure to media portrayals of women on female appearance satisfaction: Social comparisons as automatic processes. Body Image 6: 257–269.
- Fernandez S, Pritchard M (2012) Relationships between self-esteem, media influence and drive for thinness. Eat Behav 13: 321–325. [crossref]
- Cafri G, Yamamiya Y, Brannick M, Thompson JK (2005) The Influence of Sociocultural Factors on Body Image: A Meta-Analysis. Clinical Psychology: Science and Practice 12: 421–433.
- Blond A (2008) Impacts of exposure to images of ideal bodies on male body dissatisfaction: a review. Body Image 5: 244–250. [crossref]
- Leit RA, Gray JJ, Pope HG (2002) The media’s representation of the ideal male body: A cause for muscle dysmorphia? International Journal of Eating Disorders 31: 334–338.
- Daniel S, Bridges SK (2010) The drive for muscularity in men: media influences and objectification theory. Body Image 7: 32–38. [crossref]
- Agliata D, Tantleff-Dunn S (2004) The impact of media exposure on males’ body image. Journal of Social and Clinical Psychology 23: 7–22.
- Kronenfeld LW, Reba-Harrelson L, Von Holle A, Reyes ML, Bulik CM (2010) Ethnic and racial differences in body size perception and satisfaction. Body Image 7: 131–136. [crossref]
- Yates A, Edman J, Aruguete M (2004) Ethnic differences in BMI and body/self-dissatisfaction among Whites, Asian subgroups, Pacific Islanders, and African-Americans. J Adolesc Health United States 34: 300–307.
- Swami V, Frederick DA, Aavik T, Alcalay L, Allik J, et al. (2010) The Attractive Female Body Weight and Female Body Dissatisfaction in 26 Countries Across 10 World Regions: Results of the International Body Project I. Personality and Social Psychology Bulletin 36: 309–325.
- Agyei-Mensah S, de-Graft Aikins A (2010) Epidemiological transition and the double burden of disease in Accra, Ghana. J Urban Health 87: 879–897. [crossref]
- Central Regional Hospital (2008) Central Regional Hospital, Cape Coast: 2008 Annual Report. Cape Coast Central Regional Hospital, interberton road, Cape Coast, Ghana.
- Ware JE Jr (2008) Improvements in short-form measures of health status: introduction to a series. J Clin Epidemiol 61: 1–5. [crossref]
- Ware JE Jr (2003) Conceptualization and measurement of health-related quality of life: comments on an evolving field. Arch Phys Med Rehabil 84: 43–51. [crossref]
- Ware JE, Kosinski M (2001) Interpreting SF-36 summary health measures: a response. Qual Life Res 10: 405–413. [crossref]
- Stewart A, Ware J (1992) Measuring Function and Well-Being: The Medical Outcomes Study Approach. 1st (edn). Duke University Press Books, Durham, USA.
- WHO (2011) Waist circumference and waist-hip ratio: report of a WHO expert consultation, Geneva, 8–11 December 2008. WHO Press, Geneva.
- Smith AD (2009) Girls being force-fed for marriage as fattening farms revived. The Observer.
- Addo J, Smeeth L, Leon DA (2009) Obesity in urban civil servants in Ghana: association with pre-adult wealth and adult socio-economic status. Public Health 123: 365–370. [crossref]
- Cogan JC, Bhalla SK, Sefa-Dedeh A, Rothblum ED (1996) A Comparison Study of United States and African Students on Perceptions of Obesity and Thinness. Journal of Cross-Cultural Psychology 27: 98–113.
- Cassidy CM (1991) The good body: when big is better. Med Anthropol 13: 181–213. [crossref]
- Bank W (2013) World dataBank: World Development Indicators. Washington DC, USA.
- Amuna P, Zotor FB (2008) Epidemiological and nutrition transition in developing countries: impact on human health and development. Proc Nutr Soc 67: 82–90. [crossref]
- Caballero B (2001) Introduction. Symposium: Obesity in developing countries: biological and ecological factors. J Nutr 131: 866–870.
- Krentz AJ (2006) Self-image in obesity: clinical and public health implications. J R Soc Med 99: 215–217. [crossref]
- Muennig P, Jia H, Lee R, Lubetkin E (2008) I think therefore I am: perceived ideal weight as a determinant of health. Am J Public Health 98: 501–506. [crossref]
- Gardner RM, Jappe LM, Gardner L (2009) Development and validation of a new figural drawing scale for body-image assessment: the BIAS-BD. J Clin Psychol 65: 113–122. [crossref]
- Gardner RM, Brown DL (2011) Method of presentation and sex differences when using a revised figural drawing scale to measure body size estimation and dissatisfaction. Percept Mot Skills 113: 739–750. [crossref]
- Amegah A, Lumor S, Vidogo F (2011) Prevalence and Determinants of Overweight and Obesity in Adult Residents of Cape Coast, Ghana: A Hospital-Based Study. African Journal of Food, Agriculture, Nutrition and Development 11: 4828–4846.
- Van Domelen DR, Koster A, Caserotti P, Brychta RJ, Chen KY, et al. (2011) Employment and physical activity in the U.S. Am J Prev Med 41: 136–145. [crossref]
- Dake FA, Tawiah EO, Badasu DM (2011) Sociodemographic correlates of obesity among Ghanaian women. Public Health Nutr 1285–1291.
- Ziraba AK, Fotso JC, Ochako R (2009) Overweight and obesity in urban Africa: A problem of the rich or the poor? BMC Public Health 9: 465. [crossref]
- Derenne JL, Beresin EV (2006) Body image, media, and eating disorders. Acad Psychiatry 30: 257–261. [crossref]
- Field AE, Austin SB, Camargo CA, Taylor CB, Striegel-Moore RH, et al. (2005) Exposure to the Mass Media, Body Shape Concerns, and Use of Supplements to Improve Weight and Shape Among Male and Female Adolescents. Pediatrics 116: 214–220.
- Pole M, Crowther JH, Schell J (2004) Body dissatisfaction in married women: the role of spousal influence and marital communication patterns. Body Image. Netherlands 267–278.
- Eisenberg ME, Berge JM, Fulkerson JA, Neumark-Sztainer D (2010) Weight comments by family and significant others in young adulthood. Body Image. Elsevier Ltd Netherlands 2011: 12–19.