Abstract
We have printed clear annular patterns by mass separated ion using rotating electric fields. We have been developing the new type mass analyzer using two rotating electric fields (REFs). The REF-MS are capable of simultaneous mass separation with limited elements. In our previous studies, the origins of the ions and the annular ring patterns were identified by theoretical calculations and time of flight type secondary ion mass spectrometry (TOF-SIMS) imaging. In this paper, we have printed clear annular patterns on the Si wafer within short time and discuss the origin of finger prints.
Keywords
FIB, Imaging mass spectrogram, REF-MS
Introduction
We have been developing the new type mass analyzer using two rotating electric fields (REFs). The origin of REF type mass analyzer can be traced back to a simple TOF principle within a single REF geometry [1, 2]. Table 1 indicates the comparison with conventional mass analyzers and REF-MS. The REF-MS is highly developed to separate different ions continuously in a two-dimensional plane. In principle, dimension of detection on sector-MS, TOF-MS and Q-MS are almost restricted to spots. The sector-MS and the REF-MS are capable of simultaneous detection with limited elements. Each REF consists of eight small electrodes and AC voltage with a phase contrast of 45 degrees is applied to the each electrode. This REF-MS locates double REFs aligned on the same axis. Then, we optimized the phase contrast between the upstream REF and downstream REF to make the phases opposite for the selected ion. First, ions travel into the upstream REF. The flight time of the selected ion is controlled to be just one cycle of the REF. Between the two REFs, ions travel mirror trajectories on their mass. The selected ion draws a cycloid trajectory. The downstream REF is drawn opposite phase with the upstream REF. In the downstream REF, typical ions are converged to center axis and other ions travel different trajectory [3, 4]. The relationship with the mass electric charge ratio of the selected ion and the frequency of REFs can be described by following equation (1), where f is the frequency of the REF, L is the length of the REF, Vacc is the accelerating voltage of the selected ion, m/Z is the mass weight of the single charged ion for measurement, and e is the quantum of electricity [5].
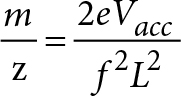
Table 1. Comparison with conventional mass analyzers and REF-MS.
|
Sector-MS |
TOF-MS |
Q-MS |
REF-MS |
|
|
Ion beam |
Continuous |
Pulse |
Continuous |
Continuous |
|
Dimension of Detection |
Spot (line) |
Spot |
Spot |
2D plane |
|
Simultaneous Detection (Dependence) |
Multi elements (Magnetic field) |
One elements (Time) |
One elements (Frequency) |
Multi elements (Rotating electric field) |
Experiments
Our original instruments are precisely described in our previous papers [3–5]. In this study, we selected AuGe alloy as a FIB source. It is reported that many kinds of Au, Ge isotopes or compounds are emitted from AuGe alloy liquid metal ion source [6, 7]. The accelerating voltage of the AuGe-FIB was 10 kV. The alternative potential of each sinusoidal wave was ±210 V maximum (peak to peak). First, we optimized the phase contrast between each channel and optimized the alternative potential for the specific mass from AuGe alloy. Then, we set the movable aperture unit and kept the ion-beam current to about 5.2 nA. Second, we obtained the annular patterns of AuGe alloy by sweeping the frequencies of REFs. In our previous studies, the origins of the ions and the annular ring patterns were identified by theoretical calculations (SIMIONTM). The certainty of these results was confirmed by time of flight type secondary ion mass spectrometry (TOF-SIMS) imaging of printed AuGe annular ring patterns on Si wafer [8]. In this paper, we have printed clear annular patterns on the Si wafer within short time and discuss the origin of finger prints.
Results & Discussion
Using the equation (1), we calculated the proper frequencies when 197Au2+, 197Au+ and 197Au2+ ions are converged to the center. Figure 1 indicates the projection patterns of AuGe alloy obtained by using REF-MS on the fluorescent screen. On fig.1-(A), 197Au2+ mass was converged to the center and other masses formed concentric annular rings with different diameters from the center. There are also the annular rings outside of center, however the origins of annular rings cannot be identified. On the other hand of fig.1-(B), 197Au+ ion was converged to the center and 197Au2+ ion was disappeared from the screen. There are non-annular patterns were also confirmed near the edge of the screen. It is thought that the ions were reflected within the wall of electrode and formed fringed patterns. Because, the fringed patterns draw the opposite movement from the annular patterns when the optical axis is shifted. On fig.1-(C), 197Au2+ ion was converged to the center and 197Au+ ion have moved from the center to the outside. There are also Ge isotopes ions forming annular rings in concentric order around 197Au2+ ion.
We converted target from the fluorescent screen to the Si wafer and printed clear annular patterns on the wafer. Figure 2 indicates the results of the prints of annular rings patterns. Samples were prepared by irradiating AuGe-FIB mass-separating by REFs at an acceleration voltage of 12.9 kV for 3 hours. At each frequency, we succeeded in printing the clear annular patterns. In fig.2-(A), we can see two central points. It is thought that the axis of the beam shifted during the irradiation of AuGe-FIB. In fig.2-(B), the fringed patterns of ions could not be printed. From these results, it is considered that the patterns printed to the Si wafer were formed by ions colliding directly to the Si wafer. All of the clear printed Si wafers were elementally analyzed by TOF-SIMS and the surface was measured by surface roughness meter. The results indicate AuGe-FIB has left no fingerprints on Si wafers. It can be concluded that the clear patterns can be originated to amorphous phase generated within the first 3 hours. Ion implantations were majorly processed, after the amorphous phase has formed completely.
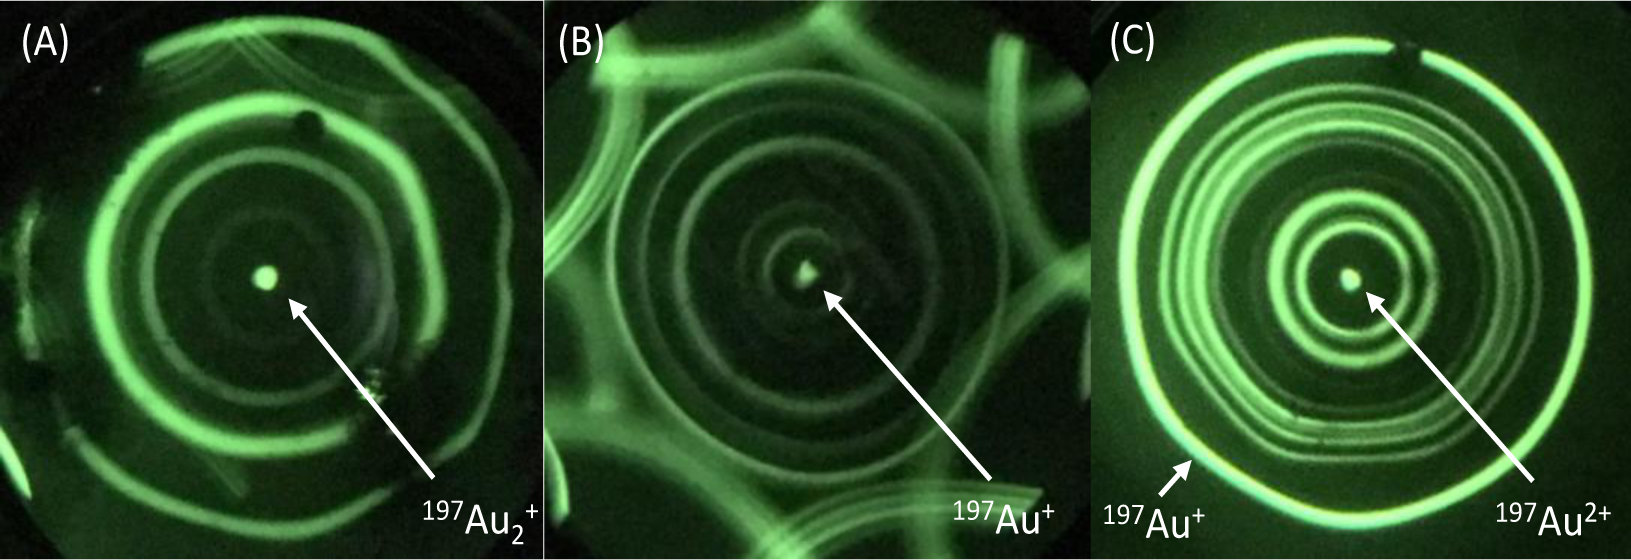
Figure 1. Annular patterns of AuGe alloy by mass separation of REF-MS on the fluorescent screen (A) f = 479 kHz, (B) f = 680 kHz (c) f = 956 kHz (Each frequency was assigned by
equation(1))
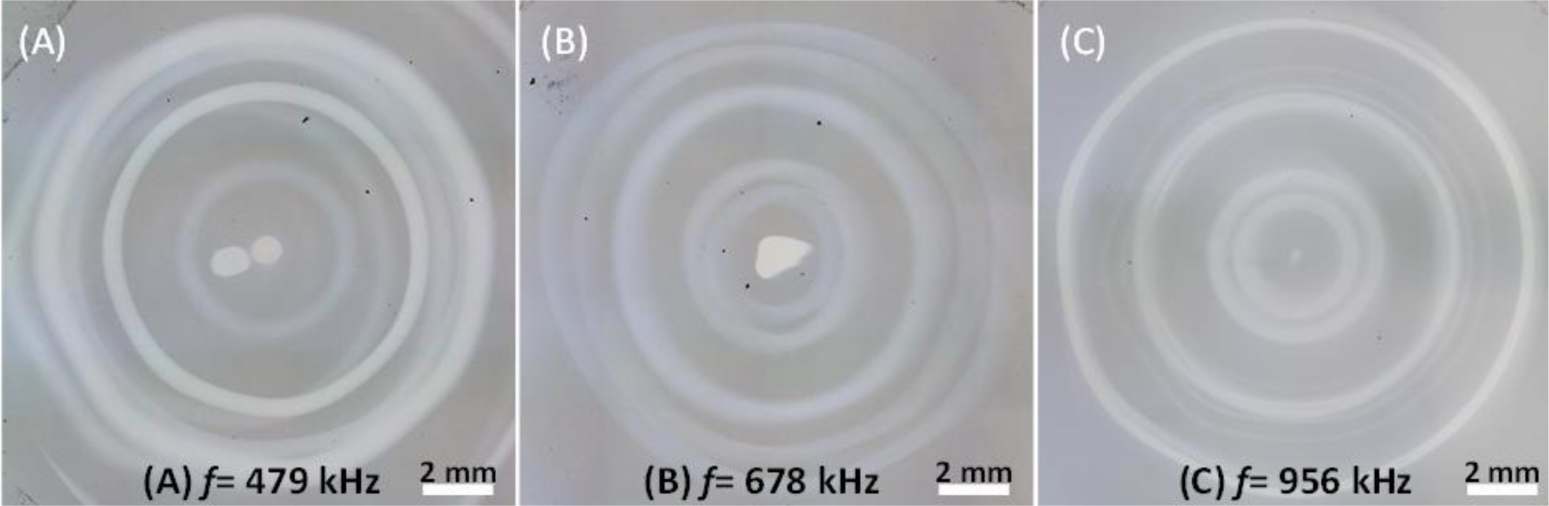
Figure 2. The results of the prints of annular ring patterns on Si wafers (A) f = 479 kHz, (B) f = 678 kHz, (C) f =956 kHz.
Authorship
This work was spatially supported by Mr. Tokio Norikawa and Naoya Kishimoto of Tokyo University of Science.
Contributors
The authors are particularly indebted to Mr. Takashi Kusanagi of Ampere Inc., Dr. Satoshi Kurumi and Prof. Kaoru Suzuki of Nihon University, Prof. Kosuke Moritani of University of Hyogo This unique technique was originally invented by Mr. Masanao Hotta and Dr. Tatsuya Adachi. I wish to express great respects for them.
Funding information
This work was partially supported by academic incentive system of the Toshiba Electric Devices & Storage Corporation and SHIMADZU SCIENCE FOUNDATION.
References
- Clemmons JH, Herrero FA (1998) Mass spectroscopy using a rotating electric field. Rev Sci Instrum 69: 2285–2291.
- Katayama A, Kameo Y, Nakashima M (2008) Time-of-Flight Mass Spectrometer Using an Imaging Detector and a Rotating Electric Field. J Mass Spectrom Soc Jpn 56: 229–234.
- Nojima M, Anai Y, Hotta M, Suzuki K, Kurumi S, et al. (2016) Development of a mass spectrometer using two rotating electric fields. J Vac Sci Technol B 34: 03H132-1-03H132-4.
- Nojima M (2017) Imaging Mass Spectrogram using Rotating Electric Fields Mass Spectrometer. Global Journal of Nanomedicine 2: GJO.MS.ID555596.
- Anai Y, Nojima M, Hotta M, Suzuki K, Kurumi S, et al. (2016) Development of Mass Spectrometer Using Two Rotating Electric Fields for Separation of High-Mass Ions. J Surf Sci Nanotech 14: 161–164.
- Machalett F, Muhle R, Stiebritz I, Gotz G (1989) Mass Spectra of Au-Ge Alloy Liquid Metal Ion Sources. Nuclear Instruments and Methods in Physics Research B37/38: 180–183.
- Davies N, Weibel DE, Blenkinsopp P, Lockyer N, Hill R, et al. (2003) Development and experimental application of a gold liquid metal ion source. Applied Surface Science 203–204, 223–227.
- Nojima M, Norikawa T, Kishimoto N (2018) Mass Separation of AuGe-LMIS Using a New Principle: Rotating Electric Fields. Mass Spectrom Purif Tech 4: 128.