Abstract
Respondents rated degree of agreement/disagreement with combinations of phrases describing the environmental and social impacts of vegetable-based meats, following the Mind Genomics paradigm. The template comprised four questions dealing with different aspects of the topic (climate change, local benefits, land/energy, values), and four phrases providing specifics of each aspect. Each of 87 randomly selected respondents from the United States rated a set of 24 unique combinations, arrayed according to an experimental design. Two clearly different mind-sets emerged. Mind-Set 1 focused on the person and on the effects of human behavior. Mind-Set 2 focused on the external environment, not on people. The study shows the efficiency of Mind Genomics to address a topic at the level of granularity, doing so quickly, affordably, and with the ability to iterate repeatedly to create a large encompassing database of information about the topic.
Introduction
Today’s world has increasingly come to focus on the environment, on warming, on gases, and the deleterious effects of human agriculture and industry. It seems almost impossible to escape the issue and of course the associated rhetoric. The topic of our changing environment is clearly a cause for concern, but a concern which morphs beyond the disagreements in the popular press, to affecting the world of science. As of February 2023, Google(r) reported 1.6 million hits on the topic of ‘food and climate change.’ The topics in the scientific literature are striking, but modulated, disciplined, and subject to validation. The popular literature, however, expands the scientific range, moving into rhetoric, conflict about the meaning of the scientific findings, to alarmist literature about the road to extinction [1], and finally to business-based decisions, such as insurance policies based upon the proximity to the sea, and the weather [2].
In the middle of all of this has emerged the world of PBM, plant-based meat, meat analogs grown from plants, made into products which are advertised as tasty as beef. What before were simply non-meat analogs of meat, without the taste and certainly without the marketing pizzaz, has given way to visibility, competition, venture capital funding, and the appearance of stories about adoption, success, and financial performance [3], although during these early days of 2023 the ‘bloom may be off the rose,’ with some issues in the ongoing consumption of plant-based proteins [4].
It is to this world of emotion in the mind of people, and specifically emotion tied to agriculture, food, environment, and human welfare that we turn. A review of the literature suggests well-thought-out topics involving human coping with the environment as affecting food [5]. In this paper we move into the emotions involved in messaging, these emotions studied using disciplined experimentation implemented by the emerging science of Mind Genomics [6].
The Mind Genomics Paradigm
Traditionally, consumer researchers as well as political pollsters and others interested in public issues have attempted to understand what people think about either through discussion (so-called qualitative methods) or through questionnaires (so-called quantitative methods). With the advent of the internet, and the ability to track a person’s behavior, it is increasingly possible to link what people say to what people do. It should come as no surprise that there is a plethora of research on many topics simply because the methods available have burgeoned in number, and have become easier to use, and far more affordable.
What these methods often lack, however, is the ability to penetrate deep within the mind of the respondent. There are those involved in qualitative research as well as in observational anthropological research who believe that their methods allow the researcher insight into the mind of the respondents, simply because the matrix of material from which to study is so rich, and because the researcher is somehow attuned to such insights, a sort of ‘Listening with the Third Ear’ metaphor by psychoanalyst Theodor Reik [7]. For ordinary researchers one must assume that to a great degree the tools are too blunt to dive deeply below the surface to generate deep insights about a granular topic.
An opportunity to probe deeply into the mind of a person is hinted at by the study of memory, discovered almost a century and a half ago by experimenting psychologists. These researchers discovered that it is easier to let a respondent ‘recognize’, rather than to reproduce. The approach just mentioned, recognition vs reproduction, comes from research on memory. The researcher presents the test subject with material, waits a measured length of time, and either instructs the person to reproduce what the person remembers (so-called reproduction memory), or presents the respondent with different stimuli, some of which were presented, others not, instructing the respondent to identify out that which had been previously presented (so-called recognition memory) [8].
Coming from the world of experimental psychology, Mind Genomics combines experimental design with an approach inspired by recognition memory. The underlying notion of Mind Genomics is that people respond most naturally to stories. The stories, really combinations of messages, need not be polished, with correct tenses, connectives, and so forth. Rather, the stories comprise messages which paint a ‘word picture.’ There is no ‘recommended way’ nor ‘best practice’, other than to keep the size of the word picture within reason, so that the respondent can ’graze’, take in the information, digest it, and then generate a response. We embed the information into a matrix that can be quickly ingested and acted upon, not something which requires detailed reading and thinking. The researcher presents the stimulus, measures the response, and looks for patterns.
The typical Mind Genomics study work with a limited set of elements, combines them by an experimental design, presents the combinations (vignettes) to the respondent, obtains ratings, deconstructs the ratings to the contribution of the element, and arrives at the performance of the elements. Or in other words, and in a much simpler way, present mixtures of ideas, and measure the driving power of each idea. It is the idea of ‘recognition’ which emerges as the leitmotif of the process.
Mind Genomics: The Applications and the Paradigm Explicated by a Case Study
Over the past three decades, since the early 1990’s, Mind Genomics has found use in understanding how people make decisions about food. The number of papers and books is growing. One need only look at the three books on Mind Genomics for food concepts [9], package design [10] and general application [6] to get a sense of its power and promise. Beyond those books lie many dozens of papers dealing with specific topics. The topic of non-meat foods has been dealt with through Mind Genomics (with the papers part of a series of papers on different aspects of the newly emerging world of plant-based meat [11]. The paper presented here is one of those studies, presented in further detail.
Mind Genomics studies are best understood following the templated sequence of design, field implementation, and analysis. The actual research process of Mind Genomics has been embedded in a template which allows anyone, expert down to novice researcher, to explore the mind of people in almost any topic where human judgment is relevant.
Step 1: Choose the Topic
This step seems quite simple, but the simplicity is deceptive. For a Mind Genomics study to ‘work’ the topic must be at once large enough to generate interesting information about human beings and decision processes, but sufficiently delimited, so that the specific messages, the elements, possess granularity, immediacy, and a sense of the real world. We may talk about topics in general, but it is granularity which is important. The topic here is environmental issues and moral/social points of view regarding plant-based meats.
Step 2: Choose the Raw Material, Comprising Four Questions and Four Answers to Each Question
The Mind Genomics paradigm forces the researcher to deconstruct the problem or topic into a set of questions, each of which has different answers (also called elements). It is Step 2, the systematization of thinking at the up-front stage, which is problematic for many scientists. The researcher must stand back, and treat the topic in a dispassionate manner, looking at the topic as comprising four steps. The discovery of the four steps is the most difficult part of Mind Genomics. Recently, however, the Mind Genomics program (www.BimiLeap) has been augmented with artificial intelligence to help the researcher discover the relevant questions. The AI augmentation, Idea Coach, has only recently been embedded in the BimiLeap program, as was not available at the time of this study, run in 2019.
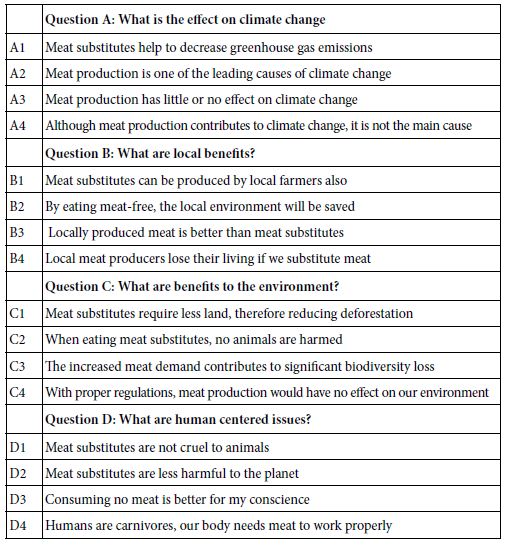
Table 1 presents the four questions (really aspects). For each of the four questions, the researcher is instructed to create four answers, generating a total of 16 answers. It will be these answers but without the questions, combined into small vignettes in Step 3 which will become the material to which the respondent will be exposed with instructions to rate the vignette as a total idea.
Table 1: The four questions and the four answers to each question
Step 3: Create the Actual Test Stimuli, the Vignettes, and the Rating Scale
The Mind Genomics experience for the respondent is that the stimuli should comprise mixtures, combinations of elements or messages, simulating the combinations of stimuli one encounters in the environment. The respondent is presented with different combinations (the vignettes), along with a question and a rating scale. The respondent selects a rating from the scale for the specific vignette. The respondent evaluates different vignettes, rating each vignette on the same scale. The approach is radically different from the more conventional approach of ‘isolate and explore.’ The rationale is that through the evaluation of vignettes the researcher is reproducing the type of world of information which confronts the respondent every day. Mind Genomics simply takes that metaphor of combinations and converts the metaphor into a test reality by combining messages (answers) from Step 2. Note that the questions are never presented to the respondent. The respondent only sees combinations of answers. The questions are there to help the researcher create the answers.
The raw material comprises 16 elements, the four answers from each of the four questions. An underlying scheme, the permuted experimental design, creates a basic set of 24 vignettes, specifying the composition of each vignette. The 16 elements each appear five times across the 24 vignettes and are thus absent 19 times. A single vignette may have as many as four elements, or as few as two elements. No vignette contains more than one element from a question, but often a question does not contribute an element to the vignette. Finally, each respondent evaluates unique sets of 24 vignettes. The underly mathematical structures of the 24 vignettes are the same, but the actual combinations differ. This is known as a permuted design [12].
The precautions taken in the creation of the permuted design create three benefits:
- The vignettes cover many combinations, not just one combination. Compared to traditional methods studying the combinations, the Mind Genomics study evaluates a greater proportion of the design space, the possible vignettes. The researcher need not worry about having selected the proper set of 24 vignettes to test, which selection would mean that the research somehow ‘knew’ what combinations would be most fruitful to test. In practice the researcher need not know anything. It will the research which will reveal what is important, based upon the pattern of responses from the individuals who participate in the study.
- The Mind Genomics process builds in replication. Instead of measuring the response to the stimulus one time, the researcher measures the response to the stimulus five times, albeit in the presence of other elements.
- It is impossible to game the system. It is impossible for a normal person to figure out the underlying experimental design in the ‘heat of the moment,’ when reading 24 vignettes, one after another, each one taking about 1-5 seconds to read and evaluate.
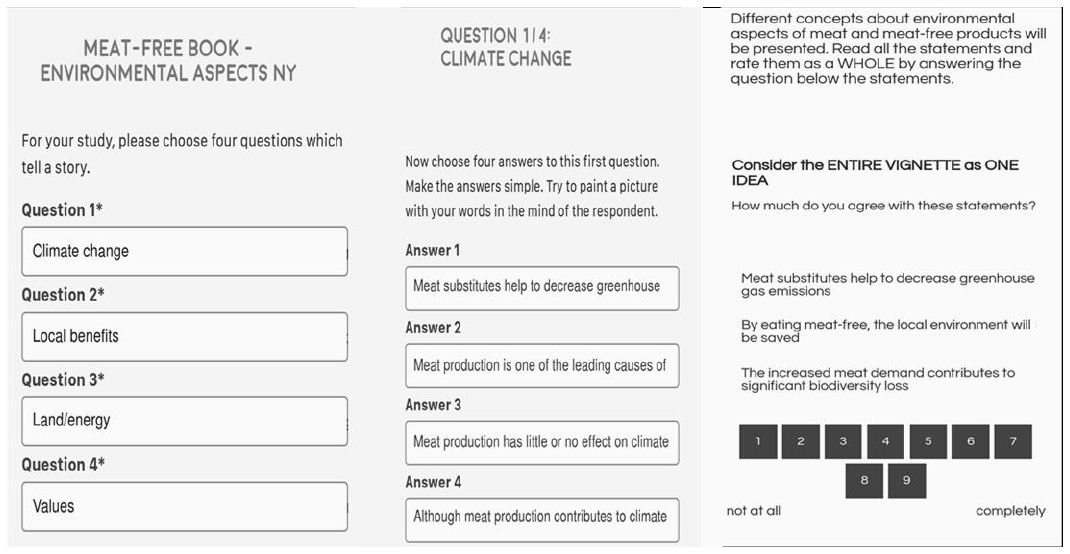
Figure 1: Three of the set-up screens for the Mind Genomics template. Each study is templated in the same way, with screens leading the researcher through the steps.
Figure 1 presents the three major screens in the Mind Genomics program (www.BimiLeap.com)
- The left screen requests the researcher to type in the four questions. The questions are shown as simple phrases, as an aid to the researcher. Thus Figure 1 shows simple phrases such as ‘climate changes,’ sufficient to help the researcher create the element, viz., the answer.
- The middle panel shows the four questions. The researcher reads the first question or phrases (climate change) and is prompted to put in the four answers. The answers are shown as full phrases. The emphasis to the researcher is to create element which create word pictures, not just simply one or two word answers.
- The right panel shows an example of the introduction at the top, a vignette in the middle, and the scale at the bottom.
Different concepts about environmental aspects of meat and meat-free products will be presented. Read all the statements and rate them as a WHOLE by answering the question below the statement.
Agree: 1=Not at all … 9=Completely.
Step 4: Launch the Study, Invite the Respondents, Specifying Country, Market, Age/gender if Desired, and Other Specifics
The study was run in the United States in 2019. The issue at that time was both to understand the topic of plant-based foods from a variety of viewpoints, as well as to determine whether there would be differences in responses between two parts of the country, California vs. New York.
The study called for 50 respondents in New York, and 50 respondents in California, about equally distributed by gender and by age. The cost of the study (4$ per respondent, complete, including the fee for the respondent invitation and participation) reflects the fact that the Mind Genomics platform was created as a service to the world of education, society, health, and business. The low cost makes it possible for anyone to become a researcher.
At the start of the evaluation the respondent recorded gender, age, and answer the preliminary question regarding their behavior and attitude towards meat and the environment
Preliminary question: Which of the following describes you the best?
1=I eat meat and do care about the environment
2=I eat meat and don’t care about the environment
3=I don’t eat meat and do care about the environment
4=I don’t eat meat and don’t care about the environment
5=Not applicable
The Mind Genomics program assembles the 24 different vignettes prescribed for the specific respondent and presents them in a specific order to the respondent. Previous studies suggested that the respondent should be given a practice vignette. The practice vignette is vignette #24. The vignette is presented to the respondent, but the rating is not recorded. The vignette will be presented again, as the last vignette, and then the rating recorded.
Preliminary inspection of the ratings showed that out of 102 respondents who ended up participating 15 respondents showed ratings either of 1-2, 8-9, or one rating across all 24 vignettes, respectively. These 15 respondents were removed from the data set, based upon the belief that the respondents were either not paying attention, or were agreeing or disagreeing with everything, and thus showing no ability to discriminate.
Step 5: Modeling to Relate the Presence/absence of the Elements to the Ratings
The essence of Mind Genomics is the effort to relate the presence or absence of the elements to the ratings. Most users of research accept Likert scales, such as the 9-point scale presented here, but feel uncomfortable interpreting the individual scale values. One way to help them is to anchor the ends of the scales, another way to help them labels each scale point, as was done in the introductory, self-profiling questionnaire, wherein the respondent classified herself/himself with respect to meat-consumption and feelings about the environment. For this study, the rating scale was simply anchored at both extremes, with no attempt to label the intermediate points.
The Mind Genomics system uses a Likert scale to quantify the response, since it is simple for the respondent. The subsequent analysis, after the data collection, transforms the scale into a binary scale, vs 100, a transformation which makes the data more understandable. The 9-point scale was divided into two sections, based upon a criterion which makes sense. for this study. Ratings 9 and 8 were assumed to denote ‘agreement’ and were transformed to 100, with a vanishingly small random number added. Ratings 1-7 were assumed to reflect either no agreement or an uncertain mix of agreement and disagreement. These later ratings were transformed to 0, again with a vanishingly small random number added.
The small random number added to the transformation ensured that the transformed ratings from one respondent would not either be 100 for all or 0 for all. The addition of the vanishingly small random number prevents the OLS (ordinary least squares) regression from crashing, which would occur when all transformed ratings are 0, or in the other case when all transformed ratings are 100.
Step 6: Surface Analysis of the Ratings
The first analysis focuses on the degree to which the ratings change while evaluating the 24 vignettes. For our study no two vignettes were the same, making it impossible to compare the average ratings by position for the same stimulus. Each vignette only appears once. However, it makes sense to average the ratings of all the vignettes appear in position 1 (first vignette tested out of the 24), position 2, and onward to position 24.
Figure 2 shows the average transformed rating (8,9 –>100) for all vignettes in position 1, position 2 … position 24. A line fitted to the data slopes upwards but very slightly. The reality from inspecting Figure 2 is that the pattern is random.
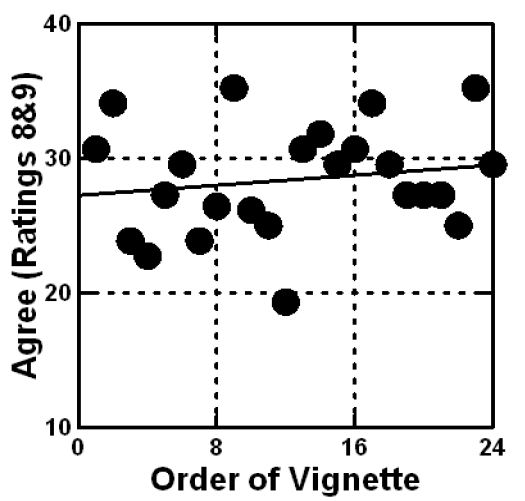
Figure 2: Average percent of ratings ‘agree’ (ratings 9 and 8 transformed to 100) shown on the ordinate, vs each of the 24 positions in which a vignette could appear.
Step 7: Relate the Presence/absence of Elements to the Ratings and Uncover Mind-sets
The heart of Mind Genomics is the discovery of how elements ‘drive’ responses. The analysis is straightforward, made so by the judicious application of the permuted experimental design used in the construction of each respondent’s 24 vignettes. The analysis embedded in the BimiLeap program creates a database for all the data, 24 rows for each respondent. Each row corresponds to one of the 24 vignettes evaluated by that respondent.
The first set of columns in the each database record shows the respondent identification number, and the order of testing. The second set of 16 columns codes the composition of the vignette. Each of the 16 columns corresponds to one of the 16 elements, ranging from A1 to D4. When the when the element is present in a vignette, the number in the column (for that row) is ‘1’. When the element is absent from that vignette, the number in the column is 0.
The third set of columns shows the original rating, then the rating transformed to 0/100 (100 corresponds to 8,9; 0 corresponds to the remaining seven ratings 1-7), and the response time (RT) defined as number of seconds elapsing from the time the vignette was presented on the screen to the time that the rating was assigned, captured to the nearest tenth of a second.
The fourth set of columns shows the set of three classifications, gender, age, and behavior regarding eating meat and concern for the environment, respectively.
The matrix is immediately and automatically created at the end of the respondent’s evaluations. All the information is available from the study. Once the matrix is created and at any time the data can be totally analyzed since each respondent provides complete data, including the appropriate combinations of elements which allow the researcher to create an individual-level equation for the respondent.
The initial analysis creates 87 individual-level equations, each expressed as: Binary Response (Top2) = k1A1 + k2A2 … k16D4
Note that in this study the additive constant was not estimated. Continuing evaluation of the Mind Genomics methods suggest that the coefficients estimated without the additive constant correlate highly with the coefficients for the same study, this time estimated along with the additive constant. Thus, the patterns would be similar. The key difference is that the coefficients are larger when there is no additive constant. ‘Strong performing’ is here defined as a coefficient of +12 or higher, rather than +8 or higher (the value used when the additive constant is estimated).
The foregoing equation without the additive constant provides a measure of the ability of each element to drive the response. It will be the pattern of coefficients across all 87 individuals which will give us a sense of the nature of two or more groups, separated from each other based on the pattern of the coefficients. Such separation is accomplished by clustering, a way to separate ‘objects’ into non-overlapping groups based upon the patterns of their properties. The 87 rows x 16 columns were subject to a k-means clustering, to divide the respondents (rows) by the pattern of the coefficients [13]. The k-means clustering program works only on the mathematical properties of the dataset, attempting to split the respondents into two groups, and then three groups, so that the centroids of the groups on the 16 elements are as different (distant) as possible, whereas the individuals within a group are similar (close) as close as possible. The measure of distance between people, and between centroids was defined operationally as (1-Pearson R). The Pearson R, or the correlation, takes on the value +1 when two patterns are identical; the distance between them is 1-1, viz., 0. The Pearson R takes on the value of -1 when two patterns are identical; the distance between them is 1- -1, viz., 2.
The values for the coefficients based upon the Top2 (Ratings 9,8 –>100) appear in Table 2. The table shows the elements sorted based upon the values of the two emergent mind-sets, discussed below. The important thing to notice in Table 2 are those elements with coefficients of +12 or higher. Statistical analysis using OLS (ordinary least squares) regression, suggests that coefficients of this magnitude become statistically significant as well as ‘meaningful’ in a real-world sense when the equation is estimated without an additive constant.
Table 2: Coefficients for models relating the presence/absence of the elements to the level of ‘strong agreement’ (rating 9, 8 converted to 100). Strong coefficients (+12 or higher) appear in shaded cells. Coefficients of 5 and below are not shown.
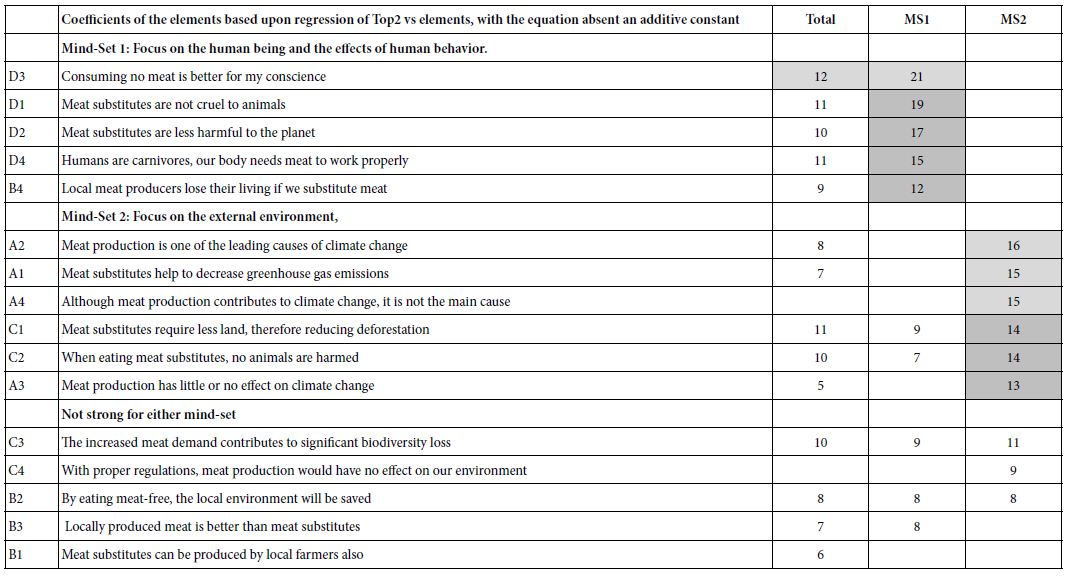
The importance in a Mind Genomics study is not the magnitude of a single element nor its difference from 0, but rather the pattern of coefficients for a single group. When we look at the first data column, corresponding to Total Panel, we fail to see truly strong elements emerging, viz., elements which generate a coefficient of +12 or more. This is not surprising, given the ability of Mind Genomics to uncover groups of individuals with different patterns of coefficients, suggesting different ways of thinking about the same topic. Putting together these different mind-sets into one database ends up attenuating the strong patterns of each.
Table 2 shows the results from the clustering. The two-cluster solution, shown in the second and third data columns, suggests two clearly different mind-sets, groups of individuals who, faced with the same material, think in different ways. Mind-Set 1 focuses on the human being, and the effects of human behavior. Mind-Set 2 focuses on the external environment. Note that in the interest of allowing the patterns to emerge, the table shows coefficients of 12 or higher in shaded cells. There might well be more mind-sets, but for the purposes of this exploratory research two mind-sets suffice to demonstrate the radically different patterns. Extracting the third mind-set did not reveal a new group with a demonstrably new pattern of coefficients.
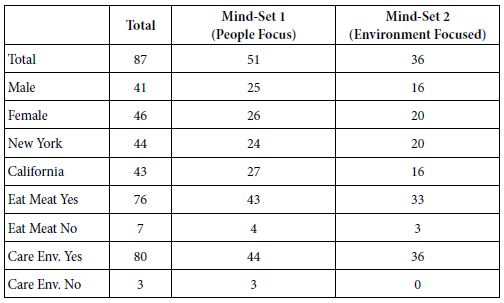
Table 3 shows the self-profiled classification of the respondents in the two mind-sets. The base sizes do not always add to 87 because in some cases the respondents left out the answer to one of the classification questions.
Table 3: Classification of the respondents by gender, market, meat-eating, and concern with the environment
Step 8: Measure Engagement with the Messages Using Response Time
Today’s concern with the environment continues to generate controversy, and emotion. The notion that our omnivore habits are the cause for climate change through animal farming continues to emerge, again and again, both in the popular press and in academic literature [14,15]. With the attention paid to climate, and with the importance of food and the increasing focus on vegetable-based meat, we have an opportunity to investigate the degree to which messages grab the attention of people, engaging them, not through a conscious probe of what they ‘feel’, but rather in the amount of time the person gives to reading, digesting, and then responding to the messages.
The Mind Genomics platform provides a measure of engagement through the response time. Response time is defined as the time elapsing from the moment the stimulus is presented until the moment the respondent. A small prophylactic measure moves all response times of 8 seconds or longer either to 8 seconds (done here) or removes the data point from analysis (not done here). The rationale for this prophylactic measure is that the respondents may be multi-tasking, which would produce a false measure of response time for the vignette.
The model for response time is the same as the model for the transformed rating, viz no additive constant. The 16 coefficients show the number of seconds that can be ascribed to each element, including reading and judging. Table 4 shows these coefficients for the total panel, and for both mind-sets.
Table 4: Response times in seconds attributed to each of the elements, by total panel and two mind-sets. The numbers in the body of the table are the number of seconds attributable to the element.
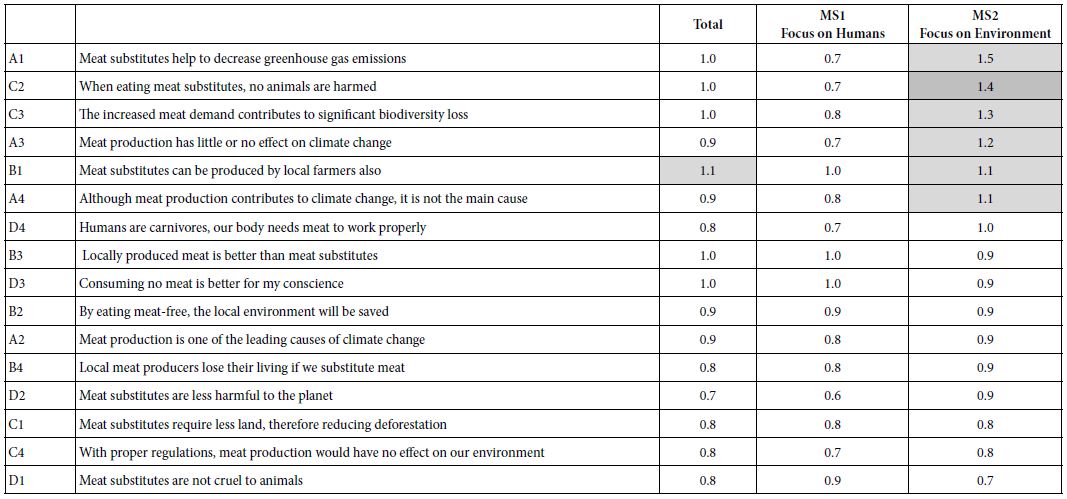
The response times suggest dramatically different patterns of attention. Those respondents in Mind-Set 1, focusing on people and the human aspects, pay little attention to the elements. The only element to which they pay attention is B1, Meat substitutes can be produced by local farmers also (RT coefficient = 1.0). In contrast, those respondents in Mind Set 2, responding to the environment, pay more attention to certain elements, viz., those elements focusing on the environment.
A1 Meat substitutes help to decrease greenhouse gas emissions 1.5
C2 When eating meat substitutes, no animals are harmed 1.4
C3 The increased meat demand contributes to significant biodiversity loss 1.3
A3 Meat production has little or no effect on climate change 1.2
Step 9: How Mind-sets Process Interactions between Pairs of Elements
Our previous analysis focused on the performance of individual elements, showing clear differences between elements according to the two clearly different mind-sets. We saw two radically different mind-sets emerge, differing both in the elements which drive their agreement, as well as the speed at which they process information. These mind-sets focus on topics, but also represent different types of individuals. It would appear from informal observation that people who focus on the climate (Mind-Set 2) seem to be more outwardly verbal about the topic. In contrast, people who focus on the behavior of other individuals (Mind-Set 1) seem to be quiet.
Do these two mind-sets differ in the way they process information? That is, when we provide the respondents with combinations of the same type of elements versus different types of elements, how do they respond to the combination? Do the elements synergize, or suppress each other? Our strategy to assess interactions is called scenario analysis [6]. Scenario analysis follows these steps:
a. Select one question which will define the five different strata. This will be Question B, pertaining to ‘local benefits.’ Two of the four elements from Question B focus on people (B2 Meat substitutes can be produced by local farmers also; B4 Locally produced meat is better than meat substitutes). The remaining two elements from Question B focus on the environment (B1 although meat production contributes to climate change, it is not the main cause; B3 By eating meat-free, the local environment will be saved).
b. Working with the entire database of 87 respondents x 24 rows/respondent, divide the database into five groups or strata, each stratum determined by the specific element from question B. The first stratum comprises all vignettes containing element B1. The second stratum comprise all vignettes containing element B2 and on to the fifth stratum, which contains no element from question B. We will not consider the fifth stratum, those vignettes lacking an element from Question B.
c. We create four equations, one per stratum, relating the presence/absence of the remaining 12 elements to the transformed rating, the dependent variable (DV). The equation is: expressed as: DV=k1(A1) +k2(A2) +k3(A3) +k4(A4) +k5(C1) +k6(C2) + k7(C3) +k8(C4) +k9(D1) +k10(D2) +k11(D3) +k12(D4)
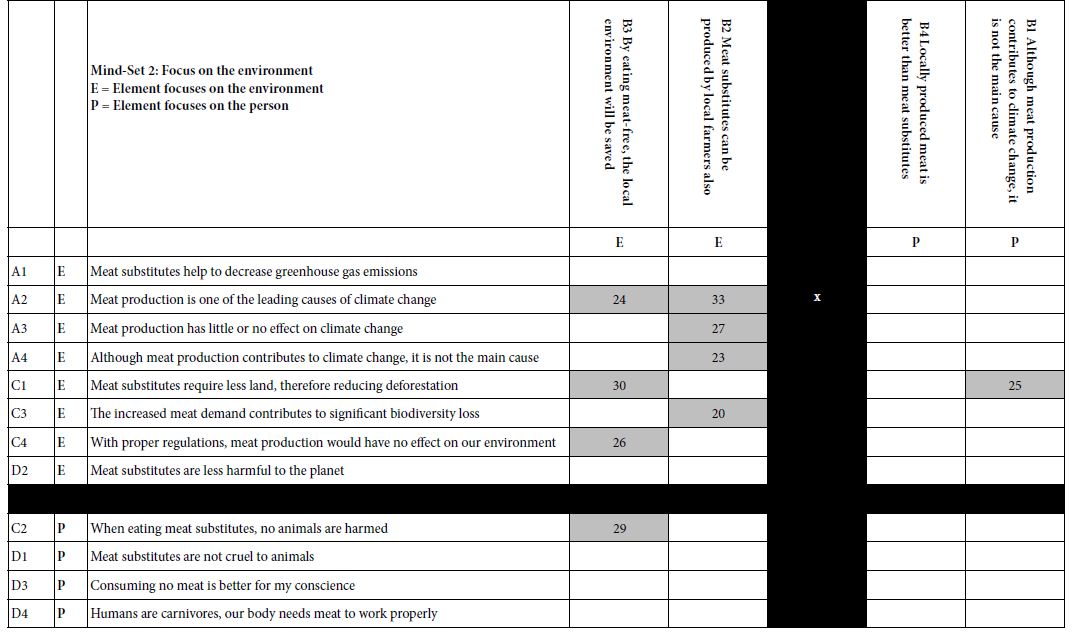
d. Table 5 presents the strong performing coefficients, defined operationally for this table only as a coefficient of +20 or higher. These very strong performing coefficients are presented in shaded cells. The remaining coefficients are suppressed, allowing the patterns to emerge.
Table 5: Scenario Analysis. The coefficients of elements from Questions A, C and D for different ‘strata’ defined by a fixed element from Question B.
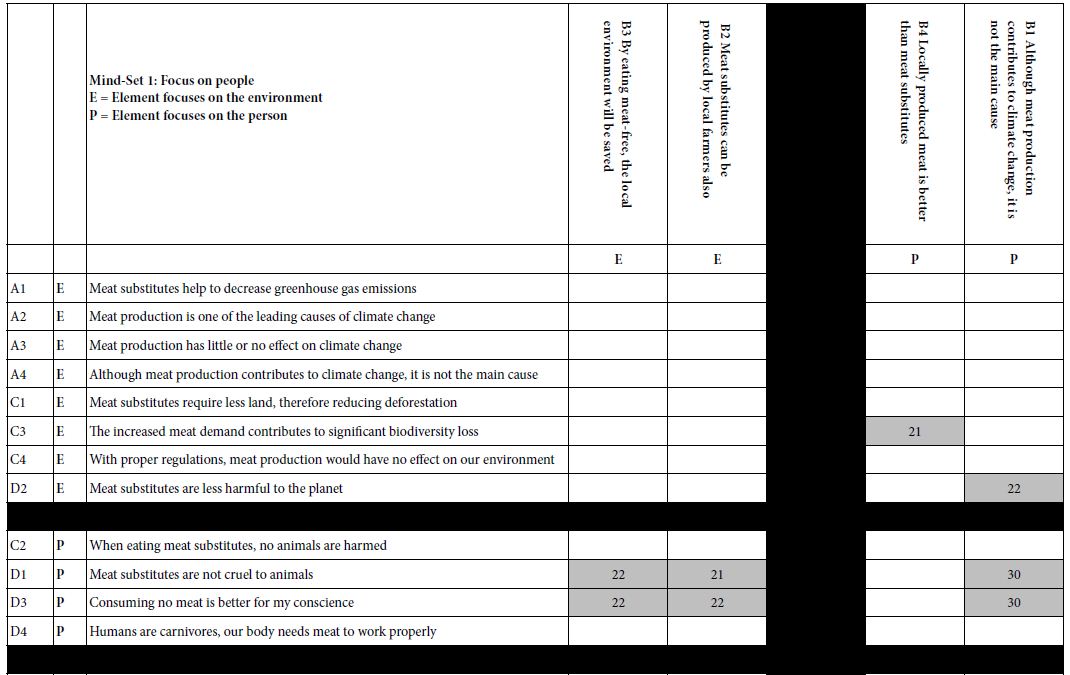
e. For Mind-Set 1 (focus on people), synergisms among elements occur when elements about the person are combined either with other elements about the person, or with elements about the environment. In fact, Mind-Set 1 shows six strong interactions out of 24 possible interactions between pairs of elements, one about environment, the other about the person. Mind-Set 1 seems to be able to take in all the information in the vignette to assign the rating. We do not get a sense of overly-focused perception on the topic of food and the environment.
f. Mind-Set 2 (focus on the environment) thinks differently, showing only two strong interactions out of 24 possible interactions. We get a sense of people in Mind-Set 2 thinking in a more focused manner, looking primarily at the messaging about the environment, not focusing on any other type of message.
Discussion and Conclusions
We can barely listen to the ever-updated business reports without hearing of the successes and now troubles or even failures of companies in this new food ‘space.’ Furthermore, the ability of concerned individuals to invoke issues of great emotionality such as the environment increases the intensity of the noise as it does the intensity of the signal [16].
The Mind Genomics exploration of the intersection of the environment and plant-based meats provides a way for the researcher to understand topics where there may be as much ‘noise’ as there is ‘signal. Mind Genomics studies are run in what might be called a ‘sterile’ fashion, without leading questions, but with test stimuli which may run the gamut from simple factual statements to statements designed to appeal to the emotions, with or without supporting facts. By testing the elements of all types in ever-changing combinations, it becomes possible for the researcher to assess the strengths and weaknesses of these statements as the consumer respondent see them, while preventing the respondent from ‘gaming’ the system. No matter what the mind-set of the respondent may be, the ever-changing combinations mean that the respondent ends up assigning honest ratings, even if the respondent feels that the rating is a ‘guess.’ The data in Tables 2, 4 and 5 reveal a great deal of consistency.
The complexity of thinking around the emotional and ethical response to the topic of ‘plant-based meat’ is staggering. A Google search of the topic of plant-based meat reveals 2.85 million hits, during early February 2023. Going more deeply into the topics of environment versus effect on people, the same topic of ‘plant-based meat’ combined with ‘effect on people’ generates 1.61 million hits. In turn, ‘plant-based meat’ combined with ‘effect on the environment generates 2.06 million hits. One must read a great deal about the topic to begin to intuit the existence of the two mind-sets. In contrast, almost immediately, the Mind Genomics exercise provides a sense of how people organize the topic. From the practical point of view, Mind Genomics provides a path to selecting the information appropriate to present to the audience, once it can be determined the mind-set to which the person belongs. If that capability is not available, then the next strategy is to explore different messages with individuals of known mind-sets, selecting an array of messages likely to appeal to each mind-set, while not alienating the other mind-set.
A search through the published literature confirms what was found in this study, namely that there are at least two different directions of thinking about the topic. On the one hand, there are those papers focusing on people and their intersection with the world of plant-based foods, viz. our Mind-Set 1 [15,17-19]. In contrast, there are those papers which deal with the issues of food and the environment, viz., our Mind-Set 2 [20,21]. What is missing from these papers, however, is the way people think, the nature of how they incorporate information, and how they combine similar types of information versus dissimilar types of information about the topic. It is as if the Mind Genomics approach might provide ‘informational mortar’, to help the other data provide deeper insights [22].
As it is worthwhile finishing this paper with some observations about the role of Mind Genomics in the ‘Project of Science. People are not accustomed to ‘design thinking.’ Most of the ideas which people proffer appear to emerge fully developed, or perhaps seem to require slight modification. There is the mystique that creating a new idea occurs during the almost impossible-to-describe ‘creative leap of faith.’ The likelihood of successfully bringing this leap of faith to business is thought to be by better ‘insights.’ Such insights believed to likely emerge when one uses by focus groups, in-depth interview, ‘creative exercises,’ or gives over the task to people who are deemed to be ‘creatives’, the latter either because of their corporation position or because they score well on a test presumed to measure ‘creativity.’ Creativity is elevated to an art, one which is special, but can be learned.
The elevation of the creative act into almost mystical moments, achievable of course by everyone, means that the mystique must be preserved. It is the thinking, the ‘aha’ experience, which is important. It is the idea, emerging like Venus, almost fully formed, with some need of polishing, which is important. Consequently, much of the research conducted today with consumers is commissioned to validate or falsify a hypothesis, a test of the consumer acceptance of one’s idea in business. It should come as no surprise then that the Russian wisdom is touted again and again; measure nine times cut once. It is at the point of cutting, of making a yes/no decision about the object created that the research effort is executed.
The Mind Genomics approach differs. Mind Genomics can be considered a cartography, an exercise in mapping terrain, terrain which is new, or terrain that has been well trodden but needs new measurement for one or another reason. The implementation of this of mapping exercise occurs in a straightforward manner; present different stimuli to the respondent, measure the reactions to these stimuli, and from the pattern of those reactions identify the driving power of each of the elements to ‘drive; the response. The approach is akin to creating the blueprints of a system, showing through experimentation how the different parts work together to drive the response. The steps are simple, iterative, and powerful in that they deal directly with the relevant stimuli, without having to force interpretation. It is likely that, when implemented in simple, small, affordable experiments like the one reported here, design thinking will prove its value, showing how the system ‘works’, identifying ‘what to do’, and then ‘what to communicate about what one has done.’
References
- Araújo MB, Whittaker RJ, Ladle RJ, Erhard M (2005) Reducing uncertainty in projections of extinction risk from climate change. Global ecology and Biogeography 14: 529-538.
- Bush DM, Neal WJ, Young RS, Pilkey OH (1999) Utilization of geoindicators for rapid assessment of coastal-hazard risk and mitigation. Ocean & Coastal Management 42: 647-670.
- Bonny SP, Gardner GE, Pethick DW, Hocquette JF (2017) Artificial meat and the future of the meat industry. Animal Production Science 57: 2216-2223.
- Demartini E, Vecchiato D, Finos L, Mattavelli S, Gaviglio A (2022) Would you buy vegan meatballs? The policy issues around vegan and meat-sounding labelling of plant-based meat alternatives. Food Policy 111.
- Van Vliet S, Kronberg L, Provenza FD (2020) Plant-based meats, human health, and climate change. Frontiers in Sustainable Food Systems 128.
- Moskowitz HR, Gofman A (2007) Selling Blue Elephants: How to Make Great Products that People Want Before They Even Know They Want Them. Pearson Education.
- Grotjahn M (1950) About The “Third Ear” In Psychoanalysis: A Review and Critical Evaluation of: Theodor Reik’s “Listening with the Third Ear; The. Psychoanalytic Review 37: 56-65. [crossref]
- Jacoby LL, Wahlheim CN, Coane JH (2010) Test-enhanced learning of natural concepts: effects on recognition memory, classification, and metacognition. Journal of Experimental Psychology: Learning, Memory, and Cognition 36: 1441-1451. [crossref]
- Moskowitz HR, Porretta S, Silcher M (2008) Concept research in food product design and development. John Wiley & Sons.
- Moskowitz HR, Reisner M, Lawlor JB, Deliza R (2009) Packaging research in food product design and development. John Wiley & Sons.
- Gere A, Harizi A, Bellissimo N, Roberts D, Moskowit H (2020) Creating a Genomics wiki for non-meat analogs. Sustainability.
- Gofman A, Moskowitz H (2010) Isomorphic permuted experimental designs and their application in conjoint analysis. Journal of Sensory Studies 25: 127-145.
- Likas A, Vlassis N, Verbeek JJ (2003) The global k-means clustering algorithm. Pattern Recognition 36: 451-461.
- Djekic I (2015) Environmental impact of meat industry – current status and future perspectives. Procedia Food Science 5: 61-64. Djekic I (2015) Environmental impact of meat industry – current status and future perspectives. Procedia Food Science 5: 61-64.
- Pimentel D, Pimentel M (2003) Sustainability of meat-based and plant-based diets and the environment. The American journal of clinical nutrition 78: 660S-663S. [crossref]
- Macdiarmid JI, Douglas F, Campbell J (2016) Eating like there’s no tomorrow: Public awareness of the environmental impact of food and reluctance to eat less meat as part of a sustainable diet. Appetite 96: 487-493. [crossref]
- Broad GM (2020) Making meat better: The metaphors of plant-based and cell-based meat innovation. Environmental Communication 14: 919-932.
- Curtain F, Grafenaue S (2019) Plant-based meat substitutes in the flexitarian age: An audit of products on supermarket shelves. Nutrients 11: 2603. [crossref]
- Slade P (2018) If you build it, will they eat it? Consumer preferences for plant-based and cultured meat burgers. Appetite 125: 428-437.
- Joshi VK, Kumar S (2015) Meat Analogues: Plant based alternatives to meat products-A review. International Journal of Food and Fermentation Technology 5: 107-119.
- Siegrist M, Hartmann C (2019) Impact of sustainability perception on consumption of organic meat and meat substitutes. Appetite 132: 196-202. [crossref]
- Saulo AA, Moskowitz HR (2011) Uncovering the mind-sets of consumers towards food safety messages. Food quality and preference 22: 422-432.