DOI: 10.31038/CST.2024924
Abstract
TREM2 is a receptor that interacts with a diverse range of ligands, many of which are characteristic indicators of tissue injury. TREM2 activity is limited to a few specific areas in physiological, but in pathological conditions, the TREM2 pathway becomes crucial for detecting tissue damage and preventing its spread. The TREM2 receptor is a crucial signaling hub in myeloid cells that is activated in response to tissue damage. It plays a key role in immune reprogramming. Studies have demonstrated that TREM2 is involved in regulating immunosuppressive, phagocytosis, survival, and healing functions in myeloid cells associated with neurodegenerative and metabolic pathologies. Although the significance of TREM2 in various diseases is well recognized, there is a lack of study on the relationship between TREM2 and human malignancies. Hence, our understanding of the connection between TREM2 and cancer is currently limited. In this study, we conduct a comprehensive analysis of TREM2 in several datasets including Protein Alta, Blood Alta, The Cancer Genome Atlas (TCGA), and single cell RNA Alta. We investigate the expression of TREM2, analyze its clinical aspects, and perform survival analysis on a variety of cancer patients. This study provides valuable insights into the potential of targeting TREM2 for cancer treatment in the future.
Keywords
TREM2; Pan cancer; Immune Evasion; Lipid Metabolism; Prognosis
Introduction
Recently, the scientific community has focused on the significant functions of myeloid cells in several diseases. Triggering receptor expressed on myeloid cells-2 (TREM2) has been identified as a crucial immunological signaling hub that is activated in these diseases [1- 6]. Scientists and biotechnology businesses are working towards activating TREM2 to induce microglia to engulf and eliminate amyloid-beta (Ab) plaques. The effectiveness of these strategies, currently being evaluated as a therapy for neurodegenerative disease [7,8], may also extend to autoimmune diseases and obesity-related comorbidities [6,9]. For instance, in conditions like atherosclerosis, where TREM2+ macrophages encircle aortic plaques, reactivating these macrophages can promote the engulfment of plaques and regulate inflammation [10]. TREM2 functions by suppressing NF- kappa-B signaling upon exposure to lipopolysaccharide. It enhances phagocytosis [11], reduces the production of pro-inflammatory cytokines and nitric oxide [12], prevents apoptosis, and increases the expression of IL10 and TGFB [13]. During periods of oxidative stress, it enhances the activation of anti-apoptotic NF-kappa-B signaling and ERK signaling [14]. The fundamental concept behind these tactics is to amplify TREM2 signaling through the use of agonistic drugs in order to augment the reparative functions of macrophages and microglia.
In addition to being expressed on immunosuppressive myeloid cells [15-18], there have been reports indicating that tumor cells also express TREM2 [19,20]. TREM2 expression on tumor cells may contribute to the formation of an immunosuppressive and pro-growth niche, working in coordination with myeloid cells for immune inhibition. As a result, T cell infiltration is excluded [21] and the efficacy of immune checkpoint inhibitors is downregulated [21]. Tumor cells also affect, influence, and educate myeloid cells, which in turn favor tumor growth. This interaction creates a cooperative and immunosuppressive environment. The expression and activities of TREM2 on microglia cells have been well elucidated [8,17,22]. Zhang et al. demonstrated that the levels of TREM2 mRNA and protein expression were markedly elevated in gastric cancer samples compared to normal gastric tissues [20,23]. However, they did not attribute the expression of TREM2 to any specific cell type. TREM2 has been proposed as a potential target in glioma and hepatocellular carcinoma. Studies have demonstrated that increased expression of TREM2 is linked to progression and advanced stage of tumors in these types of cancer [24,25].
In this research article, we hypothesized that the expression of TREM2 on tumor cells holds significant implications for tumor treatment and prognosis. Here we present a comprehensive analysis of TREM2 expression across many types of malignancies and normal tissues, with a focus on pan cancer. Our data shows that TREM2 has significant upregulation in various cancer types, particularly in metastatic tumors. Moreover, elevated levels of TREM2 are indicative of unfavorable prognosis outcomes in patients’ overall survival of many tumor types.
Results
TREM2 has Differential Expression Among Tissue Types and Cell Lines
Firstly, we made an all-tissue types expression analysis of TREM2 (Figure 1A). The Consensus Normalized expression (NX) levels were derived by integrating data from three transcriptomics datasets (HPA, GTEx, and FANTOM5) using an internal normalization workflow. These data include in total 55 tissue types and 6 blood cell types. The color-coding system is established according to tissue groups, which are composed of tissues that share similar functional characteristics. The color-coding system is established according to tissue groups, which are composed of tissues that share similar functional characteristics. We found that adipose tissue has the highest degree of TREM2 positivity, followed by brain, and lung, which is in accordance with the knowledge that TREM2 functions for lipid metabolism and M2 type macrophage functions.
Secondly, we wanted to know whether TREM2 are also expressed by blood cell types. The transcript expression levels obtained from the internal normalization pipeline for 18 blood cell types and total peripheral blood mononuclear cells (PBMC) are referred to as Normalized expression (NX). The color-coding system is determined by the lineage of blood cell types, which includes B-cells, T-cells, NK- cells, monocytes, granulocytes, dendritic cells, and total PBMC. An overview of the single cell RNA (NX) data encompassing all sorts of single cells. The process of color-coding involves categorizing cells into groups depending on their functional properties. Cell type analysis shows that Hoffbauer cells have the highest expression of TREM2, followed by Kupffer cells, blood and immune cells, monocytes (Figure 1B). The RNA expression summary provides a consensus of RNA data based on normalized expression (NX) data from three distinct sources: internally generated Human Protein Atlas (HPA) RNA-seq data, RNA-seq data from the Genotype-Tissue Expression (GTEx) project, and CAGE data from the FANTOM5 project.
In order to have a more detailed information of TREM2 expression among different cell types, we made a heatmap to show TREM2 expression in different cell types including B cells, macrophages, neutrophils, T cells and NK cells. Cell type markers were represented by the logarithm of transcripts per million (log(pTPM)) and their corresponding z-scores. The heatmap in this section displays the expression of the currently selected gene (at the top) and well-established markers for different single cell type clusters in this tissue. The left panel displays the cell type with which each marker is connected. The process of color-coding involves grouping cell types based on their shared functional properties (Figure 1C).
The concept of a Z-score involves transforming a variable so that its standard deviation becomes 1 and its mean becomes 0. Therefore, comparing all the genes is simplified due to their shared center and spread (Figure 1).
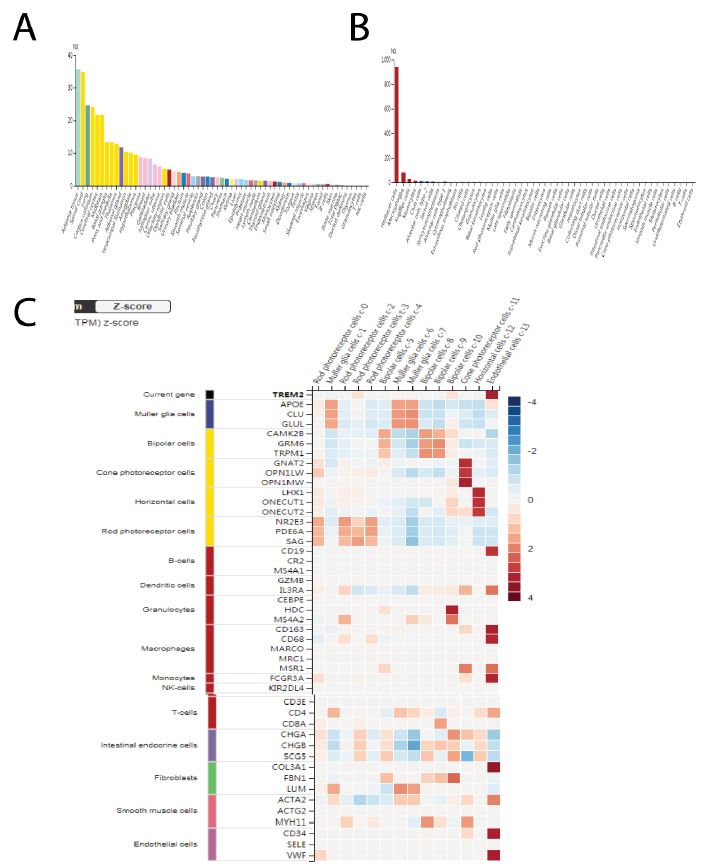
Figure 1: TREM2 has differential expression among tissue types and cell lines. A Pan-tissue type expression analysis of TREM2, different tissue types have a differential expression of TREM2, with adipose has the highest TREM2 expression, followed by brain, and lung. We integrate data from three transcriptomics datasets (HPA, GTEx, and FANTOM5) using an internal normalization workflow. These data include in total 55 tissue types. B TREM2 are also expressed by blood cell types. We showed the transcript expression levels obtained from the internal normalization pipeline for 18 blood cell types. Hoffbauer cells have the highest expression of TREM2, followed by Kupffer cells, blood and immune cells, monocytes. C Heatmap analysis to show TREM2 expression in different cell types including B cells, macrophages, neutrophils, T cells and NK cells.
TREM2 are Highly Expressed by a Variety of Tumors
There are some studies which indicates that TREM2 are expressed by tumor cells. In order to have a more comprehensive idea of TREM2 expression on a variety of tumor types, we made a pan-cancer analysis of TREM2 expression among tumors and normal counterparts. We find that TREM2 are much highly expressed by tumors than the normal counterparts (Figure 2A). The pan-cancer analysis page presents the spectrum of gene expression for TREM2 gene across all tissues, utilizing RNA Seq data obtained from both normal and cancerous tissues. Mechanically, TREM2 promote tumor growth by upregulating PI3K-mTOR. We thus made a correlation between TREM2 and MTOR (Figure 2B). Compared with normal tissues, tumor cells have higher TREM2 and MTOR, supporting the idea that TREM2 facilitate tumor growth by upregulating MTOR and anabolic process.
Metastatic tumors differ from the original tumor site in many ways, usually the metastatic tumor cells are more aggressive and had high capacity for invasion and migration [26,27]. However, whether TREM2 plays a role in tumor metastasis is not clear. We made a comparison of TREM2 gene RNA expression level among normal, tumor and metastatic tumors (Figure 2C-2K). For all tumor types, the metastatic tumor has the highest level of TREM2, compared with the original tumor site, while the normal tissue has the lowest TREM2 RNA level. The Normal, Tumor, and Metastatic analysis offers comprehensive analysis of TREM2 in a specific tissue type utilizing gene chip-based data. Figure 2C-2K are esophageal squamous cancer, skin cancer, ovarian cancer, prostate cancer, thyroid cancer, colon cancer, kidney renal cancer, breast cancer, pancreatic ductal cancer (Figure 2).
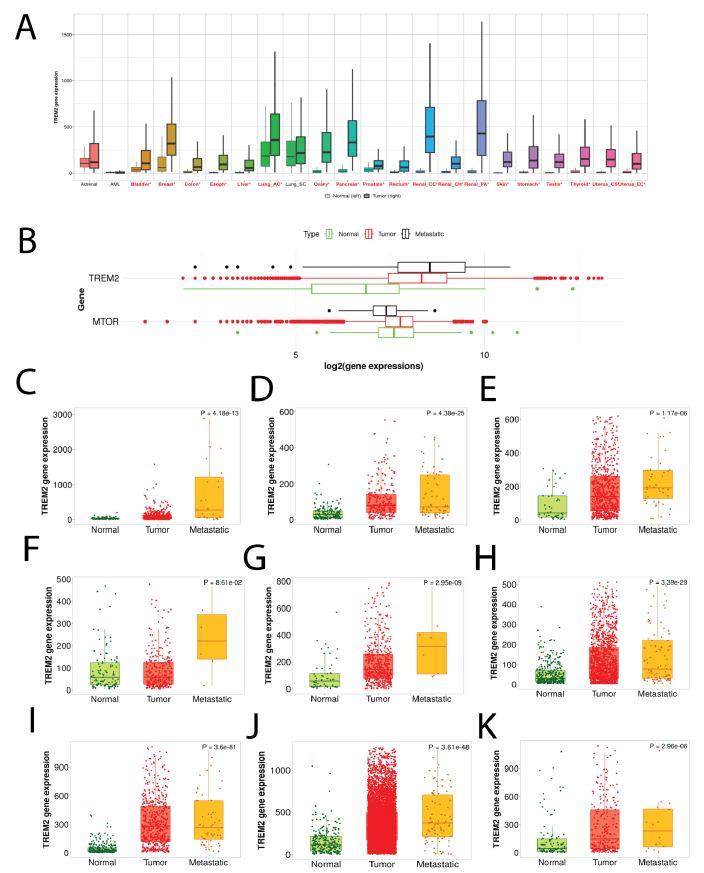
Figure 2: TREM2 are highly expressed by a variety of tumors. A Pan-cancer analysis of TREM2 expression among tumors and normal counterparts. The pan-cancer analysis page presents the spectrum of gene expression for TREM2 gene across all tissues, utilizing RNA Seq data obtained from both normal and cancerous tissues. In most tumors, TREM2 is higher than normal tissues. B Correlation analysis between TREM2 and MTOR shows a positive correlation between the two genes, supporting the idea that TREM2 facilitate tumor growth by upregulating MTOR and anabolic process. C-K TREM2 expression in normal, tumor, and metastatic parts. From C-K they are esophageal squamous cancer, skin cancer, ovarian cancer, prostate cancer, thyroid cancer, colon cancer, kidney renal cancer, breast cancer, pancreatic ductal cancer.
TREM2 has Different Staining Intensity Among Tumors
Although tumor cells usually have higher TREM2 expression level than the normal tissues, there are still some differential TREM2 staining intensity on tumor samples, and we classified them into negative, moderate, and strong. A selection of four standard cancer tissue samples that are representative of the overall staining pattern summarizes antibody staining in 20 distinct malignancies.
We get the TREM2 protein expression data from the Human Protein Atlas, from the immunohistochemical staining results of 4 types of tumors, we can see that tumors exhibit a differential staining intensity of TREM2 (Figure 3A-3D). Moderate cytoplasmic positivity was observed in malignant cells. Numerous cases of breast and colorectal cancer were significantly stained with TREM2 antibody. Several cases exhibited additional membranous positivity.
The percentage of patients (maximum 12 patients) with high and median protein expression levels is indicated by color-coded bars for each cancer. The cancer varieties are color-coded based on the type of normal organ from which they originate (Figure 3).
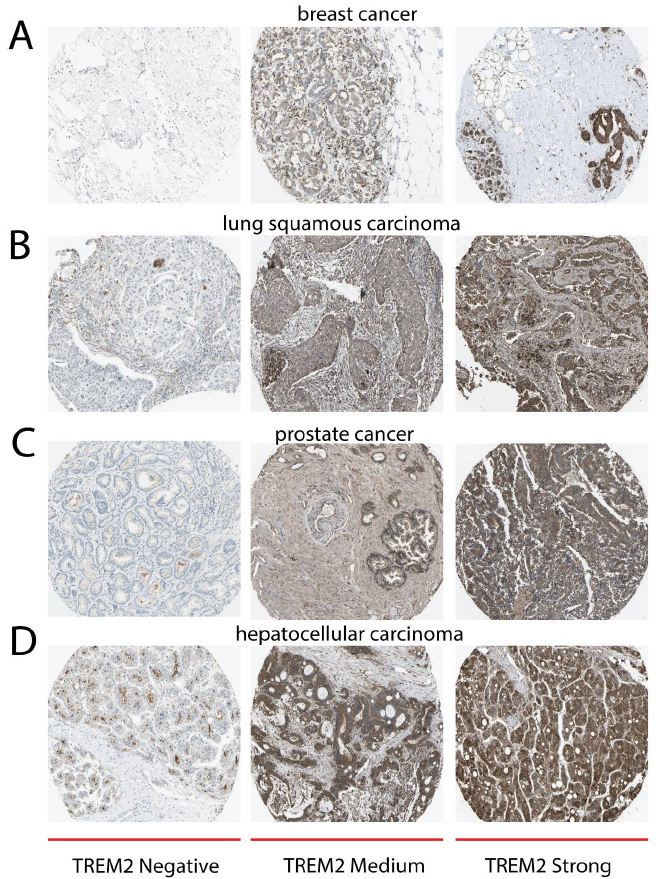
Figure 3: TREM2 has different staining intensity among tumors. All IHC data are from the Human Protein Atlas. A Immunohistochemical staining of TREM2 protein in breast tumor, from left, middle, right they are negative, moderate, and strong TREM2 staining. B Immunohistochemical staining of TREM2 protein in lung squamous carcinoma, from left, middle, right they are negative, moderate, and strong TREM2 staining. C Immunohistochemical staining of TREM2 protein in prostate cancer, from left, middle, right they are negative, moderate, and strong TREM2 staining. D Immunohistochemical staining of TREM2 protein in hepatocellular carcinoma, from left, middle, right they are negative, moderate, and strong TREM2 staining.
High TREM2 Indicates Short Overall Survival in Many Cancer Types
The Survival Scatter plot displays the clinical outcome (i.e., whether the individual is deceased or alive) for all people in the patient cohort, using the same data as the related Kaplan-Meier plots. The x-axis displays the expression levels (FPKM) of the studied gene in the tumor tissue during the initial diagnosis. The y-axis represents the duration of time that has passed since the diagnosis, measured in years. Patients were categorized into two categories, namely “low” (below the cut-off point) or “high” (above the cut-off point), based on their degree of expression (Figure 4A-4H). Figure 4A-4H are breast cancer, esophageal squamous cancer, head and neck cancer, kidney renal cancer, lung adenocarcinoma, pancreatic ductal cancer, stomach adenocarcinoma, testicular germ cell tumor. This survival analysis indicated that high TREM2 expression of tumor cells could predict poor prognosis and short overall survival of patients for many cancer types. The x-axis represents the time of surviving in years, whereas the y-axis represents the likelihood of survival. They present a summary of the link between mRNA expression level and patient survival using Kaplan-Meier plots.
Both axes are accompanied with kernel density curves that illustrate the density of the data along the axes. The density map on the right displays the distribution of data density for the years of survival of deceased patients with both high and low expression levels. The data is divided based on the cutoff indicated by the vertical dashed line in the Survival Scatter plot (Figure 4).
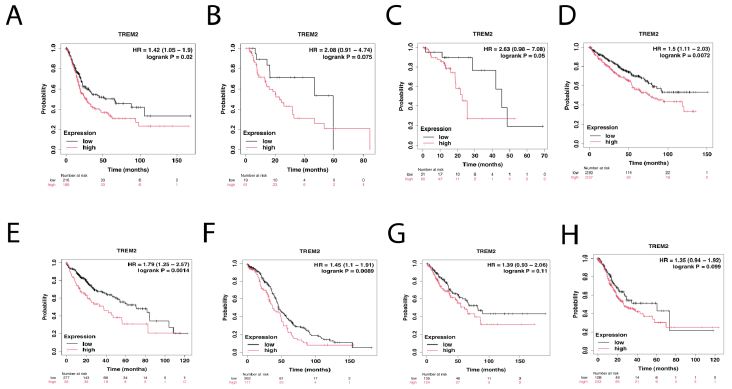
Figure 4: High TREM2 indicates short overall survival in a variety of tumor types. Kaplan-Meier plots analysis of TREM2 expression and patients’ overall survival. Patients were categorized into two categories, namely “low” (below the cut-off point) or “high” (above the cut-off point), based on their degree of expression. From A-D are breast cancer, esophageal squamous cancer, head and neck cancer, kidney renal cancer. From E-H are lung adenocarcinoma, pancreatic ductal cancer, stomach adenocarcinoma, testicular germ cell tumor.
Discussion
TREM2 gene is responsible for encoding an innate immune receptor that belongs to the immunoglobulin family [28]. In humans, this gene is located on chromosome 6, while in mice, it is positioned on chromosome 17 [28]. TREM2 is present on macrophages, dendritic cells, osteoclasts, and microglia [29,30]. The ligands that bind to TREM2 include ApoE, phosphatidylserine, sphingomyelin, Aβ, dead neurons, and damaged myelin [2,31]. TREM2 associates with the adaptor protein TyroBP or DAP12 to create a signaling complex. The process of ligand binding to TREM2 initiates phagocytosis and chemotaxis, while also exerting a negative regulatory effect on TLR- induced inflammatory responses [32,33]. Microglia create a network that covers the central nervous system (CNS) and perform functions such as sensing, maintaining the environment, and protecting against harmful internal and external stimuli. This helps prevent long-lasting inflammation in the brain, which can lead to damage and degeneration of nerve cells [22,34]. The extracellular domain of TREM2 can be secreted as a soluble protein known as sTREM2 (soluble TREM2). The levels of sTREM2 rise with age and under pathological situations.
Microglia lacking the TREM2 protein exhibit heightened autophagy in a mouse model of Alzheimer’s disease [35]. The absence of TREM2 inhibited mTOR activation and triggered compensatory AMPK and ULK1 activation, as well as autophagy, in BMDMs when faced with metabolic stress [36]. The integration of metabolic and RNA-seq data analysis uncovered abnormalities in metabolites and enzymes associated with glycolysis, TCA cycle, and pentose phosphate pathway in TREM2–/– BMDMs.
In contrast to AD, cancer presents a contrasting difficulty. TREM2’s pro-inflammatory and immunosuppressive effects have a negative impact, facilitating tumor development and evasion of the immune system [18]. The approach in cancer treatment involves inhibiting the signaling of TREM2 or removing TREM2+ myeloid cells from the tumor microenvironment. This enables the reactivation of the T cell driven immune response against the tumor. Utilizing anti-TREM2 antibody-dependent cellular cytotoxicity (ADCC) or monoclonal antibodies that function as TREM2 antagonists to reverse the immune-suppressive milieu of myeloid cells is a prominent and promising approach in cancer immunotherapy. Shi- Ting Li discovered that the expression of TREM2 was considerably higher in glioma tissues compared to non-tumorous brain tissues. Moreover, the expression of TREM2 exhibited a strong correlation with the pathological grade and overall survival of glioma patients [17].
CD8+ cytotoxic T lymphocytes play a crucial role in regulating tumor growth by eliminating cancer cells that display major histocompatibility complex class I molecules. Nevertheless, there is a communication of immune suppression occurring between cancer cells and other cell types present in the tumor microenvironment (TME), including cancer-associated fibroblasts, regulatory T cells, and M2-polarized macrophages. This communication leads to the inhibition of the immune response carried out by CD8+ T cells. Analysis of human tumor samples from various primary carcinomas, such as skin, liver, lung, breast, bladder, colon, stomach, pancreas, and kidney, has revealed the presence of TREM2+ macrophages in 75% of the samples. This suggests that TREM2 expression may play a role in the development of an immunosuppressive phenotype. TREM2 promotes phagocytosis and decreases the release of pro- inflammatory cytokines by macrophages, hence playing a role in regulating the immune response during infection. Existing evidence indicates that the expression of TREM2 on cells of the monocyte- macrophage lineage may have an immunoregulatory function in cancer by promoting an immunosuppressive environment [21].
TREM2 is expressed by many cell types present in the tumor microenvironment (TME). TREM2 may possess tumor cell intrinsic capabilities, in addition to its role in stromal cells and fibroblasts, that can either suppress or promote tumor growth, depending on the specific kind of cancer. Hence, it is crucial for us to gain a deeper comprehension of the processes by which TREM2 influences tumor suppression or oncogenic behavior in various cancer types.
The inhibition of TREM2 in the U87 and U373 glioma cell lines led to a substantial decrease in cell proliferation, migration, and invasion. The absence of TREM2 in glioma resulted in a notable upregulation of cleaved caspase 3 and Bax, accompanied by a downregulation of Bcl2, MMP2, MMP9, CXCL10, and CXCR3.
Our work unveils a universal expression of TREM2 by many tissues and cell types, by tumor cells and especially metastatic tumors. Furthermore, high expression of TREM2 is often indicative of short overall survival for many cancer types. Tumors with high TREM2 usually have high MTOR activity and hence promote tumor growth in this way. By gaining more knowledge about the signaling pathway, the genes that are affected by it, and the regulators of TREM2 expression, we may discover new targets and different approaches by targeting TREM2.
Availability of Data and Materials
The data generated in the current study can be obtained from the corresponding author at 109274952@qq.com.
Authors’ Contributions
Ruimin Wang and Rui Wang were responsible for the conception and design. Yuan Fang and Jingqiu Zhang conducted the data analysis and interpretation. Ruimin Wang composed the manuscript, which was subsequently revised by Jingqiu Zhang. The final manuscript was approved by all authors who read and reviewed it.
Acknowledgement
None
Grant Support
Rui Wang is sponsored by the China Scholarship Council (202206920039). The research received financial support from the Natural Science Foundation of Suqian Science and Technology Bureau (K201903, Z2018076, Z2018213, and Z2022065). Jiangsu Association for Science and Technology (JSTJ-2022-004).
Patient Consent for Publication
Not applicable
Competing Interests
The authors indicated no potential conflicts of interest.
References
- Xiong D, Y Wang and M You (2020) A gene expression signature of TREM2hi macrophages and γδ T cells predicts immunotherapy response. Nature Communications 11(1) [crossref]
- Hsieh CL (2009) A role for TREM2 ligands in the phagocytosis of apoptotic neuronal cells by J Neurochem, 109(4): 1144-56. [crossref]
- Wang E (2019) A Subset of TREM2(+) Dermal Macrophages Secretes Oncostatin M to Maintain Hair Follicle Stem Cell Quiescence and Inhibit Hair Cell Stem Cell, 24(4): 654-669.e6. [crossref]
- Schlepckow K (2017) An Alzheimer-associated TREM2 variant occurs at the ADAM cleavage site and affects shedding and phagocytic EMBO Mol Med, 9(10): 1356-1365. [crossref]
- Wang S (2020) Anti-human TREM2 induces microglia proliferation and reduces pathology in an Alzheimer’s disease J Exp Med, 2020. 217(9) [crossref]
- Sharif O (2021) Beneficial Metabolic Effects of TREM2 in Obesity are Uncoupled from its Expression on Macrophages. Diabetes [crossref]
- Gisslen M (2019) CSF concentrations of soluble TREM2 as a marker of microglial activation in HIV-1 Neurol Neuroimmunol Neuroinflamm, 6(1): e512. [crossref]
- Kiialainen A (2005) Dap12 and Trem2, molecules involved in innate immunity and neurodegeneration, are co-expressed in the Neurobiol Dis, 18(2): 314-22. [crossref]
- Liu C (2019) TREM2 regulates obesity-induced insulin resistance via adipose tissue remodeling in mice of high-fat feeding. J Transl Med, 17(1): 300.[crossref]
- Endo-Umeda K (2022) Myeloid LXR (Liver X Receptor) Deficiency Induces Inflammatory Gene Expression in Foamy Macrophages and Accelerates Arterioscler Thromb Vasc Biol, 42(6): 719-731.[crossref]
- Khantakova D, S Brioschi and M Molgora (2022) Exploring the Impact of TREM2 in Tumor-Associated Macrophages. Vaccines (Basel) 10(6) [crossref]
- Sessa G(2004) Distribution and signaling of TREM2/DAP12, the receptor system mutated in human polycystic lipomembraneous osteodysplasia with sclerosing leukoencephalopathy dementia. Eur J Neurosci, 20(10): 2617-28.[crossref]
- Yi S,(2020) IL-4 and IL-10 promotes phagocytic activity of microglia by up-regulation of Cytotechnology, 72(4): 589-602. [crossref]
- De Veirman K(2019) Myeloid-derived suppressor cells induce multiple myeloma cell survival by activating the AMPK Cancer Lett, 442: 233-241.[crossref]
- Daws MR (2001) Cloning and characterization of a novel mouse myeloid DAP12- associated receptor family. Eur J Immunol, 31(3): 783-91. [crossref]
- Katzenelenbogen Y (2020) Coupled scRNA-Seq and Intracellular Protein Activity Reveal an Immunosuppressive Role of TREM2 in Cancer. Cell, 182(4): 872-885.e19. [crossref]
- Neumann H. and K Takahashi (2007) Essential role of the microglial triggering receptor expressed on myeloid cells-2 (TREM2) for central nervous tissue immune J Neuroimmunol, 184(1-2): 92-9. [crossref]
- Nakamura K and MJ Smyth (2020) TREM2 marks tumor-associated Signal Transduct Target Ther, 5(1): 233. [crossref]
- Li C (2021) High expression of TREM2 promotes EMT via the PI3K/AKT pathway in gastric cancer: bioinformatics analysis and experimental verification. J Cancer, 12(11): 3277-3290. [crossref]
- Zhang X(2018) High TREM2 expression correlates with poor prognosis in gastric Hum Pathol 72: 91-99. [crossref]
- Zhang H (2022) Immunosuppressive TREM2(+) macrophages are associated with undesirable prognosis and responses to anti-PD-1 immunotherapy in non-small cell lung cancer. Cancer Immunol Immunother 71(10): 2511-2522. [crossref]
- Suarez-Calvet M (2016) Early changes in CSF sTREM2 in dominantly inherited Alzheimer’s disease occur after amyloid deposition and neuronal injury. Sci Transl Med 8(369): 369ra178. [crossref]
- Li C (2021) High expression of TREM2 promotes EMT via the PI3K/AKT pathway in gastric cancer: bioinformatics analysis and experimental verification. J Cancer 12(11): 3277-3290. [crossref]
- Overexpression of TREM2 enhances glioma cell proliferation and invasion: a therapeutic target in human glioma. [crossref]
- Zhou L (2022) Integrated Analysis Highlights the Immunosuppressive Role of TREM2(+) Macrophages in Hepatocellular Front Immunol 13: 848367. [crossref]
- Nguye B (2022) Genomic characterization of metastatic patterns from prospective clinical sequencing of 25,000 Cell, 185(3): 563-575.e11. [crossref]
- Ndlovu MN (2009) Hyperactivated NF-{kappa}B and AP-1 transcription factors promote highly accessible chromatin and constitutive transcription across the interleukin-6 gene promoter in metastatic breast cancer Mol Cell Biol, 29(20): 5488-504. [crossref]
- Deczkowska A, A Weiner and I Amit (2020) The Physiology, Pathology, and Potential Therapeutic Applications of the TREM2 Signaling Pathway. Cell, 181(6): 1207-1217. [crossref]
- Paloneva J (2003) DAP12/TREM2 deficiency results in impaired osteoclast differentiation and osteoporotic features. J Exp Med. 198(4): 669-75. [crossref]
- Humphrey MB (2006) TREM2, a DAP12-associated receptor, regulates osteoclast differentiation and function. J Bone Miner Res 21(2): 237-45. [crossref]
- Ferrara SJ (2021) TREM2 is thyroid hormone regulated making the TREM2 pathway druggable with ligands for thyroid hormone receptor. bioRxiv, [crossref]
- Hamerman JA (2006) Cutting edge: inhibition of TLR and FcR responses in macrophages by triggering receptor expressed on myeloid cells (TREM)-2 and J Immunol, 177(4): 2051-5. [crossref]
- Hamerman JA (2016) Negative regulation of TLR signaling in myeloid cells— implications for autoimmune diseases. Immunological reviews, 269(1): 212-227. [crossref]
- Gratuze M, C Leyns and DM Holtzman (2018) New insights into the role of TREM2 in Alzheimer’s Mol Neurodegener, 13(1): 66.
- Li C (2019) TREM2 inhibits inflammatory responses in mouse microglia by suppressing the PI3K/NF-kappaB Cell Biol Int 43(4): 360-372. [crossref]
- Ulland TK (2017) TREM2 Maintains Microglial Metabolic Fitness in Alzheimer’s Cell 170(4): 649-663.e13. [crossref]