Abstract
We show the loss of land ice mass is determined not by global warming but by seismic activity and thus neither supports nor rebuts global warming theories.
Keywords
Loss of land ice mass
Recent article claims that land ice loss has been reversed and so might be global warming. Figures 1, 3 show that the distribution of land ice loss in Greenland and Antarctica mimics the distribution of coastal seismic activity, strongly suggesting that the primary factor aecting land ice loss is not temperature but the coastal seismic activity. As Figure ?? shows, the Arctic sinkholes of the past 30 years appeared almost antipodal to the centers of Antarctic ice loss. Specially, the largest loss of ice mass in Antarctica occurs in and close to Amundsen Sea sector, almost antipodal to Taymyr, Kara Sea, and Novaya Zemlya.
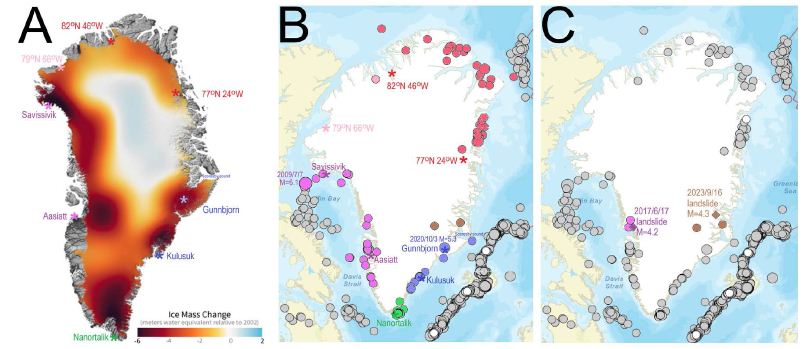
Figure 1: Map A shows GRACE and GRACE-FO observations of Greenland land ice mass change in 2002 2023, according to NASA. MapB shows magnitude ⩾4.0 earth quakes in 60.3°N-84°N, 70°W-10°W in 1997/1/1 2025/6/1. Map A is shown in the projection employed by NASA, while map B is shown in the projection employed by USGS. For the ease of comparison, each map shows the towns of Savissivik, Aasiatt, Nanortalik, Kulusuk, mount Gunnbjorn, points 77°N, 24°W, 82°N, 64°W, 79°N, 66°W, all marked with asterisks, as well as Scorse by Sound. Coastal earthquakes are marked with different colors, while quakes removed from the coast are shown in gray. The regions of large ice loss around Savissivik and Aasiatt and the region between the two towns with somewhat lesser ice loss correspond to earthquakes marked purple. The region of large ice loss around Nanotalik corresponds to earthquakes marked green. The region of large ice loss around Kulusuk, Gannbjorn corresponds to earthquakes marked blue. The region of medium ice loss between points 77°N, 24°W, 82°N, 64°W corresponds to earthquakes marked orange. The region between Scorse by Sound and 77°N, 24°W shows no ice loss, nor does it show any earthquakes. The region between points 82°N, 64°W and 79°N, 66°W shows only small ice loss, and only one earthquake. Map C is a copy of map be showing two largest landslides; the 2017/6/17 landslide was just next to two purple quakes, while the 2023/9/16 one was close to the two quakes marked brown.
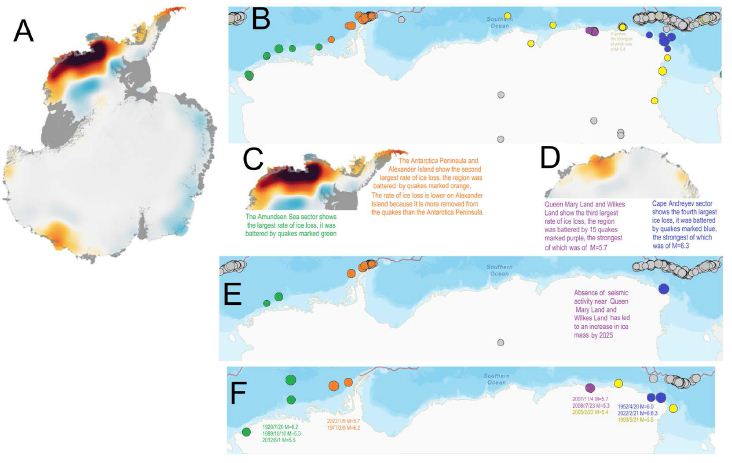
Figure 2: MapA shows GRACE and GRACE-FO observations of land ice mass change in Antarctica, according to NASA. Map B shows magnitude⩾4.0 earth-quakes south of 62°S in 1997/1/12025/6/1. Map A is presented in the projection selected by NASA, while map B is presented in the projection selected by USGS. Images C and D are parts of map A placed under the corresponding portions of map B. The largest rate of ice loss is on the Amundsen Sea sector. The second largest rate of ice loss is on the Antarctica Peninsula and Alexander Island 71°S, 70°W, The third largest rate of ice loss in Antarctica is in Queen Mary Land and Wilkes Land. The fourth largest rate of ice loss in Antarctica is CapeAndreyev.MapEshowsmagnitude⩾4.0 earthquakes south of 62°S in 2015/1/12025/6/1. It shows no earthquakes in Queen Mary Land and Wilkes Land, the region has experienced most ice gain in 2021-2023. Map F shows all magnitude ⩾5.3 earthquakes in 19002024 south of 64°S; it reveals that the centers of coastal seismic activity practically coincide with the centers of ice loss.
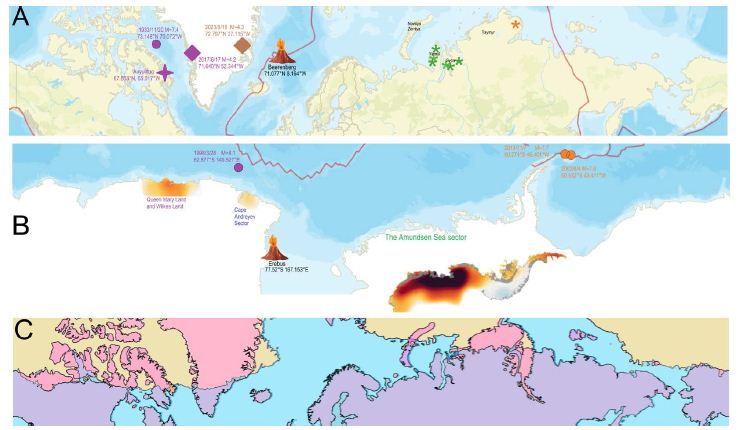
Figure 3: Map A shows the 2017/6/17 landslide in Nuugaat-siaq, 71.535°N 53.2125°Wand the 2023/9/16 landslide in Dickson Fjord, 72.833°N, 26.95°W from Figure 1-C, marked by diamonds; recently-formed sinkholes in the Gyda, Yamal peninsulas, as well as one in Taymyr peninsula at ≈75.5°N, 108°E, marked by asterisks ⋆; an unusual melting in Auyuittuq NationalPark 67.883°N, 65.017°W in the summer of 2008, marked by a four-point star; the northernmost volcano Beerenberg; and the most powerful earthquake north of 64°N. Map B shows the southernmost volcano Erebus; three most powerful earthquakes south of 60°S; and the regions of ice loss from Figure 3.Map C shows the antipode of Antarctica contour superimposed on the contours of the Arctic.
The two volcanoes are almost antipodal to each other, as are the 1933/11/20 and 1998/3/28 earthquakes. The Amundsen Sea sector of ice loss is almost antipodal to the recently-formed sinkholes Gyda and Yamal peninsulas; as well as the Novaya Zemlya and Severnaya Zemlya archipelagos, which, according to the University of Edinburgh, experienced the largest loss of ice in the Russian Arctic in 20102018. Antarctica Peninsula and Alexander Island 71S, 70W, which showed the second largest rate of ice loss, are almost antipodal to the recently-formed sinkhole in Taymyr. Queen Mary Land and Wilkes Land, which showed the third largest rate of ice loss, is almost antipodal to the 2017/6/17 landslide and Auyuittuq National Park. The fourth largest rate of ice loss in Antarctica is almost antipodal to the 2023/9/16 landslide and the giant oods around 71.08N,26.83W in the Scores by Sound70.5N,25W (Figure 4).
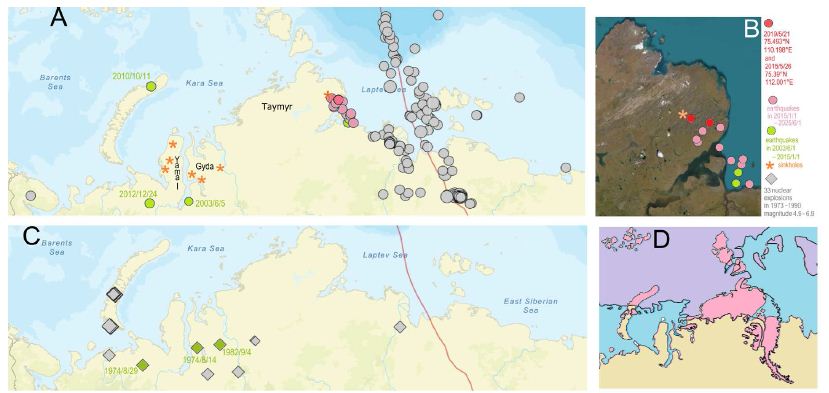
Figure 4: Map A shows magnitude ⩾3.9 earthquakes in 66°N−80°N, 34°E−180°Ein 2003/6/12025/6/1 along with sink-holes discovered after2015/5/1. Map B zooms in on the Taymyr peninsula. Map C shows all nuclear explosions in the region in 1973-1990, there have been no nuclear explosions in the region since. Map C is just a part of Figure3-C. The sink holes in Yamal are within the triangle formed by the 3 earthquakes around it, but the sinkhole in Gyda are not.
However, the sinkholes in Gyda are just north of nuclear explosions shown. The Taymyr sinkhole, it seems to be a harbinger of the earthquakes to hit Taymyr shortly. Prior to 2003/6/1, only two quakes of that magnitude are known to have hit Taymyr, one on 1986/5/19, the other one on 1990/6/9 (Figure 5).
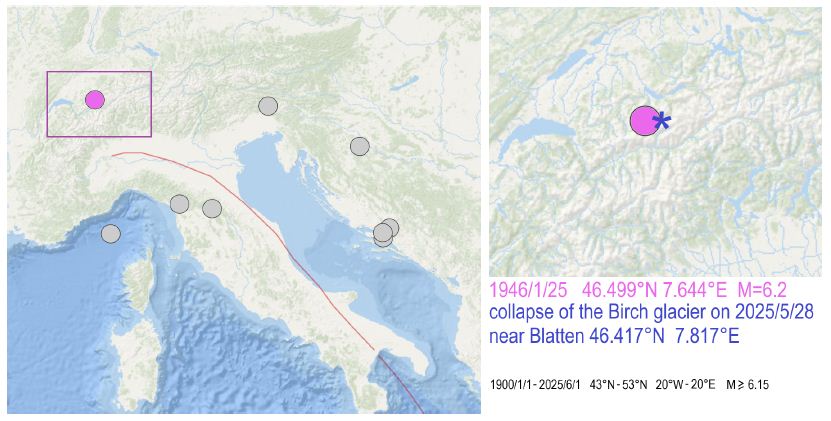
Figure 5: On 2025/5/28, a huge portion of a glacier in the Swiss Alps had broken from the mountainside and crashed onto the village of Blatten at 46.417°N, 7.817°E, shown by an asterisk, approximately 16 km from the epicenter of the 1946/1/25 magnitude 6.2 quake at 46.499°N, 7.644°E, shown by a disk. Although the earthquake struck in 1946, smaller quakes in the region have not stopped until now; e.g. 2016/10/24 46.421°N 7.576°E magnitude 4.4, 2024/6/4 47.085°N 8.796°E magnitude 4.2, etc., not to mention numerous magnitude ⩽4.0 quakes.
WL-QML, almost antipodal to Ban Island and Greenland, not too far from the earthquakes in Figure ??-A. The Taymyr-Kara Sea-Novaya Zemlya region has been also marked by recently formed sinkholes. Figure 3 suggests that the much-larger-than-average loss of ice mass and the appearance of sinkholes are due to subglacial/subperma frost thermal activity most likely caused by seismicity. Figures ??, 1 con rm that the regions of ice loss mimic seismic activity in Antarctica as well as Greenland; the events in Greenland and Ba n Island marked in Figure 3A occurred near the regions of increased seismicity in Figure 1. NASA does not provide any information about ice mass loss along the arctic boundary of Russia, however, Figure 4 suggests that the recently-formed sinkholes are also related to seismic activity. That ice loss, in one form or another, may be caused by quakes, contemporaneous or precedent, is supported by Figure 5 and the 1958/7/10 UTC time (1958/7/9 local time) massive landslide caused by a magnitude 7.8 quake.