Abstract
The wide use of water from the conserved Osun-Osogbo Grove for domestic, traditional, and medical uses by indigenes necessitated the assessment of the biochemical quality of water. This study assesses the presence of water-soluble vitamin, phosphate, nitrate, amino acid, hormone, and trace metal. Water samples were taken from two different sites before, during, and post Raining sessions (April 2017-September 2019). The samples were analyzed using High-Performance Liquid Chromatography (HPLC), Gas Chromatography-Mass Spectroscopy (GC-MS), and Atomic Absorption Spectrometer (AAS). Trace metal analysis revealed an average of 0.009-0.079 mg/Kg Zinc from site one and lower in site two. The mean value of manganese at both sites was virtually the same at 0.018-0.313 mg/kg, aluminum content was 0.045-0.179 mg/Kg at site one, 0.050-0.192 mg/kg at site two, cobalt was 0.024 mg/kg at site one, 0.026 mg/kg at the site two while nickel was 0.006 mg/kg and 0.004 mg/kg for site one and two respectively. HPLC analysis shows mean Methionine content at both sites is higher than the FDA standard value of 56.6 µg/mL; site one had 74.41 µg/mL while site two had 57.11 µg/mL. The mean values of two water-soluble vitamins; Thiamine (B1) was 3.758 mg/Kg and 2.355 mg/Kg while Pyridoxine (B6) was 0.108 mg/Kg and 0.072 mg/Kg at site one and two. GCMS analysis of steroidal content revealed values below LOEL, testosterone (4.8 ng/L), and estrogen (2.4 ng/L) were still elevated while ethinylestradiol and estriol were ≥1.5 ng/L. Generally, in both sites, varying quantities of different micronutrients were detected. This study identified for the very first time the presence of water soluble vitamin, phosphate, nitrate, amino acid, hormone, and trace metal dissolved in the conserved grove water that has served as major source of water for the community from historical days especially to devotees and indigenes.
Keywords
Water profiling, Osun River, Micronutrient, Trace metal
Introduction
Generally, all water bodies be it groundwater, surface water or any other forms, have other chemical components dissolved in it. Water contains small amounts of gases, minerals and organic matter of natural origin [1]. Since water acquires its constituents from contact with rocks, soil and the environment, it is natural therefore to detect other constituents in drinking water that are occurring naturally. Drinking water supplies may contain some of these essential minerals naturally or through deliberate or incidental addition. Prominent amidst these constituents are micronutrients, which are required by organisms throughout life in minute quantities to orchestrate a range of physiological functions. These may include; vitamins, amino acids, minerals as well as metals of enzymatic importance contributing significantly to the sustenance of lives. Micronutrients are vital for the proper functioning of all the body systems, enabling the body to produce enzymes, hormones, and other substances essential for proper growth and development. Although required in minute quantities, absence or decrease in quantities below body requirements may have consequences ranging from mild to severe [2]. The Osun river-water is one of the peculiar water bodies in Southern western Nigeria. The river has a lot of myth around it, prominent of which is the therapeutic potentials of the water which has raised concern in the scientific circle and thus leading to several research documentation on the heavy metal constituent and the postulation that the water is not safe for drinking and general usage as it may constitute health consequences [3-5]. As against previous reports which concentrated on Heavy metals, our group explore the beneficial content of the widely used Osun River water, this was necessitated by the fact that despite scientific reports, indigenes and devotee kept using the water, all background checks showed there were no proclaimed scientific hazard, thus we evaluated the water from beneficial point of view with believe that our findings might support the traditional and domestic use of this water. Therefore, this study postulate, that the therapeutic constituents of the Osun river-water supersede the toxic constituents. To verify this, we evaluate the physico-chemical properties, metabolic metals, vitamins (thiamin B1, riboflavin B2, pyridoxine B6, biotin B7 and cobalamin B12), methionine and oestrogen contents in the Osun River water.
Method
Sampling Area
This was conducted within the Osun-Osogbo Sacred grove, which is located along the bank of Osun River in Osogbo capital city of Osun State, South Western Nigeria. It is located on latitude of 7°45’05.9″N and longitude of 4°33’03.9″E, 250 km north of Lagos, land size of 75 hectares and about 350 m above sea level as indicated in Figure 1. The Groves houses hundred shrines, sculptures and it is the world heritage site [6,7].
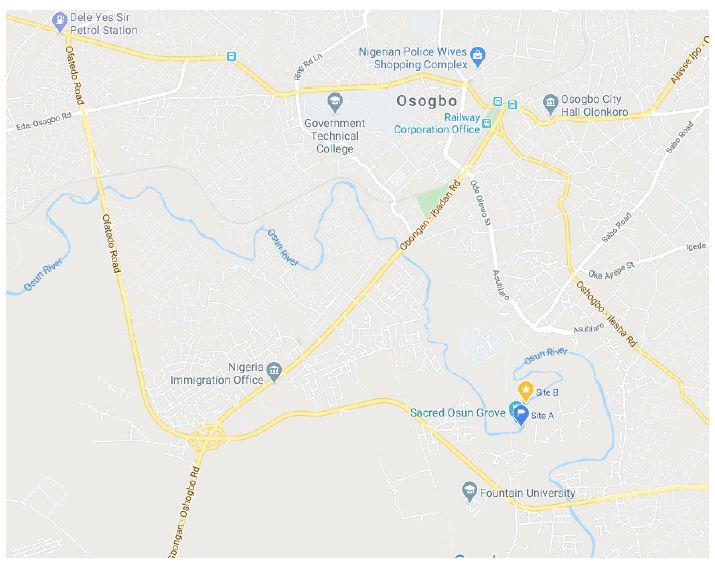
Figure 1: Graphical location of sampling location along the Osun River Path.
Source: Map Data@2020 (maps.google.com).
Collection of Water Samples
Water samples were collected from two locations namely; in the conserved region (Site X) of the Grove, with limited human activities (7°45’03.9″N and longitude of 4°33’03.9″E) and outside the Grove, where there are unlimited activities, Site Y (7°45’12.2″N 4°33’05.4″E) between April 2017-September 2019 at 7 am. Sample collection was subdivided to three, about 1000 mL each of water samples were collected in containers previously soaked in 10% HCL, washed with phosphate-free detergent, dried and pre-calibrated polythene screw capped plastic bottles. The remaining two portions were collected in clean High-Density Polyethylene (HDPE) dark bottles for vitamins analysis, amino acid assay as well as hormone content. All collected samples were immediately transported to the Molecular Biology and Genetic Diversity Research Laboratory, Biochemistry Unit, Department of Chemical Sciences, Fountain University Osogbo. The samples were then maintained at 4°C until required for analysis.
Water Analysis
Physico-chemical Analysis
Macroscopic Examination of Water Samples
This was performed using the protocol described by Sharif et al., [8]. It involves virtual and sensory evaluation of water samples in terms of color; odour and the presence of foreign matters were observed.
pH Determination
pH values of water samples were determined as described by Raphael and Emmanuel (2019) [9]. Prior to analysis, acidic and alkaline buffer solutions of pH 4 and 7 were used for calibration of the pH meter to optimize procedure. pH values of water samples were determined and pH values of less than 7 were deemed acidic, pH=7; neutral and greater than 7, alkaline.
Metal Analysis
Water samples were filtered through a 0.22 µm polypropylene Calyx capsule filter and collected in Low-Density Polyethylene (LDPE) bottles. Samples were further acidified to pH < 2 using ultrapure grade Hydrochloric Acid (HCl), and stored at 20°C for at least one month before extraction [10]. Afterwards, samples were analyzed using Atomic Absorption Spectrophotometer (AAS) as described by Smith [11].
Vitamins and Methionine Analysis
This was performed using the liquid chromatographic method as described by Cortés-Herrera et al., [12]. Water samples for vitamin and methionine analysis were filtered through 0.22 µm polypropylene Calyx capsule filters and collected in High-Density Polyethylene (HDPE) dark bottles and stored frozen until analysis. Dissolved B-vitamins and methionine were extracted and pre-concentrated in solid-phase extraction onto a C18 resin before analysis.
Nutrients Analysis
Phosphate and nitrate analysis were performed according to the protocol described by Environmental Protection Agency [13].
Phosphate Analysis
Standard solutions were prepared by accurately measuring 10 mL of the stock solution into a 250 mL volumetric flask and made up to volume with distilled H2O. Varying volumes of the standard were then measured (5 mL, 10 mL, 15 mL, 20 mL and 25 mL) into separate labeled 100 mL volumetric flasks. The test water sample was diluted by a factor 10, before 25 mL of diluted sample was been transferred to a 100 mL volumetric flask, then made to mark using dilute distilled water. All solutions were kept for 30 minutes to allow colour development before reading absorbance at 880 nm. Concentrations of the test samples were calculated from the standard curve.
Nitrate Analysis
Standard solutions were prepared by measuring 2 mL of the stock solution and made up to a 100 mL with distilled water. Varying volumes of the standard were measured into as separate beaker then interfering organic and metallic substances were removed by treating with 20 mL mercury (II) chloride solution. Two different volumes of each test sample were also subjected to similar treatment. The pH of all samples was adjusted to 11 with 50% sodium hydroxide (NaOH) and then filtered to remove insoluble pellet. The initial flow through was discarded before allowing complete filtration. Then 2 mL of each filtrate was transferred into a beaker, and 1 mL of 1% sodium salicylate solution was added, mixed well, and left to evaporate to dryness. It was later dried in the oven for 20 minutes at 105°C.
Oven incubated samples were allowed to cool to room temperature, and then dissolved with 2 mL concentrated tetraoxosulphate (VI) acid (H2SO4), 15 mL distilled water was added after the solution had cooled to room temperature followed by addition of 15 mL of the sodium hydroxide-potassium sodium tartrate. The mixture was allowed to stand at room temperature for one hour and absorbance read at 420 nm.
Oestrogen Analysis
River-water samples were prepared and analyzed as described by Xiao et al 2001 using 8 ng/L estradiol II as internal control in each calibrated sample. The samples were then subjected to 131 GCMS using the spitless technique, using 0.75 min period on an HP-5MS capillary column (15 m 132 x 0.25 mm I.D., 0.25 mm film thickness) and 5% diphenyl – 95% dimethyl siloxane liquid phase. The oven temperature was maintained at 65°C for 1 min and then programmed to 220°C at 40°C per min, then to 255°C at 5°C per min and finally to 330°C at 20°C per min and maintained at 330°C. The injector and transfer lines were 330°C. Methane (99.99%) was used as the reagent gas in the negative ion mode with source pressure of 160 Pa.
Data Analysis
All data were presented in tables, figures and charts were used to express the different concentrations of micronutrients, vitamins and heavy metals.
Results
Physico-chemical Analysis
Table 1 shows the macroscopic (colour, odour and foreign matter) characteristics and pH values for water samples collected from both sites. Water samples from both sites had similar characteristics with Site X having a slightly high alkaline pH value.
Table 1: Macroscopic characteristics and pH of water samples from both sites.
|
Samples |
Colour | Smell | pH |
Foreign matters |
| Site 1 |
Light Brown |
None | 10.1 |
Slight debris |
| Site 2 |
Light Brown |
None | 8.2 |
Same as above |
Metal Analysis
Plate I show a screenshot of the result of metal analysis for Al, Zn, Cd, Cu, Ni, Co, Pb, Mn and Cr for samples collected from site 1 and site 2. The average zinc content in Site 1 was 0.079 mg/Kg, while that of site 2 was below detection. The manganese (Mn) content was practically the same for both sites, while the Nickel (Ni), Cobalt (Co) and Aluminum (Al) levels were almost the same throughout the study period in both study sites.
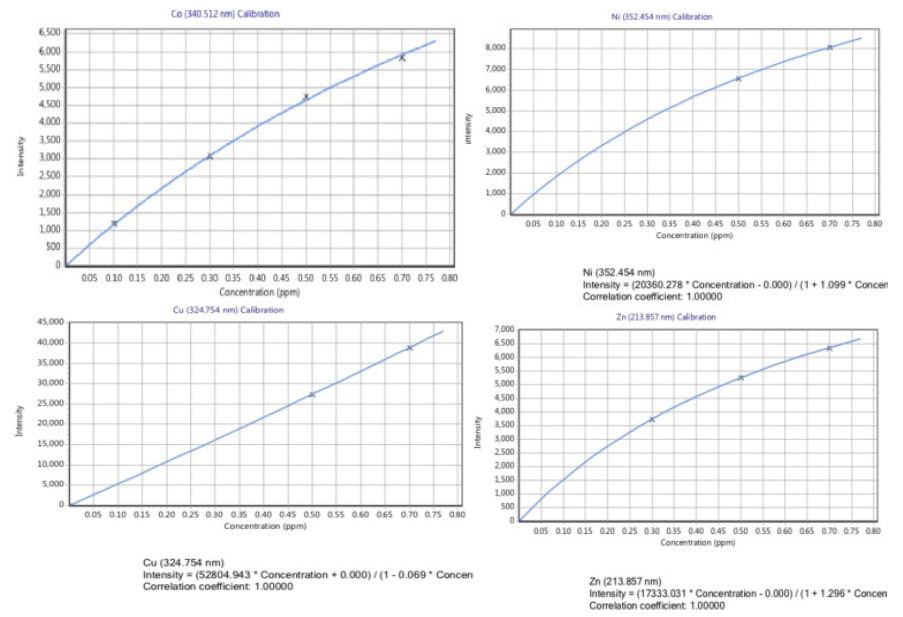
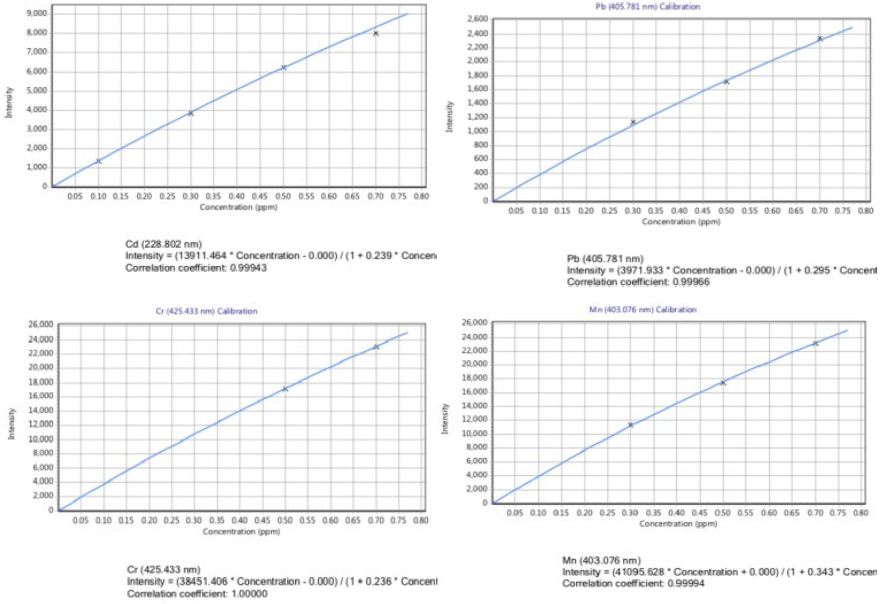
Plate 1: A screenshot of trace metal analysis for both sites.
Furthermore, phosphate and nitrate analysis performed on the water samples yielded relatively lower concentrations. Average phosphate content of site 1 was observed to be 0.027 mg/Kg while Nitrate content was 0.082 mg/Kg.
Methionine and Vitamins Analysis
Figure 2 shows the Methionine content at site 1 was 74.41 µg/mL while site 2 was 57.11 µg/mL. The mean values of two water-soluble vitamins; Thiamine (vitamin B1) content of site 1 was 3.758 mg/Kg and 2.355 mg/Kg at site 2 and B6 (Pyridoxine) was 0.108 mg/Kg in site 1 and 0.072 mg/Kg at site 2 as indicated Figures 3.
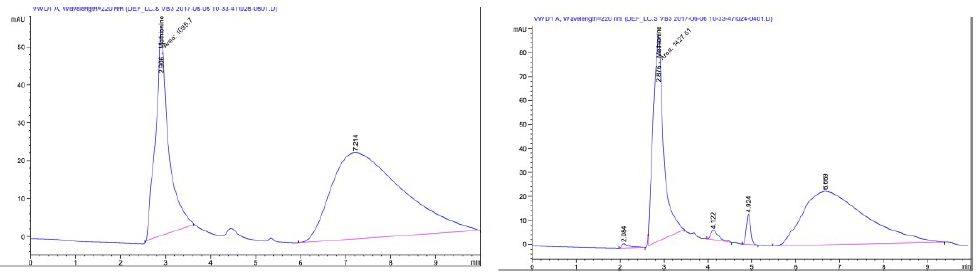
Figure 2: HPLC spectra of Methionine content of Site 1 (a) and 2 (b).
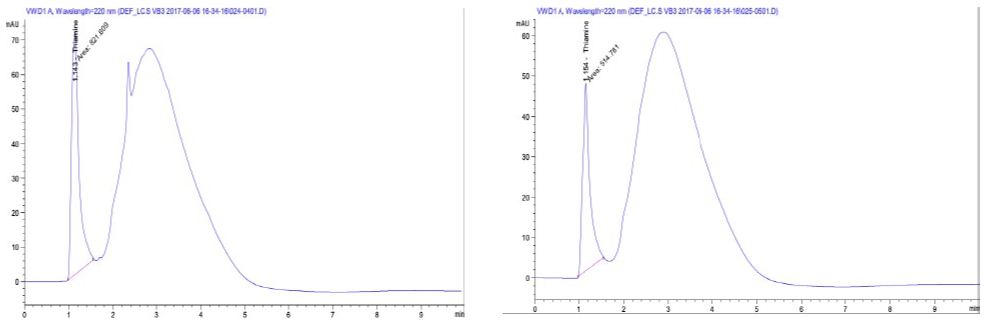
Figure 3: HPLC spectra of Thiamine content of Site 1 (a) and 2 (b).
Oestrogen Content
Over the stretch of the study period, the hormone values declined during the raining session by half from their maximum values for testosterone (4.8 ng/L), estrone (8.8 ng/L), ethinylestradiol (6.1 ng/L), and estrogen (4.9 ng/L) in site 1 estrogen (4.8 ng/L) and ethinylestradiol (2.4 ng/L) while estrogen was about ≥1.5 ng/L in site 2 as indicated in Figures 4 and 5.
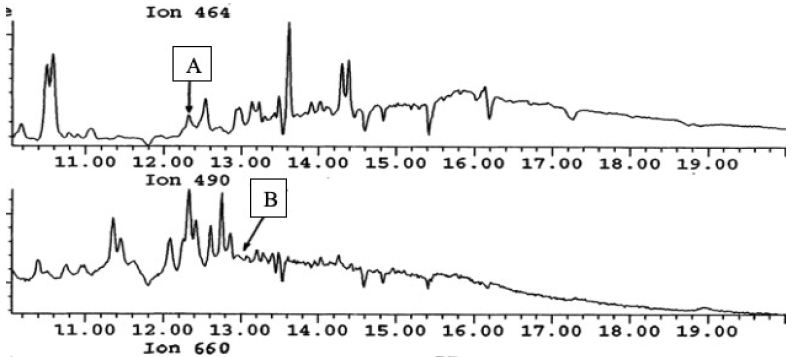
Figure 4: Chromatographic spectra of Estrone (A) and Ethynylestradiol (B).
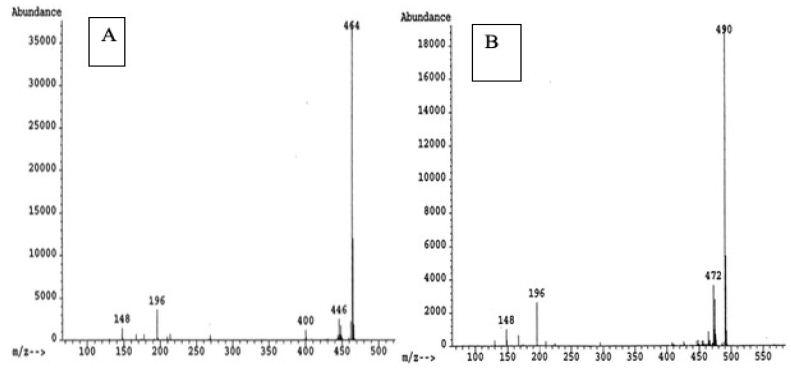
Figure 5: Mass spectra derivative Estrone (A) and Ethynylestradiol (B).
Also, the hormone values declined by half from their maximum mean values for testosterone (3.3 ng/L), estriol (8.8 ng/L), ethinylestradiol (6.1 ng/L), and estrogen (4.9 ng/L). From 67 to 100 km mark, testosterone (4.8 ng/L) and estrogen (2.4 ng/L) were still elevated while ethinylestradiol and estriol were ≥1.5 ng/L.
Discussion
Assessment of the biochemical quality of Osun river water becomes highly necessary due to the high traditional, domestic, human activities and the discharge of industrial wastes into the water body. The exposure of humans, animals and plants to such contaminated water may lead water 14 borne diseases which in severe cases cause damage to the body resulting to high level mortality [14]. Owing to the high local mythology ascribed to the Osun River, this research was carried out to give a background scientific knowledge on the constituents of the river, which are likely to aid understanding the role of some of these constituents in the acclaimed properties of the river water.
The results from this study revealed that the Osun river water is slightly brownish and highly alkaline pH. This is in concordance to the findings of Shomar [15], who reported alkaline pH for zamzam water and disagrees with the reports of Yusuf et al., [5] which reported a weak alkaline pH in Saba River. The slightly brownish colouration might be attributed to the dissolved organic materials, environmental pressure due to human activities from settlements along the river, flood inflow from rainfall and rituals performed during festival that attract thousands of people (NCMM, 2005) [6], other anthropogenic factors which affect the properties of the water [16] and inorganic contaminants, such as metals, are also common causes of color. In general, the point of consumer complaint is variable, ranging from 5 to 30 color units, although most people find color objectionable in excess of 10 color units. Other contaminants that may be related to change in watercolor include aluminum, copper, foaming agents, iron, manganese and 214 total dissolved solids (Scherer, 2019).
The alkaline pH=10.1 of site 1 is higher when compared with Zamzam water with pH 8 [15] and Mediterranean Sea water pH 8 [17]. Alkaline water are rich in minerals and attributed with health benefits such as ability to balance body pH, antioxidant, detoxification properties and generally optimized body immunity [18]. This could be attributed to the local use of the water from Osun River for therapeutic purposes.
The presence of vitamins in drinking water has been of particular interest due to the role vitamins play in metabolism, especially the vitamin B complex family known to play significant role as cofactor in enzyme catalyzed reaction such as dehydrogenase complexes [19]. Prominent among these vitamins are thiamine used in the synthesis of the cofactor Thiamine 224 pyprophosphostate, pyridoxine and its role in the glycogen synthesis pathway as well as amino acid metabolism. In this study, the vitamins and methionine concentrations along the Osun river follow different trend, for instance, site one was observed to be richer in methionine (74.410 g/Kg), thiamine (3.75823 g/Kg) and pyridoxine (0.108020 g/Kg; 0.622776 g/Kg) when compared with site two where methionine (54.11 g/Kg), thiamine (2.35473 g/Kg), pyridoxine (0.0715691 g/Kg) values were detected respectively. Conversely, an increase of vitamin B1 and B6 is observed in site one, when compared with site two, however, the values were lower than those reported for Moulouya river by Tovar-Sanchez et al., [20], other vitamins such as B12 were not detected in the water samples. Opposite responses in the various B-vitamins is not rare since their availability in water is governed by the specificity of the predominant phytoplankton species for those vitamins [21]. In this study, different values of vitamins (i.e., B1 and B6) were observed in the main worship area where the phytoplankton assemblages changed from dominance of diatoms to dinoflagellates mainly due to the fact that devotees tend to continuously drop sacrifices at this portion of the river. These might also give basis for the consistence slight brown colouration of the Osun water, going by the ability of dinoflagellates to generate “red tides”. In their report, Radi, et al., [22] established the relationship between dinoflagellate cyst assemblages and hydrographic conditions, productivity and nutrient concentrations; they suggested that dinoflagellate cyst assemblages can be used to reconstruct primary productivity, temperature and salinity. Sa~nudo-Wilhelmy et al., [21] emphasized the regulatory role of Vitamins in metabolic activities of marine plankton. Because of their high bacterial activities, freshwater sources (such as rivers and groundwater) are considered important sources of vitamin B1 and B6 [22-24].
The National Agricultural Library reported the role of trace metals such as: zinc, copper, manganese, etc. in the influence on reproduction and development. In a similar report by Rasheed et al., [25] reported NO3– and PO43– play an important role in biochemical processes. Looking at the trace metal zinc, the value 0.079 g/Kg was obtained for site one, and -0.015 g/Kg for site two. Zinc, an essential metal which is needed for hormone regulation, immune builder and fertility in women was detected in the river sample at 7 mg in each liter of water taken from the river, compared with standard FDA value of (3-5) mg/L. Aluminum content was observed to be 0.179 g/Kg, site one and 0.192 g/Kg for site two, compared with standard FDA value of 0.05-0.2 mg/L; this implies that for every liter of Osun water taken, 0.2 mg of aluminum is contained in it. The concentration of Cr in surface water represents the industrial activity [26]. Surface water contains chromium in the range of 0.004 to 0.007 mg/L [27]. Chromium, cadmium, copper and lead levels in the Osun River water were below detection 16 indicating. However, Manganese (Mn) which is an essential component of biochemical reactions that affects bone, cartilage, brain and energy supply but toxic in higher concentration was detected. In this present study, the concentration of Mn was 0.313 g/Kg for both sites and do not exceed the permissible limit for drinking water set by various organizations. The concentration obtained was comparable with the European Commission, World Health Organization (WHO) and United States Environmental Protection Agency (USEPA) prescribed guideline (Table 2 in [28]). Arsenic was 0.842 g/Kg for site one, and 0.569 g/Kg for site two, compared with 7.29 g/L reported by Fahad et al. (2016) for Zamzam. Although arsenic may cause low birth weight and spontaneous abortion, long266 term chronic health effects, such as skin disease, skin cancer, it was and is still applied for pharmaceutical and medical purposes in curing asthma and hematological illnesses. In their report, Stein and Tallman described the use of Arsenic Trioxide (ATO) as a new era in chemotherapeutic of Acute Promyelocytic Leukemia (APL) [29]. A growing body of literature demonstrates the feasibility and efficacy of ATO, usually given with ATRA, in the treatment of patients with newly diagnosed APL. However, he mentioned reports of potential unintended toxicities, which included impaired fertility in both men and women. Second edition textbook of Biopharmaceutical Biochemistry and Biotechnology also describe biologic agent as any other trivalent organic arsenic compound applicable to the prevention, cure or treatment of disease or conditions of human beings [30].
Copper, cadmium, and lead had relatively no value (-0.006 g/Kg) when tested for in the Osun water; knowing that lead is harmful to the body, it was satisfactory to know the lead content of the Osun water was below detectable level at the period. After obtaining the values 74.410 µg/mL for the first site, and 57.110 µg/mL for the second site, and knowing that methionine is an essential amino acid required for initiation of protein synthesis. It was satisfactory to know the methionine content is high when compared with standard FDA value 56.6 µg/mL. This might imply that an individual taking Osun water takes in over 55 µg of water dissolved methionine per every mL of the water. Vitamin B1 (Thiamine) content gotten in site one was 3.758 µg/mL and site two was 2.355 µg/mL compared with standard of 1.5 mg/l. Hence, it shows that if one takes a mL of Osun water, the thiamine content obtained from it is over 3 µg compared with the RDA value of 1.1 mg. Vitamin B6 (Pyridoxine) value obtained was 0.108 µg/mL for site one, while 0.072 µg/mL was observed for site two and this shows that for every mL of the Osun water taken in, 0.1 µg of 17 pyridoxine is contained in it. PO43– value observed from the Osun water did not exceed the stipulated standard of 0.02 g/Kg, as the value obtained was 0.027 g/Kg. The NO3– value obtained was 0.082 g/Kg. In summary, it was observed that higher nutrients levels was obtained from the first site, which is within the grove and the believed center of most of the spiritual activities of the devotees, and this is due to the natural conservation present over the river.
Occurrence of metals such as Cu, Zn and Fe in water is also of importance considering the role of metals as cofactors of enzymatic activities and protein structure. In natural surface waters, the concentration of zinc is usually below 0.010 mg/L, while in groundwater 0.010-0.040 mg/L [31,32]. Essential amino acids such as methionine found in some water bodies have be attributed to environment or climatic conditions of the water. Micronutrients indirectly serve as the catalyst to release the energy from the macronutrients.
Due to the high bacterial activities, freshwater sources (such as rivers and groundwater) are considered important sources of vitamin B1 and B6 and Baren-cohen et al., reported that hormones in readily measured quantities can be transported along a considerable distance from the source of pollution [33]. Several literatures have shown that steroid hormones produced by humans and animals constantly excreted into the environment found their ways into underground water and rivers [34-36]. This work concentrated on naturally occurring hormones such as estrone (E1) and estradiol-17b (E2) which were reported to exert physiological effect at concentrations above LOEL (Lowest observable effect level). E2 is abiotically converted to E1 thus, they are generally considered as oestrogen. The LOEL for E2 and E1 were report as 14 and 3.3 ng/L, respectively [37-50] while ethinylestradiol is 1 ng/L [33]. the mean values of steroid detected in the Osun River water over the study period shows the hormone content were lower doing pre-raining season but the content were both above the LOEL. Ethinyl estradiol binds to the estrogen receptor complex and enters the nucleus, activating DNA transcription of genes involved in estrogenic cellular responses. This agent also inhibits 5-alpha reductase in epididymal tissue, which lowers testosterone levels and may delay progression of prostatic cancer. In addition to its antineoplastic effects, ethinyl estradiol protects against osteoporosis. In animal models, short-term therapy with this agent has been shown to provide long-term protection against breast cancer, mimicking the antitumor effects of pregnancy.
In conclusion, this study established the presence of micronutrient, trace metals, water soluble vitamin, methionine and hormone content of the Osun River water that maybe associated with metabolic and physiological processes. Thus, this study report for the very first time the presence of water-soluble vitamin, phosphate, nitrate, amino acid, hormone, and trace metal dissolved in the conserved grove water that has served as major source of water for the community from historical days especially to devotees and indigenes.
References
- Sadgir P, Vamanrao A (2003) Water in Vedic literature. In: Abstract proceedings of the 3rd international Water history association conference, Alexandria.
- Hannah Ritchie (2017) “Micronutrient Deficiency”. Published online at OurWorldInData.org.
- Olajire AA, Imeokparia FE (2001) Water Quality Assessment of Osun River. Environmental Monitoring and Assessment 69: 17-28. [crossref]
- Azeez L, Salau AK, Adewuyi SO, Osineye SO, Tijani KO, et al. (2015) Safety Evaluation of Osun River Water Containing Heavy Metals and Volatile Organic Compounds (VOCs) in Rats. Niger J Physiol Sci 30: 103-109. [crossref]
- Yusuf OA, Adewole HA, Olaleye VF (2017) Assessment of the Water Quality of Saba River. Not Sci Biol 9: 188-195.
- National Commission for Museums and Monuments (NCMM) (2005) Nomination to the World Heritage List of Osun-Osogbo Sacred Grove, Osogbo, Osun State, Nigeria.
- Osegale G, Omisore E, Gbadegesin JT (2014) Exploratory survey on the maintenance of Osun-Osogbo sacred grove, Nigeria. African Journal of Hospitality, Tourism and Leisure 3: 1-22.
- Sharif MK, Butt SM, Sharif HR, Nasir M (2017) Sensory Evaluation and Consumer Acceptability 17.
- Raphael O, Emmanuel AO (2019) Quality Assessment of Some Selected Herbal 355 Medicinal Products Consumed in Wukari, Taraba State. Acta Scientific Microbiology 2: 28-36.
- Radulescu C, Stihi C, Ionita I, Dulama ID, Chilian A, et al (2014) Determination of heavy metal levels in water and therapeutic mud by atomic 353 absorption spectrometry. Romanian Journal of Physics 59: 1057-1066.
- Smith R (1983) A laboratory manual for the determination of metals in water and wastewater by atomic absorption spectrophotometry.
- Cortés-Herrera C, Artavia G, Leiva A, Granados-Chinchilla F (2019) Liquid chromatography analysis of common nutritional components, in feed and food. Foods 8. [crossref]
- Environmental Protection Agency (2006) Chapter 10: Nutrients-Nitrogen and Phosphorus. In Volunteer Estuary Monitoring Manual.
- Haseena M, Malik MF, Javed A, Arshad S, Asif N (2017) Water pollution and human health. Environ Risk Assess Remediation 1: 16-19.
- Shomar B (2019) Zamzam water: Concentration of trace elements and other characteristics Chemosphere Zamzam water: Concentration of trace elements and other characteristics. Chemosphere 86: 600-605.
- Khatri N, Tyagi S (2015) Influences of natural and anthropogenic factors on surface and groundwater quality in rural and urban areas. Frontiers in Life Science 8: 23-39.
- Flecha S, Pérez FF, García-Lafuente J, Sammartino S, Ríos AF, et al. (2015) Trends of pH decrease in the Mediterranean Sea through high frequency observational data: indication of ocean acidification in the basin. Scientific Reports 5.
- Mousa HA (2017) Health Effects of Alkaline Diet and Water, Reduction of Digestive-tract Bacterial Load, and Earthing. Alternative Therapies 22: 23-44. [crossref]
- Parra M, Stahl S, Hellmann H (2018) Vitamin B6 and Its Role in Cell Metabolism and Physiology. Cell 7: 84-108. [crossref]
- Antonio Tovar-Sanchez, Gotzon Basterretxea, Mostapha Ben Omar, Antoni Jordi, David Sanchez Quiles, et al. (2016) Nutrients, trace metals and B-vitamin composition of the Moulouya River: A major North African river discharging into the Mediterranean Sea. Estuarine, Coastal and Shelf Science 176: 47e57.
- Sanudo-Wilhelmy SA, Cutter LS, Durazo R, Smail EA, Gomez-Consarnau L, et al. (2012) Multiple B-vitamin depletion in large areas of the coastal ocean. Proceedings of the National Academy of Sciences 109: 14041-14045.
- Radi Taoufik, Pospelova Vera, Anne, de Vernal and Barrie, James (2007) Dinoflagellate cysts as indicators of water quality and productivity in British Columbia estuarine environments. Marine Micropaleontology 62: 269-297.
- Barada LP, Cutter L, Montoya JP, Webb EA, et al. (2013) The distribution of thiamin and pyridoxine in the western tropical North Atlantic Amazon River plume. Frontiers in Microbiology 4: 25. [crossref]
- Gobler CJ, Norman C, Panzeca C, Taylor GT, Sañudo-Wilhelmy SA (2007) Effect of B vitamins (B1, B12) and inorganic nutrients on algal bloom dynamics in a coastal ecosystem. Aquat Microb Ecol 49: 181-194.
- Okbamichael M, Sañudo-Wilhelmy SA (2004) A new method for the determination of Vitamin B12 in seawater. Analytica Chimica Acta 517: 33-38.
- Rasheed M, Badran MI, Huettel M (2003) Influence of sediment permeability and mineral composition on organic matter degradation in three sediments from the Gulf of Aqaba, Red Sea. Estuarine, Coastal and Shelf Science 57: 369-429.
- Shiller, Boyle (1987) Variability of dissolved trace metals in the Mississippi River. Geochimica ei Cosmochimica Acta 51: 3273-3217.
- Batayneh AM (2012) Toxic (aluminum, beryllium, boron, chromium and zinc) in groundwater: health risk assessment. Int J Environ Sci Technol 9: 153-162. [crossref]
- Guidelines for drinking water quality [Internet] 3rd ed. Geneva, Switzerland: World Health Organization 2004.
- Stein EM, Tallman MS (2012) Does arsenic trioxide impact fertility?. Leukemia & Lymphoma 53: 2099-2100. [crossref]
- Nriagu J (1980) Zinc in the environment, part I, ecological cycling. Wiley, New York.
- Walsh G (2003) Biopharmaceutical Biochemistry and Biotechnology. Biochemistry and Molecular Biology Education, 2004 Second Edition 1998 John Wiley & Sons: Abano, E. E., & Godbless Dadzie, R. (2014). Simultaneous detection of water-soluble vitamins using the High Performance Liquid Chromatography (HPLC) – a review. Croatian Journal of Food Science and Technology 6: 116-123.
- Elinder C (1986) Handbook on the toxicology of metals, 2nd edn. Elsevier Science Publishing, Amsterdam.
- Barel-Cohen K, Shore LS, Shemesh M, Wenzel A, Mueller J, et al. (2006) Monitoring of natural and synthetic hormones in a polluted river. Journal of Environmental Management 78: 16-23. [crossref]
- Lintelmann L, Katayama A, Kurihara N, Shore L, Wenzel A (2003) Endocrine disruptors in the environment (IUPAC Technical Report). Pure Appl Chem 75: 631-681.
- Shore LS, Shemesh M (2003) Naturally produced steroid hormones and their release into the environment. Pure Appl Chem 75: 1859-1871.
- Drewes JE, Shore LS (2001) Concerns about pharmaceuticals in water reuse, groundwater recharge, and animal waste. In: Daughton CG, Jones-Lepp T. (Eds.), Pharmaceuticals and personal care products in the environment: scientific and regulatory issues Symposium Series 791. American Chemical Society, Washington, DC.
- Olsen P, Bach K, Barlebo HC, Ingerslev F, Hansen M, et al. (2007) Leaching of Estrogenic Hormones from Manure-Treated Structured Soils. Environmental Science & Technology 41: 3911-3917. [crossref]
- Cortés-Herrera C, Artavia G, Leiva A, Granados-Chinchilla F (2019) Liquid chromatography analysis of common nutritional components, in feed and food. Foods 8.
- Olajire AA, Imeokparia FE (2001) Water quality assessment of osunriver: studies on inorganic nutrients. Environmental Monitoring and Assessment 69: 17-28. [crossref]
- Cornely K (2004) Biopharmaceuticals: Biochemistry and Biotechnology, 2nd edition: Walsh, Gary, John Wiley & Sons. Biochemistry and Molecular Biology Education 32: 137-138.
- Council Directive 98/83/EC of November 1998 on the quality of water intended for human consumption.
- Kasting JF, Catling D (2003) Evolution of a habitable planet. Rev. Astron. Astrophys 41: 429-463.
- Murrell, Nathaniel Samuel (2009) Afro-Caribbean Religions: An Introduction to Their Historical, Cultural, and Sacred Traditions. Temple University Press.
- Olivares M, Araya M, Uauy R (2000) Copper homeostasis in infant nutrition: deficit and excess. J Pediat Gastroenterol Nutr 31: 102-111.
- Reza R, Singh G (2010) Assessment of heavy metal contamination and its indexing approach for river water. Int J Environ Sci Technol 7: 785-792.
- Tovar-Sánchez A, Basterretxea G, Ben Omar M, Jordi A, SánchezQuiles D, et al. (2016) Nutrients, trace metals and B-vitamin composition of the Moulouya River: a major North African river discharging into the Mediterranean Sea. Estuar Coast Shelf Sci.
- National primary drinking water regulations [Internet] Washington, D.C.: United States Environmental Protection Agency 2009 6.
- National recommended water quality criteria [Internet] Washington, D.C.: United States Environmental Protection Agency; 2006: 25.
- Raphael O, Emmanuel AO (2019) Quality Assessment of Some Selected Herbal Medicinal Products Consumed in Wukari, Taraba State. Acta Scientific Microbiology 2: 28-36.