DOI: 10.31038/AFS.2021324
Abstract
An analysis of nutrient flow, based on nitrogen (N) and phosphorous (P), was conducted on an integrated rabbit–fish–rice system (IRFR) system at the Rwasave Fish Farming Station (National University of Rwanda). Rabbits, stocked at 12 per are (1200 rabbits.ha-1) of pond, were reared over fishponds stocked with one and three male tilapia (Oreochromis niloticus) per m2 for pond treatments PT1 and PT2. Effluent fertilised by the rabbits was drawn away from the ponds by pipes installed at the bottom of the ponds to irrigate rice (Oryza sativa L., variety Yuni Yin4) fields. There were six 400 m2 ponds and nine 90 m2 rice fields; three of the latter were irrigated by canal water and fertilised by NPK (200 kg.ha-1.crop-1, 2 applications; 100 kg.ha-1.crop-1, one application).
The results showed that rabbit droppings supplied about 27% N and 79% P of the total N and P inputs, fertilising the ponds at a rate of 3.98 kg N and 1.94 kg P.ha-1.d-1. The fish recovered 18.5‑7.6% N and 16.9-34.3% P of the total nitrogen (TN) and total phosphorus (TP) inputs. All water quality variables remained within good limits for tilapia aquaculture and nutrient distribution was not dependent on fish density. Large amounts of N and P accumulated in the water, sediment, and effluent fertilised rice fields at a higher rate (118.5 kg N and 27.2 kg P.ha-1.d-1) than that of inorganic fertilizers, resulting in a slightly higher rice yield than that induced by NPK and urea.
Tilapia effluent was thus able to substitute inorganic fertilisers completely, allowing savings to the farmers, and showing its potential as a fertiliser for fish and crop production rather than waste to be discharged, polluting the environment by its solids and organic matter component. Further studies involving a thorough analysis of nutrients lost and diversified uses of the nutrient-rich effluent are needed.
Keywords
Integrated aquaculture-agriculture system, Nutrient-rich effluent, Rabbit-fish-rice system, Earthen ponds
Introduction
During recent years, aquaculture has developed worldwide for the purpose of addressing food insecurity and income generation. In aquaculture, ponds are dynamic ecological systems that continuously process and remove large quantities of nutrients and organic material [1]. This has led to large quantities of pond nutrients (total solids and organic matter) being discharged, generally into natural water bodies, where they constitute a major source of water pollution, especially in semi-intensive and intensive aquaculture systems in countries where farmers lack effluent management techniques.
Earlier aquaculture enterprises are either extensive or semi-intensive fish farms, integrated to agriculture (crop and/or livestock) or not (that is stand-alone enterprises). The later are intensive systems or recirculated aquaculture systems (RAS) which, when operating at larger scale, are risky ventures and are not suitable for resource-poor farmers in developing countries [2]. They require formulated fish feeds and operate using high level energy, and high investments. Subsequent to that, these systems cause high risks including water quality deterioration through accumulation of nutrients in water and pond bottom soil, diseases, low profit margin, and lead to impacts such as pollution, environmental destruction, and reliance on pelleted feeds [3]. Extensive and semi-intensives aquaculture rely on fertilsation and use crop by-products for supplements to fish feeds. These are often Integrated agriculture-aquaculture (IAA), less risky systems because they benefit from synegisms from constituent enterprises, have a diversity in produce and environmental soundness [4,5].
The nutrient budget of fish ponds in conventional aquaculture explains that only small portions of inputs are recovered in fish biomass and in water columns, with the largest amounts lost in pond bottom mud [6-8]. During fish harvest by the draining of the ponds, nutrients in the upper layer of mud are carried away in the effluent and released into rivers. The most important nutrient in fertilised fish ponds are N and P which, in key concentrations, are limiting for phytoplankton growth. N and P, in intensive aquaculture systems are also reported the two main pollutants of water [9,10].
The feeding and fertilisation of fish ponds, with fish feed and fertilisers always result in the accumulation of nutrients in the form of fish waste and other organic matter. In this regard, observations made of channel catfish (Ictalurus punctatus) and hybrid catfish (C. macrocephalus x C. gariepinus) ponds, reported an increase of most water quality variables, including nutrients, total solids, organic matter, and a high 5-day biochemical oxygen demand in the remaining 25% of effluent when fish ponds are being drained [11-13]. This last part of pond effluent is potentially harmful to the environment as it often contains more than 50% of the total load of nutrients [14], 35.5% TN and 10.4% TP [15].
However, the aquaculture wastewater, because of its load of nutrients, could be seen as a potential fertiliser for fish farming and agriculture production [16] more generally in integrated agriculture-aquaculture (IAA) systems [2,17] rather than a waste to be discharged and to pollute water bodies (that is, the environment) by solids and organic matter. According to [2,4,18], IAA-farming is characterized by the recycling of nutrients between the farm components and this system allows the intensification of production and income generation while reducing environmental impact [17]. Tropical integrated pond systems are reputed to retain nutrients to a high degree as the latter are re-used by primary and secondary producers, making the system a better nutrient converter than the recirculation aquaculture systems [19].
In the current study, nutrient-rich wastes were dropped directly into fishponds from grass-fed rabbits and pond wastewater (that is, fertilised effluent) was then used as fertiliser for irrigated rice. The flow of bio-resources and nutrients throughout the rabbit-tilapia (O. niloticus)-rice integrated system was investigated, with the rabbits as the major entry point for nutrients for the system [20]. The purpose of this study was to identify the flow of nutrient by quantifying the mass flow of N and P nutrients by using the mass balance approach, assuming that IAA farming allows the recycling of nutrients between farm components.
Materials and Methods
Site and Experimental Arrangement
The present study was carried out at the Rwasave Fish Culture Research Station (SPIR) of the National University of Rwanda (geographic co-ordinates 02° 36’ 10’’ S and 29° 45’ 25’’ E and elevation about 1,625 m above sea level). The University is at Butare in the Southern Province of the Republic of Rwanda.
Figure 1 is a detailed diagramme of the agriculture system implemented at the SPIR combined with an annotated photograph. The experiment used three different living organisms, namely rabbits (Oryctolagus sp.), fish (Oreochromis niloticus L.), and rice (Oryza sativa, var Yuni Yin4); these were all farmed as part of a full IAA system.
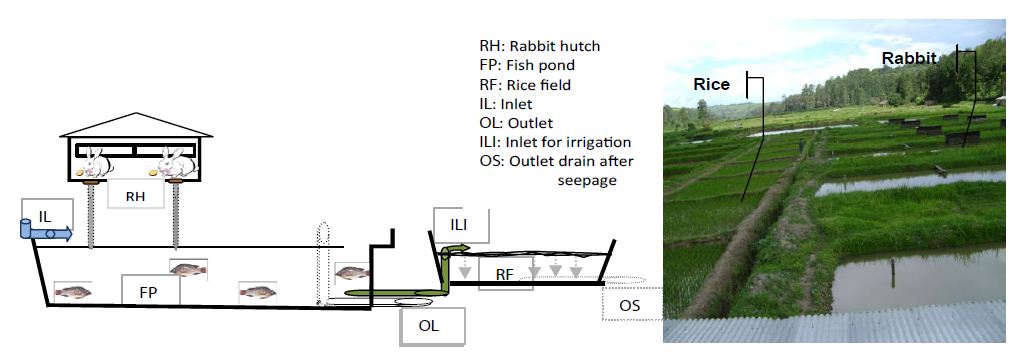
Figure 1: A profile of the experimental rabbit-fish–rice integrated system at the Rwasave Fish Culture Research Station. The connections between the rabbit hutch, the fish pond, and the rice field are demonstrated. The pond is here viewed lengthwise.
Rabbit Housing
Rabbit hutches were built and placed over the fishponds to allow all rabbit droppings to fall straight into their respective fishponds. Each hutch was divided into four cages, each 0.7-1 m in height with a 1 m2 wire mesh floor. Three hutches were installed over each fish pond of 4 ares (400 m2). The rabbits were placed in their hutches one week before the ponds were stocked with fish and two weeks before the rice was transplanted into the adjoining fields. The rabbits were a local strain of the Oryctologus sp. genus.
(1200 rabbits per hectare) of pond. The mean live weight of each rabbit was 600-800 g. The rabbits were fed with cut grass, brought in from the pond dykes and the station surrounds. Rabbit health was attended to: the only disease that was frequently observed was rabbit gall, and this was treated by subcutaneous injections of ivermectin and sometimes by skin application of motor or crankcase oil.
Fish Ponds and Rice Fields
Before the experiment began, the fishponds were drained, dredged, and dried to minimise any possible effect of prior use. The inlet pipes were blocked by a fine mesh net to avoid wild aquatic species, such as frogs, molluscs, and wild fish, being carried into the pond by the flow of water in the canals that connected the ponds to the Rwabuye River.
Each fishpond was connected to a 90 m2 (9 m x 10 m) rice field by a PVC outlet pipe, installed about 10 cm from the bottom of the pond for the irrigation of the rice fields (Figure 1). Two small PVC pipes, perforated along their length (8 m), were installed at a depth of 40 cm in each of the rice fields to drain the pond water after it had seeped through the rice field soil.
The experiment commenced on 24 August 2009, on the day the rice was transplanted. This was two weeks after the rabbit hutches were stocked and the ponds filled with water. The experiment ended on 25 January 2010, the day the rice was harvested.
Experimental Management
The principle purpose of the experiment was to use rabbit droppings to fertilise fish ponds, thereby producing well-grown fish as well as fertilised pond water (effluent) that could then be used to irrigate rice fields; this would simultaneously reduce the discharge of nutrients from the fish culture ponds into the environment.
The experiment consisted of two treatments in a completely randomised design with three replicates [21]. Hand-sexed, monosexual juvenile male Nile tilapia (Oreochromis niloticus L.) were used for their grow-out phase. The six fishponds were each connected to their own rice field of 90 m2. The experiment was then conducted in six fish ponds of four ares (400 m2) each and in nine rice fields of 90 m2 (9 m x 10 m) each. The following treatments took place in the fishponds:
- -Pond treatment 1 (PT1): three of the six fishponds were stocked with one fish per m2 and were fertilised with the droppings from 1,200 rabbits per hectare of pond.
- Pond treatment 2 (PT2): three of the six fishponds were stocked with three fish per m2 and were also fertilised by dropping from 1,200 rabbits per hectare of pond.
- With regard to the rice, the following three treatments took place:
- Rice treatment 1 (RT1): three of the nine rice fields were fertilised by chemical fertilisers (NPK: 17:17:17 and urea 45%-N).
- Rice treatment 2 (RT2): three of the nine rice fields were fertilised by the effluent of the fishponds stocked with 1 fish per m2 (see PT1).
- Rice treatment 3 (RT3): three of the nine rice fields were fertilised by the effluent from the fishponds stocked with three fish per m2 (see PT2).
Dynamic of Nutrients in the Rabbit-Fish-Rice Integrated System
Composition of Rabbit Droppings and Rabbit Feed
Every two weeks, a 24-hour cycle collection of droppings (both rabbit dung and urine) was conducted. The dung, taken from under one cage lodging four rabbits, was collected twice a day, at 07 h and 16 h for night and day excreted amounts respectively. All overnight excretion, both dung and urine, was collected at 07 h. Urine excreted during the day was collected, and the volume recorded, every two hours during the day in order to minimise loss through evaporation; subsequently, it was poured back into the fishpond.
The biochemical composition of the droppings was determined by the laboratory of the Animal Science and Poultry Department, University of KwaZulu-Natal. The analysis determined the concentration of N, P, Ca, gross energy, fibres, fat, ash, and moisture using the ALASA method for feed and plants detailed [22]. The same analysis was carried out for the composition of the rabbit forage, the rabbit pellets, fish carcasses, and rice at harvest. N was determined on a LECO TruSpec Nitrogen Analyser according to Official Method 990-03 and expressed as percentage protein [22].
Water Quality in Fish Ponds
Water quality parameters, including dissolved oxygen, water temperature, pH, and electrical conductivity, were monitored on a daily basis, twice per day, using appropriate manual probes.
Chlorophyll a was determined after filtrating water on Whatman paper microfibre GF/C (retention: 1.2 µm; Ø47 mm) and was analysed using the acetone extraction method [23].
Pond water nutrients, including N and P forms, were analysed from a sample collected fortnightly. A one litre sub-sample was filtered through Whatman filter paper and kept in the fridge for later laboratory analysis. Another litre of non-filtered water was analysed for TN and TP. TN was analysed using the Kjeldhal method (Blume, 1966) and adapted by [24]; TP was determined after hydrolysis into ortho-phosphates by persulfate digestion [25], thereafter with the colorimetric method. Ortho-phosphate analysis was carried out on filtered water following the ascorbic acid method [23]. Inorganic N, NH4-N (mg/l) and NO2-N (mg/l), was determined by the colorimetric method, while NO3-N was analysed using the cadmium reduction method [26].
Water Seeping through Rice Field Soil
A one-litre sample of seepage water was collected at the drains (perforated PVC tubes) that had been installed at a depth of 50 cm under the rice field. The sample was a mixture of water collected from the two drains installed in each. One half of the sample (that is, 500 ml) was filtered for NH4-N, NO2-N, NO3-N, and PO4-P analysis; the second half was not filtered for TN and TP dosage. Nutrient analysis was done using the same procedures as described above for the pond water nutrients.
Nutrient Analysis in Soil Samples
The analysis parameters used for the soil samples that were collected at the start, the midterm (90 days after transplanting DAT), and the end (153 days DAT) of the experiment were TN, nitrates (NO3-N), ammonia (NH4-N), TP, and phosphates (PO4-P). The soil samples were collected using a soil auger along a “double S” trajectory in the fish pond and a “W” trajectory in the rice field. Samples were taken from a mixture of eight clumps of soil both for fishponds and rice fields.
Soil pH was measured by the electrometric method in a soil-solvent suspension, and cation exchange capacity (CEC) was analysed on a saturated soil as detailed in IITA (1975, adapted by [24]. The TN was analysed using the Kjeldahl method according to INEAC (1959), adapted by [24], and NO4-N ammonium and NO3-N nitrates from soil were determined according to the method detailed by McKeague (1978), adapted by [24]. The TP in the pond sediment and rice field soil was analysed using the spectrometric methods detailed [27], and the PO4-P was determined by extraction followed by the blue-colorimetric method set out [28].
Statistical Analysis
The mean values were compared using a two-way analysis of variance (ANOVA II) for parameters changing over time, especially for water and soil quality. Significant differences among the treatments as shown by ANOVA were further tested using the least significant differences of means at a 5% level (LSD0.05). Possible relationships between the parameters were highlighted through regressions and correlations analysis using GenStat statistical software (GenStat12.1 Ed®, 2009 – VSN International Ltd), which was also used for ANOVA.
Results
Rabbit Nutrition, Excretion of Droppings and Discharge of Nutrients
Rabbits were fed forage ad libitum but formulated pellets were supplied only during the first month to supplement the ration in order to help the rabbits adapt to the new environment. The bromatological composition of forage, as well as that for rabbit droppings (both for rabbit fed forages or formulated pellets, is detailed in Table 1.
Table 1: Chemical composition of the rabbit forage, droppings from rabbits fed forage and rabbits fed pellets, highlighting the contribution of the rabbits to the integrated rabbit-fish-rice system. (N: nitrogen, P: phosphorus, K: potassium, Prot: crude proteins, G.E: gross energy, Ca: Calcium).
| Items |
Amount |
Chemical composition | |||||||||
| N (%) | P (%) | K (%) | Prot. (%) | Fibre (%) | Ash (%) | Moist. (%) | Fat (%) | Ca (%) |
G.E(MJ.kg-1) |
||
| Rabbit forage (kg/12 rabbits/d) |
5 |
2.4 | 0.22 | 1.94 | 14.97 | 21.73 | 12.67 | 8.17 | 2.85 | 1.24 |
17.01 |
| Rabbit pellets (kg/12 rabbits/d) |
6 |
2.91 | 0.86 | — | 18.19 | 13.11 | 9.81 | 10.05 | 9.15 | 0.88 |
15.45 |
| Rabbit dung (fed forage) (kg/are of pond/d) |
0.60±0.1 |
1.57 | 0.62 | 0.38 | 9.82 | 33.84 | 13.63 | 8.1 | 4.56 | 1.43 |
17.78 |
| Rabbit dung (fed pellet) |
— |
1.71 | 0.34 | — | 10.71 | 35.04 | 10.85 | 8.2 | 3.11 | 0.76 |
17.48 |
| жRabbit urine (l/are of pond/d) |
1.36±0.3 |
2.17 | 1.16 | — | — | — | — | — | — | — |
— |
| Rice straw |
1.48 |
0.31 | — | 9.23 | 28.22 | 15.21 | — | 1.43 | 0.36 |
15.45 |
|
| Harvested rice grain |
1.56 |
0.16 | 0.09 | — | — | — | — | — | — |
— |
|
| Havested Fish |
9.79 |
4.35 | 1.04 | — | — | — | — | — | — |
— |
|
жChemical composition [29]; data not available.
The average amount of dung ranged from 0.44 to 0.85 kg.a-1.d-1, and the average amount of urine ranged from 0.86 to 1.69 l.a-1.d-1. These wastes fluctuated widely over the rearing time, and no significant difference was found between the amounts of droppings (P<0.001) of the various treatments being voided into the fish ponds. Rabbit dung was very rich in basic nutrients for plankton development (Table 1). Rabbit wastes were composed of 1.57 or 1.71% N and 0.62 or 0.34% P content when rabbits were fed grass or formulated pellets respectively. The rabbit urine might be an important source of nutrients in view of its composition: 2.17 % and 1.15 % N and P respectively. Rabbit waste was the major source of organic nutrient in the current IAA, providing about 505.10 kg TN and 245.87 kg TP to fish ponds during the 127 days of pond fertilisation monitoring. The largest amounts of TN (1365 kg) and of TP (65 kg) were sourced from the canal water used to refill the pond during the culture period. However, the waste weight increased significantly in time (P=0.02) with increasing rabbit weight.
The present study identified a good rabbit growth with a daily weight gain of 8.0 g/day while the mean weight changed from 821.03 to 1362.7 g with a survival rate of 85.4%.
Fish and Rice Yields
In treatments TP1 and TP2 (1 and 3 fish.m-2), total fish yield was 953 and 1939 kg.ha-1 respectively. Fish mean weight of 104.3 ± 4.2 and 70.7 ± 1.6 g.fish-1 was obtained in TP1 and TP2 respectively. Recorded rice yields were 5.79, 5.44, and 5.87 t.ha-1 in RT1, RT2, and RT3 respectively and rice straw biomass was 10.79, 9.97, and 9.70 t.ha-1. The fish and rice content in N and P nutrients is presented in Table 1.
Pond Water Quality
Table 2 presents the mean and standard error for listed water quality parameters and the major nutrients which characterised the pond water. The overall temperatures that were recorded ranged from 20.4 to 29.9°C and the pH ranged from 6.5 to 8.4. Total alkalinity ranged from 40 to 120 mg CaCO3 l-1 in the ponds undergoing the range of treatments. All the parameters of the water quality remained within acceptable limits for pond aquaculture throughout the duration of the experiment. The temperature, DO, pH, and total alkalinity values did not differ significantly between treatments, but the DO, the pH, and the temperature recorded had significantly higher values (P<0.05) in the afternoon than observed at dawn within the same treatment (Table 2).
Secchi disk transparency was significantly higher (P<0.05) in the ponds stocked with one fish/m2 than in those stocked with three fish/m2.
The daily primary productivity ranged from 0.7 to 2.9 g C/m2/d for PT1 and from 1.1 to 2.8 g C/m2/d for PT2, with no significant difference (P<0.05) between treatments, whereas the chlorophyll a concentrations were significantly higher in PT2 than those in PT1 (P = 0.002, Table 2). Regarding the nutrient concentrations in the pond water, there appeared to be no accumulation of inorganic N (ammonia, nitrites, and nitrates) as toxic levels were not reached in any of the treatments (Table 2). There was no significant difference between the treatments for all nutrients, except for the available P, for which the phosphate concentrations in PT2 were significantly higher than those in PT1 (P<0.05).
Table 2: Physico-chemical parameters characteristics of fish pond water in rabbit-fish-rice integration system [ponds stocked with one (PT1) and three (PT2) fish per m2 of pond].
| Pond water parameters |
Treatments |
LSD0.05 |
P value |
|
|
PT1 |
PT2 |
|||
| Temperature (°C) a.m. |
21.56 ± 0.22x |
21.75 ± 0.25x | 0.18 (*) |
0.021 tdt |
| Temperature (°C) p.m. |
25.11 ± 0.47ay |
25.98 ± 0.39bz |
||
| pH a.m. |
6.94 ± 0.09x |
6.90 ± 0.05x | 0.25 |
0.017 dt |
| pH p.m. |
7.10 ± 0.44y |
7.11 ± 0.52y |
||
| Conductivity (µS.cm-1) a.m. |
115.42 ± 5.32 |
118.54 ± 4.29 |
NS |
|
| Conductivity (µS.cm-1) p.m. |
115.67 ± 5.64 |
117.71 ± 4.37 |
||
| Dissolved oxygen (mg.l-1) a.m. |
1.90 ± 0.34x |
1.69 ± 0.85x | 2.23 |
<0.001 ddt |
| Dissolved oxygen (mg.l-1) p.m. |
9.64 ± 0.41y |
10.10 ± 0.88y |
||
| Secchi transparency (cm) |
28.88 ± 1.37a |
26.63 ± 1.63b | 1.8 (*) |
0.017 t |
| Total alkalinity (mg CaCO3.l-1) |
87.9 ± 8.73a |
85.00 ± 5.71a | 8.98 |
NS |
| Chlorophyll-a (µg.l-1) |
41.07 ± 5.69a |
71.45 ±14.69b | 30.11 (*) |
0.002 |
| Primary productivity (g C.m-2.d-1) |
1.69 ± 0.27a |
1.77 ± 0.26a |
||
| TN (mg.l-1) |
3.16 ± 0.28 |
3.00 ± 0.17 | 1.03 NS |
<0.001 t |
| NH4-N (mg.l-1) |
0.12 ± 0.04 |
0.16 ± 0.06 |
NS |
|
| NO2-N (mg.l-1) |
0.13 ± 0.00 |
0.12 ± 0.00 |
NS |
|
| NO3-N (mg.l-1) |
3.31 ± 0.01 |
2.72 ± 0.00 |
NS |
|
| TP (mg.l-1) |
0.55 ± 0.02 |
0.66 ± 0.01 | 0.49 NS |
<0.001 t |
| PO4-P (mg.l-1) |
0.35 ± 0.07a |
0.47 ± 0.09b | 0.113 (*) |
0.012 |
The values presented above are means ± SE of mean. Data with different superscript letters (that is, a and b) in the same row and letters (that is, x, y, and z) in the same column for the same parameter were significantly different (P < 0.05). NS refers to no significant difference, whereas the P values with t denote differences according to time (that is, sampling dates), with dt referring to daytime (07 h 00 to 08 h 00 for a.m. – before noon; 14 h 00 to 15 h 00 for p.m. – after noon) and tdt referring to the differences considered for interaction treatment*daytime. LSD0.05 is the least significant difference to which means are compared to point out the significance at 5% level.
Nutrients in Water Seeping through Rice Field Soil
Samples of water that had filtered through rice field soil were analysed for N and P forms in order to assess the possible discharge of nutrients from the system to the underground environment. N forms did not differ significantly among the rice fields fertilised by effluent from ponds with one fish per m2 (RT2) and those fertilized with effluent from ponds stocked with three fish per m2 (RT3) (Table 3). However, water seeping in the fields treated by inorganic fertilizers (RT1) were found to have significantly higher concentrations (P = 0.001) of nitrates (0.30 ± 0.13 mg/l) than water from fields of RT2 (0.20 ± 0.09 mg/l) and RT3 (0.17 ± 0.08 mg/l) treatment. The RT1 N concentrations after seepage were slightly lower than those recorded in the pond effluent and water that flowed to irrigate the rice field. The TP concentration in water from the rice fields undergoing RT1 was significantly higher (P<0.05) than those in water from the rice fields undergoing RT2 and RT3 (which were not significantly different from each other).
Table 3: Concentration of nutrients in the outflow after water has leached into the rice field soil. RT1: rice fields fertilised by NPK and urea; RT2: rice fields fertilised by effluent of fishponds stocked with one fish per m2; RT3: rice fields fertilised with effluent of fishpond stocked with three fish per m2.
| Treatment |
Nutrients leaching through rice field soil |
|||||
| TN (mg/l) | TP (mg/l) | NH4-N (mg/l) | NO2-N (mg/l) | NO3-N (mg/l) |
PO4-P (mg/l) |
|
| RT1 |
2.58±0.77a |
0.63±0.24a | 0.28±0.08a | 0.02±0.01a | 0.30±0.13a | 0.11±0.04a |
| (1.05–5.67) | (0.1-1.3) | (0.015-0.545) | (0.001-0.066) | (0.052-0.825) |
(0.036-0.273) |
|
| RT2 |
3.23±0.89a |
0.45±0.16b | 0.23±0.06a | 0.02±0.01a | 0.20±0.05b | 0.14±0.07b |
| (1.330-6.370) | (0.1-1.1) | (0.010-0.456) | (0.004-0.040) | (0.019-0.354) |
(0.025-0.419) |
|
| RT3 |
2.66±0.65a |
0.46±0.11b | 0.28±0.09a | 0.02±0.02a | 0.17±0.05b | 0.14±0.06b |
| (1.33-5.67) | (0.2 –1.2) | (0.044-0.552) | (0.003-0.066) | (0.044-0.825) |
(0.038-0.287) |
|
| LSD0.05 |
0.71 (NS) |
0.117(*) | 0.07 (NS) | 0.01 (NS) | 0.063(*) |
0.025(NS) |
| P value |
<0.001 t |
0.005 | <0.001 t | 0.014 trt*t | 0.001 |
0.037 |
Data are mean values ± standard error of mean; different superscript letters in the same column denote treatments that are significantly different (P<0.05). The data in parentheses are the minimum and maximum recorded for each treatment; RT denotes rice field treatment; P values with t denote time-based differences (that is, sampling days); P values with trt*t refer to the differences considered for interaction treatment*time.
Nutrients in Rice Field and Fish Pond Soil
The pH, CEC, ammonia-N, TN, TP, and phosphates were analysed to characterise chemically the impact of integrated livestock (rabbits) and aquaculture on the soil at the bottom of the ponds as well as the soil in the rice fields. The results obtained for the start, midterm (90 days), and end (153 days) of the experiment are summarised in Figures 2 and 3. A slight increase over time in pH was observed in both the ponds stocked with one fish per m2 (PT1) and those stocked with three fish per m2 (PT2), with no significant difference being discerned between them (P<0.05). At the end of experiment, the pH averaged 4.78 and 4.92 in PT1 and PT2 respectively, while the averages were 4.65 and 4.70 respectively at the start of the experiment. The CEC averaged 9.69 and 7.98 meq/100g in PT1 and PT2 respectively, and were significantly different from one another (P<0.05). A decrease was noted in CEC, especially in the ponds stocked with the least fish, from the start of the experiment to the end.
TN concentrations were significantly higher (P<0.05) in PT2 than in PT1 at the end of experiment, but the observed N increase that took place over time within each treatment was not statistically significant (P<0.05). TN concentrations averaged 0.11 and 0.15% in PT1 and PT2 respectively, with a non-significant increase (P>0.05) with time, from 0.09 to 0.12% and 0.11 to 0.18% in PT1 and PT2 respectively.
There were no significant differences between P nutrients (TP and phosphates), nor between the treatments, nor among treatments, over time. As recorded for TN in the fish pond soil of PT1, the concentrations of TP and phosphates were slightly higher at midterm (that is, 90 days after stocking) than at the start and the end of experiment. This was most likely the result of the fish pond water being used to irrigate the fields, as pipes were placed near the sediment-water interface at the bottom of the ponds.
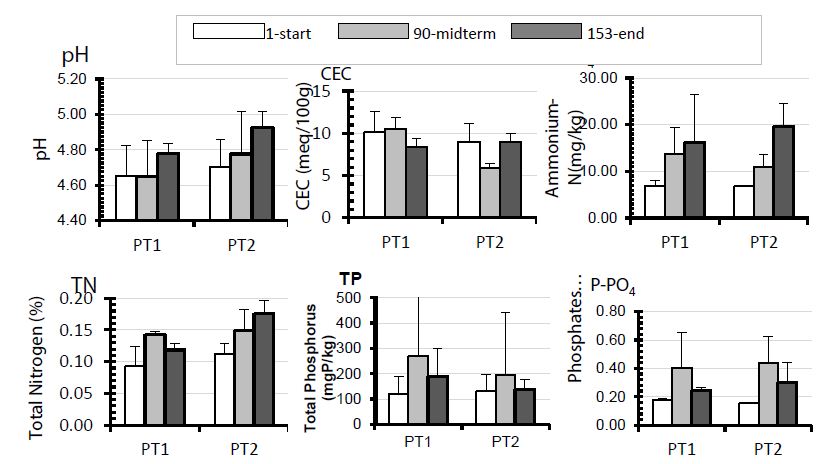
Figure 2: N and P in the bottom soil of fishponds that were fertilised by rabbit droppings and stocked with one fish per m2 (PT1) and three fish per m2 (PT2) in a rabbit-fish-rice integrated system in Rwanda. Data were collected at the start of the experiment (that is, after 1 day), at midterm (that is, after 90 days), and at the end (that is, after 153 days after transplanting) of the experiment.
Figure 3 presents the nutrient pattern in the rice field soil that emerged during the rabbit-fish-rice integrated system experiment. No significant changes of the parameters were observed within each treatment over the culture time. Only ammonia-nitrogen and CEC increased from the start to the end of experiment. The treatments also did not differ significantly (P>0.05) from one another at the end of the culture time for these parameters. Generally, N nutrient concentrations, TN, and ammonia (NH4-N), decreased in the midterm point of the experiment and increased at the end of experiment in all treatments. The rice fields fertilised by effluent from highly stocked ponds (RT3) had, however, slightly higher concentrations of N nutrients than did the rice fields receiving effluent from low stocked fish ponds (RT2) and the rice fields fertilised by chemical fertilisers (RT1). The mean concentrations for TN were 0.11 ± 0.05%, 0.13 ± 0.04%, and 0.14 ± 0.04% N in rice field soil for RT1, RT2, and RT3 respectively. Even though no significant differences were observed with regard to TP and phosphates (PO4-P) between the treatments, changes could be signaled within treatments over time and among treatments at the end of rice culture period.
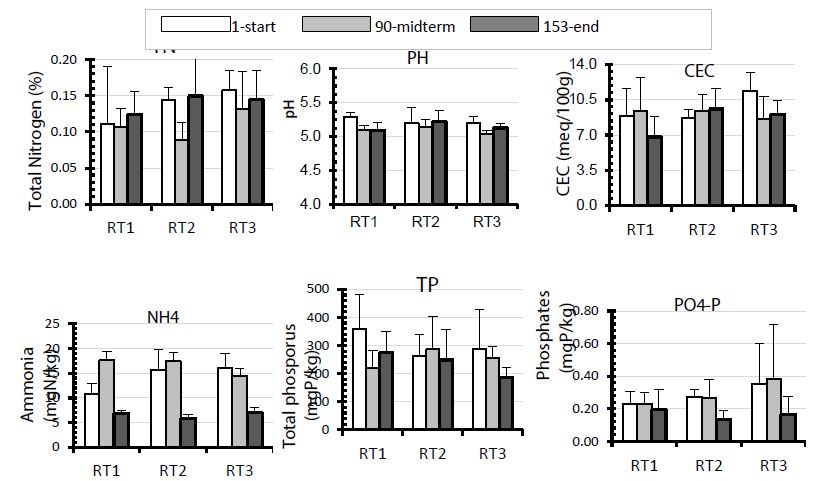
Figure 3: Chemical parameters in rice fields fertilised were as follows: RT1: chemical fertilisers (NPK and urea); RT2: effluent from fishponds stocked at one fish per m2; RT3: effluent from fishponds stocked at three fish per m2. Data were collected at the start of the experiment (that is, after 1 day), at midterm (that is, after 90 days), and at the end (that is, after 153 days after transplanting) of the experiment.
Phosphate concentrations were higher in RT3 (0.30 ± 0.2 mg P/kg) than in RT2 (0.23 ± 0.09 mg P.kg-1) and RT1 (0.22 ± 0.08 mg P.kg-1), and they decreased towards the end of the culture period. Inversely, TP was more highly concentrated in those rice fields that received NPK and urea (RT1) than in those (RT2 and RT3) fertilised by pond water effluent.
TP concentrations were high at the start (359.47 ± 112, 263.67 ± 74.77, and 288.17 ± 138.2 mg P.kg-1 for RT1, RT2 and RT3 respectively), but then decreased progressively to an average of 275.79 ± 73.8, 248.28 ± 107.1, and 186.06 ± 36.18 mg P.kg-1for RT1, RT2, and RT3 respectively at the end, with no significant differences recorded between the treatments.
Discussion
Source of Nutrients in the IRFR System
The productivity of all IAA fish ponds depended totally on inputs which originated mainly from on-farm and/or off-farm sources of nutrients – but all external to the fish pond [30,31]. Studies on the use of rabbit droppings and of the resource-flow in the IRFR system [32-34] have confirmed that rabbit droppings (faeces and urine) provide not only a better environment for tilapia but also a major source of nutrients on which the whole system of fish and rice production relied. The rabbit dung composition, in this study, showed that rabbit dung could be a better fertiliser than most other manure.
This study investigated the flow of nutrients (N and P) by means of their mass balance throughout the IRFR without considering a complete nutrient budget of the system. The mass balance of N and P nutrients showed that rabbit waste accounted for about 27.0% N and 79.1% of the P of the total nitrogen and phosphorus input supply. Of this, rabbit urine accounted for 20.0% N and 64.0% P of the total N and P respectively of the total fish pond inputs, thus highlighting the major role of rabbit urine in providing nutrients. The nutrient mass balance explains effectively the nutrient flow and contribution of each resource, but is not a good estimation of nutrient budgets which normally require an accurate estimate of the volume of water being exchanged in the system. This estimation poses difficulties: [35] reported the uncertainty and difficulty of estimating pond seepage and pond evaporation, arguing that methods based on changes in pond depth are prone to error. To avoid such errors, we opted for the nutrient mass balance. This method was also chosen because of the difficulty in determining the exact amount of pond mud, the denitrification, and the ammonia volatilization; in most studies these potential factors of N losses are estimated indirectly. The higher amount of nutrients contained in the influent water is due to the order of magnitude comparable to the organic resource amount as ponds are refilled after rice field irrigation by pond effluent; this confirms the success of such practices in Rwanda. The influent water provided up to 72.99% N and 20.91% P as an off-farm source of the N and P input to the pond; these quantities may have been principally constituted of dissolved organic nitrogen (DON) from the rice and vegetable fields upstream of the fish farming station. According to a study [36] the DON is decomposed slowly by bacteria and therefore accumulates over the rearing time, the DON was reported to be the major form of N [31,37] in fish ponds. Therefore, the nutrients available after decomposition of rabbit droppings by bacteria may have resulted largely from use during phytoplankton development.
Water Fertilisation and Nutrient Distribution
The concentrations of measured variables for water quality (Table 2) suggested good conditions for phytoplankton and tilapia growth. The significant increase during the day for pH and dissolved oxygen confirmed good phytoplankton activity; this activity, on the one hand, removes carbon dioxide by photosynthesis and, on the other hand, enriches the water with oxygen through the same process [12,38,39]. The removal of effluent to fertilise rice fields seems likely to have been the only probable reason for the fluctuation observed in TN and TP concentrations, during which N decreased mainly after the first month.
About 27% of the N and 79% of the P from the rabbit droppings were released in fish ponds, fertilising the pond water at a rate of 3.98 kg N and 1.94 kg P.ha-1.d-1; this is a higher rate than that (1.75 kg N and 0.39 kg P.ha-1.d-1) reported in an integrated Nile tilapia cage-cum-pond system [40] where tilapia were fed pellet feed and waste fertilised ponds were used to raise fingerlings. This rate is comparable to that (3.71 kg.ha-1.d-1 N and lower than 8.06 kg.ha-1.d-1 P) observed in caged hybrid catfish waste fertilising open-pond Nile tilapia [8]. The inputs from rabbits provided a pond fertilisation rate equivalent to the application of urea and triple superphosphates (TSP) at the rate of 4 kg.ha-1.d-1 of N and 1 kg.ha-1.d-1 of P used [7] in an integrated Lotus-Tilapia experiment (2 fish per m2) that resulted in a net fish yield (3345 ± 113.4 kg.ha-1.y-1), comparable to that obtained in the present study (2611 kg.ha-1.y-1 for 1 fish per m2 and 3459 kg.ha-1.y-1 for 3 fish per m2). The rabbit droppings thus raised substantially the TN and TP concentrations of pond water from 0.21 to 3.16 mg.l-1 of TN and 0.01 to 0.66 mg.l-1 of TP. Supplement material to that from rabbit waste might be canal water, fish waste, plankton die-off, and other external unaccounted sources such as levee and watershed erosion, small leaves from rabbit hutches, and leaves blown into the pond by wind [41,42]. Siddiqui and Al-Harbi (1999) [41], found that tilapia excreted 59-72% of the N and 60-62% of the P constituent in the feed. A study [43] observed that covering the pond edge substantially reduced nutrients in pond and concluded that run-off from the pond dyke was the major source of turbidity in the fish pond.
The effluent from the fertilised pond in this study held high amounts of TN (about 19175-18135 kg N.ha-1) and TP (3510-4225 kg P.ha-1 ) following their respective fish stocking rates (1‑3 fish per m2). When used to irrigate rice fields, these effluents provided the rice fields with about thirteen times the amount of N (1478 kg.ha-1TN) and more than twenty-six times (133 kg.ha-1 TP) of P obtained in treatment with inorganic fertilizers (NPK and urea). The role of rabbit droppings as pond fertiliser was thus clearly highlighted and the results showed that it was not necessarily dependent on fish stocking density. The reported study was limited in that only harvested fish, rice grain, and rice straw were assessed for N and P as major nutrient output of the integrated system.
N and P Recovered by Harvested Products
The assessment of N and P mass balance showed that with a low fish stocking rate, Nile tilapia recovered lower N and P from inputs than with a high fish stocking rate; this was probably due to the amount of fish waste in these ponds which logically surpassed that present in ponds with a low stocking rate. In low stocking rate ponds (1 fish per m2), Nile tilapia recovered 18.5% N and 16.9% P of the TN and TP of the rabbit droppings inputs, while this recovery was only of 4.9% N and 13.3% P of the total N and total P inputs, including that of the inflow canal water. In higher stocking density rate ponds (3 fish per m2), the fish recovered more (37.6% N and 34.3% P) of the total N and total P of the rabbit droppings input; including the canal water that refilled ponds, this was only 10.2% N and 27.13% P of the total inputs. Whatever the considered source of input, these nutrients recovery rates were higher than many recovered rates reported in various studies (Table 4).
The probable explanation for the differences shown in various recovery rates in Table 4 relies on how quickly each source makes nutrients available to the fish. It is known that when nutrients from feeds are directly used by fish, the recovery rate is higher than when fertilisers are used (Table 4). Tacon et al. (1995) in [44], found that supplementing feed in semi-intensive aquaculture farms improved N recovery, ranging from 5% to 25%, in fish. From Table 4, it can be argued that rabbit droppings must be better used by fish ponds than many other inputs to ensure a better environment for Nile tilapia growth.
Table 4: Nutrient recovery rates by Nile tilapia for various rearing systems.
| Rearing Integrated System |
Input origin |
Recovery rates |
Studies |
|
|
TN (%) |
TP (%) |
|||
| Intensive and recirculation tank for tilapia aquaculture |
Tank wastes |
21-22 | 18.8 |
Siddiqui & Al-Harbi1(1999) in Piedrahita (2003) |
| Intensive Aquaculture in tilapia |
Various feed |
47.73 | 18.18 |
Schneider et al. (2005) |
| Tilapia-cum-tilapia |
Caged tilapia waste |
20.52 | 27.98 |
Lin and Yi (2003) |
| Hybrid catfish-cum-tilapia |
Caged catfish waste |
12.75 | 14.27 |
Diana (1995) in Lin and Yi (2003) |
| Domestic wastewater-tilapia |
Treated sewage |
13.00 | — |
El-Shafai et al. (2007) |
| Chicken-cum-Nile tilapia |
Chicken manure |
15.5-21 | — |
Schroeder et al. 2003 |
| Rabbit-fish-rice |
Rabbit droppings |
37.6 | 34.3 |
This study |
The rice field component of the system received fertilised pond effluent as organic input for rice growth. The results showed that rice grain accounted for a lower percentage of input in fields fertilised with effluent (0.44-0.50% N and 0.22-0.25 P of the total N and P of the effluent input) than in fields treated with NPK and urea (6.11% N and 6.54% P of the total N and P inputs). The rice straw in fields fertilised by effluents accounted for 0.77-0.79% N and 0.71%-0.88% P, while it accounted for 10.79% N and 23.24% P of the total N and total P inputs. The differences obtained here seem logically to be due to the order of magnitude of each source of input. The amount of nutrients supplied in the effluent was high and therefore remained in the soil, the seepage, and contributed to weed growth during the farming period.
Nutrients in Pond Sediment, Rice Field Soil, and Seepage Water
Nutrient mass losses were difficult to measure precisely because the amount of sediment, infiltrated water, and nutrients accumulated in the rice fields were not quantified but only their concentrations in water and sediment assessed. Changes in sediment concentrations of P and phosphates followed the activity applied in the fish ponds. Normally P is strongly adsorbed by pond soil [6,11] directly from pond water, while N is lost primarily through ammonia volatilisation and denitrification [45-47]. Munsiri et al. (1995) [42] stated that organic matter, N, P, and TP in pond bottom soil accumulates strongly in the upper 10-20 cm of sediment as a result of the fertilisation process due to microbial activity. In the present study, TN and ammonia nitrogen, as well as TP and phosphates, increased up to midterm (that is, 90 days) but thereafter, except for ammonia nitrogen, decreased until the end of the experiment. The observed decrease in P and TN was most likely due to adult fish movement and the various factors causing waves (for example, pressure from the pipe sucking water) which disturb the sediment-water interface, thereby allowing re-suspension of nutrients sucked by the pipe to irrigate the rice field. Overall, no significant changes in nutrient concentrations were observed in the rice field soil, neither among treatments nor over time, and this demonstrated that nutrients were used by growing rice at almost same rate in inorganic or effluent fertilised fields. The ammonia, TP, and TP pattern in rice field soil showed higher concentrations at the beginning of the experiment as a result of fertiliser application and irrigation by pond effluent, but all these nutrients decreased at the end of the experiment. These observations agree [39] whose findings identified an increase of nutrients in the soil during the first 15 days after transplanting (DAT). The decrease in N and P at the end of experiment was probably due to the nutrient uptake by the rice in the growing phase, caused by the strong nitrification processes in the upper layer of the soil (De Dautta et al., 1985 in [39].
The present integrated system was designed in such a way that all effluent used for irrigation could filtrate through rice soil before it reached the environment. Lower concentrations, but not significant (P>0.05), were observed for TN, TP, and phosphates, while nitrates decreased significantly and ammonia increased in the water that reached the under layer of soil. N forms were higher in seepage water than P forms, suggesting that microbial activities on N were more intense at the soil surface and in the pipes in which ammonia concentration increased and surpassed that in effluent water. The seepage water accounted for only between 80 and 88% of TN and TP of the effluent that entered the rice field, between 29 to 40% of the soluble phosphates, and up to 6.0% of the nitrates of the effluents. This observation suggests that nitrates and soluble phosphates were the nutrients most used by the growing rice.
Conclusion
This study analysed the flow of nutrients in the integrated rabbit-fish-rice system and demonstrated that about 27% N and 79% P in pond water were attributable to rabbit droppings (faeces and urine). Rabbit droppings provided a fertilisation rate of 3.98 kg N and 1.94 kg P.ha-1.d-1, leading to fish yields comparable to those obtained from using urea and TSP at a rate of 4 kg N and 1 kg P.ha-1.y-1, yielding 3 344.6 kg.ha-1.y-1 for 2 fish per m2 stocking density of male Nile tilapia in an earthen pond.
Fish recovered about 18.5-37.6% N and 16.9-34.3% P of the TN and TP in rabbit dropping input to the pond. The relatively large amount of N and P that passed through pond water made the it especially appropriate for rice fertilisation and could replace totally the inorganic fertilisers used in common practice in the culture of rice. The re-use of tilapia pond effluent, captured from the bottom of the pond, allowed the recycling of the large amount of N and P by providing the growing rice with required nutrients at a high rate (118.5-125.3 kg N and 22.9-21.2 kg P.ha-1.d-1). The lack of these nutrients, especially N, is the most limiting factor in irrigated rice fields (De Datta et al., 1988 in [39]. In this way, in an integrated pond effluent and rice culture system, a large amount of N accumulated in the rice field, making the soil able to be better used in for a demanding rotated crop.
This integrated farming seems particularly environmentally friendly and sustainable, thus appropriate for resource-poor farmers in developing countries, such as Rwanda, as it recycles nutrients, thereby reducing the investment costs and the negative environmental impacts of aquaculture.
Further studies are needed to document the best fertilisation/irrigation frequency and to investigate the most efficient use of the effluent nutrients through the expansion of the current integration system. It is also recommended that a study should be made that aims at determining the complete nutrient budget of the integrated rabbit-fish-rice system.
Acknowledgment
The authors wish to thank the Nile Basin Initiative/ATP project for providing financial support for this study. They are also grateful to the workers of the Rwasave Fish Farming and Research Station (SPIR) for their commitment during the experiment. Thanks to Dr. Gatarayiha for his comment regarding statistical analysis applied in this paper. We acknowledge efforts and help by Mrs. Beulah John who proofread this article while she was not feeling good, many thanks.
References
- Cathcart T, Pote J, Rutherford D (1999) Reduction of effluent discharge and groundwater use in catfish ponds. Aquacultural Engineering 20: 163-174.
- Prein M (2002) Integration of aquaculture into crop-animal systems in Asia*1. Agricultural Systems 71: 127-146.
- Naylor RL, Goldburg RJ, Primavera JH, Kautsky N, Beveridge MCM et al. (2000) Effect of aquaculture on world fish supplies. Nature 405: 1017-1024.
- Edwards P (1998) A systems approach for the promotion of integrated aquaculture. Aquaculture Economics & Management 2: 1-12.
- Prein M, Assessment of aquaculture adoption by small farmers using sustainability indicators. Measuring the contribution of small-scale aquaculture: 107.
- Knud-Hansen C, McElwee K, Baker J, Clair D (1998) Pond fertilization: Ecological approach and practical application. Pond Dynamics/Aquaculture Collaborative Research Support Program, Oregon State University.
- Yi Y, Lin CK, Diana J (2002) Recycling pond mud nutrients in integrated lotus-fish culture. Aquaculture 212: 213-226.
- Lin C, Yi Y (2003) Minimizing environmental impacts of freshwater aquaculture and reuse of pond effluents and mud. Aquaculture 226: 57-68.
- Håkanson L, Carlsson L, Johansson T (1998) A new approach to calculate the phosphorus load to lakes from fish farm emissions. Aquacultural Engineering 17: 149-166.
- Lemarié G, Martin J, Dutto G, Garidou C (1998) Nitrogenous and phosphorous waste production in a flow-through land-based farm of European seabass (Dicentrarchus labrax). Aquatic Living Resources 11: 247-254.
- Boyd CE (2001) Aquaculture and water pollution. Decision support systems for water ressources management. AWRA/UCOWR summer speciality conference, Alabama Auburn University 153-157.
- Boyd CE, Queiroz JF (2001) Nitrogen, Phosphorus loads vary by system. The Advocate / Global Aquaculture Alliance USA: 84-86.
- Tucker C, Hargreaves J (2003) Management of effluents from channel catfish (Ictalurus punctatus) embankment ponds in the southeastern United States. Aquaculture 226: 5-21.
- Boyd CE (2001) Aquaculture and water pollution. Decision support systems for water resources management AWRA/UCOWR Summer conference 153-157.
- Yi Y, L.M. Lan, Lin CK (2006) Use of Wastewater from Intensive Hybrid Catfish (Clarias macrocephlaus x C. gariepinus) Pond Culture as Fertiliser for Rice Crop. In: Shinichiro Ohgaki K, K.F. (Ed.), The First International Symposium on Southeast Asian Water Environment (Biodiversity and Water Environment). O. IWA publishing, Bangkok, Thailand 258.
- Wood CW, Meso MB, Veverica K, Karanja N (2000) Use of Pond Effluent for Irrigation in an Integrated Crop/Aquaculture System. In: K. McElwee DB, M. Niles, X. Cummings, H. Egna (Ed.), Seventeenth Annual Technical Report. Pond Dynamics/Aquaculture CRSP. Oregon State University, Corvallis, Oregon, 104-107.
- Nhan DK, Milstein A, Verdegem MCJ, Verreth JAV (2006) Food inputs, water quality and nutrient accumulation in integrated pond systems: A multivariate approach. Aquaculture 261: 160-173.
- Devendra C, Thomas D (2002) Smallholder farming systems in Asia. Agricultural Systems 71: 17-25.
- Liu J, Cai Q (1998) Integrated aquaculture in Chinese lakes and paddy fields1. Ecological Engineering 11: 49-59.
- Thorne P, Tanner J (2002) Livestock and nutrient cycling in crop-animal systems in Asia. Agricultural Systems 71: 111-126.
- Gomez KA, Gomez AA (1984) Statistical Procedures for Agricultural Research. John Wiley & Sons: Laguna, Philippines.
- AOAC (1990) The association of official analytical chemists: Official methods of Analysis UKZN South Africa.
- Descy JP (1989) Manuel pratique des techniques d’analyse de l’eau. Analyses physico-chimiques. FUNDP- Namur, Namur Belgique 49.
- Léonard V, Kanangire CK (1998) Recueil de Methodes d’analyses physico-chimiques de l’eau, des sols et des aliments. Université Nationale du Rwanda / Facultés Universitaires Notre Dame de la Paix de Namur, Butare Rwanda 77.
- Wetzel RG, Likens GELa, WB Saunders Company (Philadelphia, London, Toronto) 375.
- APHA (1985) Standard methods for the Examination of water and wastewater. American Public Health Association: Washington DC, USA.
- Pauwels J, Van Ranst E, Verloo M, Mvondo Ze A (1992) Manuel de laboratoire de pédologie: Méthodes d’analyses de sols et de plantes, équipement, gestion de stocks de verrerie et de produits chimiques. Administration Générale de la Coopération au Développement.
- Termminghoff EJM (2000) Methodology of Chemical Soil and Plant Analysis. Wageningen University: Wageningen, The Netherlands.
- Niyotwambaza CH, Nhapi I, Wali UG, RukeraTabaro S (2010) Nutrient Distribution in a Fish Pond at Rwasave Fish Farming and Research Station, Rwanda. Rwanda Journal 21: 29-49.
- Rahman M, Yakupitiyage A, Ranamukhaarachchi S (2004) Agricultural Use of Fishpond Sediment for Environ mental Amelioration. Thammasat Int J Sc Tech 9: 1-10.
- Nhan DK, Verdegem MCJ, Milstein A, AV VJ (2008) Water and nutrient budgets of ponds in integrated agriculture-aquaculture systems in the Mekong Delta, Vietnam. Aquaculture Research 39: 1216-1228.
- Breine J, Teugels G, Podoor N, Ollevier F (1996) First data on rabbit dung as a water fertilizer in tropical fish culture and its effect on the growth of Oreochromis niloticus (Teleostei, Cichlidae). Hydrobiologia 321: 101-107.
- Van Vleet J (1997) Raising Rabbits over Fish Ponds. In: Veverica KL (Ed.), The third conference on the Culture of Tilapias at High Elevations in Africa. International Center for Aquaculture and Aquatic Environments, Rwasave Fish Farming Research Station / Butare, Rwanda 26.
- Rukera Tabaro S (2001) Effet de la fertilisation a base des dejections de lapins sur la productivité piscicole au Rwanda Biology. University of Namur, Belgium 89.
- Nath SS, Bolte JP (1998) A water budget model for pond aquaculture. Aquacultural Engineering 18: 175-188.
- Burford M, Thompson P, McIntosh R, Bauman R, Pearson D (2003) Nutrient and microbial dynamics in high-intensity, zero-exchange shrimp ponds in Belize. Aquaculture 219: 393-411.
- Jackson C, Preston N, Thompson PJ, Burford M (2003) Nitrogen budget and effluent nitrogen components at an intensive shrimp farm. Aquaculture 218: 397-411.
- Frei M, Becker K (2005) A greenhouse experiment on growth and yield effects in integrated rice-fish culture. Aquaculture 244: 119-128.
- Vromant N, Chau NTH (2005) Overall effect of rice biomass and fish on the aquatic ecology of experimental rice plots. Agriculture, Ecosystems & Environment 111: 153-165.
- Yi Y, Lin K, Diana SJ (2003). Waste recycling in fishpond culture through integrated culture systems. The American Fisheries Society 38: 265-270.
- Piedrahita RH (2003) Reducing the potential environmental impact of tank aquaculture effluents through intensification and recirculation. Aquaculture 226: 35-44.
- Yuvanatemiya V, Boyd C (2006) Physical and chemical changes in aquaculture pond bottom soil resulting from sediment removal. Aquacultural Engineering 35: 199-205.
- Yi Y, Lin CK, Diana JS (2003) Techniques to mitigate clay turbidity problems in fertilized earthen fish ponds. Aquacultural Engineering 27: 39-51.
- El-Shafai S, El-Gohary F, Naser F, van der Steen P, Gijzen H (2007) Nitrogen recovery in an integrated system for wastewater treatment and tilapia production. The Environmentalist 27: 287-302.
- Gross A, Boyd CE, Lovell R (1999) Effects of feed protein concentration and feeding rate combinations on quality of pond water and effluent in Channel catfish culture. The Israeli Journal of Aquaculture Bamidgeh 51: 47-57.
- Rukera Tabaro S (2012) In press. Rearing rabbits over earthen fish ponds in Rwanda: effects on water and sediment quality, growth and production of Nile tilapia Oreochromis niloticus L. Journal of Applied Aquaculture 22: 170-181.
- Schneider O, Sereti V, Eding E, Verreth J (2005) Analysis of nutrient flows in integrated intensive aquaculture systems. Aquacultural Engineering 32: 379-401.