Introduction
Today’s world is awash in technology. The opportunities for making money through technology emerge when the benefits of the technology can be communicated either to users or to investors or both. In the world of startup accelerators, hungry investors, and the public which has learned to accept the blistering pace of innovation as part of today. It has become increasingly important to communicate one’s invention in a way which convinces the listener and excites the potential investor. It should not be surprising then that there are classes on creating the so-called ‘pitch deck,’ the document designed to excite investors. There is a lot less interest in finding out just what information might excite the prospective purchasers, simply because, in the scheme of things, starting up and raising money are more important than initial and then repeat sales. It is no wonder that many companies know what to say to investors about the financial aspects of the product but do not know what to say about the product itself. That is, these start-ups but also many later stage companies are at a loss to describe the mind of their investors and/or the mind of their customers. This means that, when challenged, virtually all startups struggle, having overlooked the relatively minor effort to really understand in a scientific, discipline manner, people’s reactions to what they are offering. With that in mind, the opportunity arose to use Mind Genomics for a new product idea, patented in the U.S. (Patent No. US 10,340,546 B1) on Jul 2, 2019 (Figure 1). Simply put, the device is a biocompatible, self-recharging micro battery, as small as a grain of rice, that can be safely and effectively implanted within the human body to power at least one implanted medical device, using the patient’s own body fluids. This micro-battery can communicate with the physician, giving advance warning of an imminent heart attack or the presence of a serious communicable disease. The idea is new, revolutionary, and is in the pre-seed phase. The question is what kinds of messages about this product will excite people. To reiterate, messages mean the messages about the product, in terms of what it does, and what that means to the world of health. The Mind Genomics process described here required about four hours of investment, from start to end, a minor monetary investment. The paper describes the process, shows what was learned, and underscores the opportunity to use Mind Genomics and allied sciences of the mind to increase the likely success of an early-stage venture. Similar approaches have been over the last decade to create products, to help horticulture, etc. [1,2].
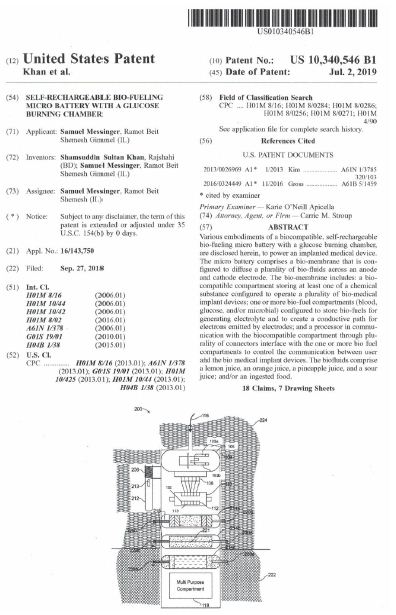
Figure 1: The patent for the biofuel cell.
Mind Genomics as an Emerging Science
Mind Genomics traces its history to the marriage of several disciplines, beginning with experimental psychology (especially psychophysics), merging with mathematical psychology (conjoint measurement), statistics, and applied consumer research [2]. The objective was and remains to understand the way people make decisions about topics, these topics being of the everyday [3-5]. Mind Genomics focuses on the specifics of a topic, a focus which forces the researcher to deal with the granular aspects, rather than with the grand vision. In other words, the researcher studies the actual product or service itself and, specifically, the minutiae that might otherwise be overlooked in the grand sweep of the ‘elevator pitch.’ Indeed, the granularity of the information provided by Mind Genomics in effect generates a ‘wiki of the topic,’ or an ‘MRI of the mind’ with respect to the product. The importance of such granularity of knowledge is overlooked again and again in the heat of excitement, the haste to get investors, and the omnipresent motivator in business, FUD (fear, uncertainty, doubt). The best way to understand the application of Mind Genomics to startups and pitches, the warp and woof of the venture world, may be through a worked case example, where there is little knowledge at the start of the effort. The body of the paper shows how to understand ‘what works,’ at the level of the structure of the messages (contribution of the individual elements and their combinations), and structure of the mind (influence of who the person is, how the person thinks). The result of the effort is a tool, the PVI (personal viewpoint identifier), which provides the inventor(s) or group raising capital the necessary knowledge of what specific aspects of the invention most promise market success.
As the reader follows the steps, it should be kept in mind that the process takes far longer to describe than it does to execute. Furthermore, the speed of the processes increases with practice and as the person becomes increasingly facile with the method.
Step 1: Choose the Topic. In this Case the Topic is the Patent, and Specifically What it Does
Step 2: Ask Four Questions Which Tell a Story
It is as this point that many people become ‘stuck, for the simple reason that people are not accustomed to think in a structured and creative manner, viz., to think analytically while at time having fun doing so.
Although one’s obsessive nature may demand that there be five, six, or even more questions, a key aspect of Mind Genomics is the requirement to keep the questions to a number that can be managed easily. In the early days, around year 2000, it was possible to do long interviews by web, with interviews lasting 15 minutes. The longer time required evaluating 48 to 60 vignettes is no longer feasible unless the respondents are well recompensed. Furthermore, as a practical issue, the longer studies with more questions and more answers (viz., 6 questions x 6 answers/question, or 36 elements) somehow ‘never seem to get done.’ They implode because everyone feels that she or he must make a ‘contribution’ to feel part of the process. Too many cooks do really spoil this broth. It is better in terms of process to run three smaller studies in one day, each small, but iterative, rather than that one comprehensive study which never seems to reach the execution phase because of yet another revision and the need for the different parties to agree. The smaller number of elements in the 4×4 design,16 elements, removes much time wasting, back and forth discussion, no matter how deeply people feel that they must discuss and ‘get it perfect’ before the effort, which itself will be done much more quickly, about 1-2 hours.
Table 1 shows the four questions and the 16 elements. These elements may or may not be the correct. One need not know. The underlying Mind Genomics process is quick, powerful, inexpensive. There is no need to be right. One needs to do the study. The data will quickly reveal which types of elements perform well. Subsequent iterations, when they occur, are simply built on the winning elements from the iteration before, the losers discarded, and new elements tried.
Table 1: The four question and the four answers (elements) to each question.
| Question A: WHAT is the biofuel cell? | |
| A1 | WHAT: Cell gets its energy from my own body fluids |
| A2 | WHAT: Cell is size of a grain of rice |
| A3 | WHAT: Cell implanted in a blood vessel in my body |
| A4 | WHAT: It is painless …. can save my life |
| Question B: HOW does the biofuel cell work? | |
| B1 | HOW: Early warning system for infections & heart attacks…programmed to detect viruses to help me and prevent spread |
| B2 | HOW: Uses my body fluids to generate electricity … no need for battery |
| B3 | HOW: Runs my insulin pump and/or pacemaker … no need for battery |
| B4 | HOW: Delivers medication to my body at right time … uses tiny computer chip |
| Question C: WHY should I want the biofuel cell? | |
| C1 | WHY: Peace of mind about having or not having a communicable disease |
| C2 | WHY: Peace of mind about having or not having a heart attack soon |
| C3 | WHY: Automatically contacts doctor via computer chip if it detects problem with me |
| C4 | WHY: Prevents me from infecting others by telling me if I have a disease, even before symptoms appear |
| Question D: WHO will pay for the biofuel? | |
| D1 | PAY: I will pay for it |
| D2 | PAY: My insurance company will pay for it in part |
| D3 | PAY: The government will pay for it in part |
| D4 | PAY: I will work with my insurance company and the government to get it paid |
Step 3: Combine the Elements into Vignettes, According to an Underlying Experimental Design
The experimental design specifies exactly 24 combinations, some having two elements, some having three elements, and the remaining having four elements. A vignette can have at most one element or answer from a question, but in many vignettes an answer from one of the four questions is missing. The strategy for this ‘incompleteness’ is that the structure of the combinations, the 24 vignettes, is such that all 16 elements are statistically independent of each other. That means that the absolute contribution of each of the 16 elements can be computed from the regression, making the approach of Mind Genomics exceptionally powerful in the nature of the information that it delivers. Finally, each respondent evaluates a totally unique set of the vignettes, created by permuting or shuffling the elements [6]. The benefit of that permutation approach is that a single study can cover a lot of the different vignettes. The pattern emerges much like the pattern of an MRI in medicine, emerging after combining the different snapshots of the mind, each snapshot from one of the experimental designs. The happy outcome is that the Mind Genomics process needs no basic understanding of the topic. The ease of setting up the Mind Genomics study (minutes), the cost (low), the speed (hours from start to end) make it possible to iterate several times to understand the topic, not by being right at the start, but by iterating to a solution almost painlessly.
Step 4: Select a Rating Question Pertaining to the Topic
Traditional approaches have asked simple, unidimensional questions, either using a rating sale (viz., how interested are you, 1=not interested … 5=interested; how much would you pay? 1=nothing …5= 10$). New methods include selecting an answer from a group of possible answers (viz., 1=sad, 2=happy, 3 = irritated, 4=curious, 5=excited), and so forth.
For this study we explored a two-dimensional answer, dealing with believing the information and buying the product, respectively. The reason was the relevance of these two dimensions both to understand the response to the product/service as marketers and the information to the investors, demonstrating knowledge of the product, and its economic potential.
Here is a new product to help you. It is a small fuel cell for your body!! Read each combination and rate on this scale:
1 = No way
2 = Believe: NO; Buy: NO.
3 = Believe: NO, Buy: YES
4 = Believe: YES; Buy: NO
5 = Believe: YES; Buy: YES
Step 5: Create a Short Classification Questionnaire to Further Understand the Respondent
These small-scale studies are meant to provide quick, deep answers to what interests the respondent, doing so in a study of three minutes or faster. The classification questions, answered at the start of the study, require only information about the respondent (gender, age), as well as an optional third question, with up to four answers. In our Biofuel study, we chose to ask the respondent about her or his medical situation (not relevant, think about situation occasionally, think about situation frequently, or currently monitoring a condition, respectively.)
Step 6: Launch the Product among a Group of Respondents Who are Members of a Large Panel (>10 million) for a 3-minute Experiment in the Form of an Interview
It is a false economy to use one’s own respondents as a panel unless they constitute individual who are otherwise difficult. Both in terms of time and ultimately in terms of money, it is far more practical to use external panels, provided by companies which charge a reasonable, relatively low fee on a per-respondent basis. The panel respondents in this study were provided by Luc.id, Inc., in the United States. The respondents provided can have any desired geographical, age, and other qualifications. The requirement was to work with respondents 50 years or older. These would be the individuals likely to need the product. The self-reported health concern (question 3) would be able to provide the response by individuals who say that they are actively monitoring conditions. Once the researcher has thought about the problem the mechanics involved in setting up, launching, and receiving data are virtually automatic, programmed, simple, fast, and after one or two experiences error-minimizing. It is not the doing, but the thinking which is difficult. Structured thinking of this type, no matter how seeming obvious it turns out to be, must be a conscious, formal part of the development of a communication program about WHY the new idea, and the economic benefits, here specifically, WHO wants the product. The Mind Genomics process forces the respondent to think deeply about the problem, and think quickly, both being important. There is no excuse in Mind Genomics for delay since the process is simple, templated, fast (hours), cost-effective, all leading to iterations. One need not know anything at the start of the iterations, but by three, four, or five iterations, one will have assembled the powerful insights and precise messages.
Step 7: Prepare the Data for Analysis
Each respondent generates 24 rows of data, one row for each of the 24 vignettes.
For our evaluation of the selling messages for the new biofuel cell, we create three key dependent variables:
Believe/Buy (Rate 5). This variable will be 100 when the rating for a vignette is 5, and 0 otherwise.
Neither Believe nor Buy (Rate 1,2). This variable will be 100 when the rating for a vignette is 1 or 2, and 0 otherwise.
Response time. This is the response time in seconds, to the nearest 10th of a second, for each vignette.
Table 2 shows the data from the study, data ready for the statistical analysis below. The table shows three rows of data from each of two respondents. The table begins with the row number, the panelist number, and the structure of vignette, viz., which questions does the vignette comprise. The middle of Table 2 comprises 16 columns to code the elements, with the value 1 corresponding to the element present in the vignette, and the value 0 corresponding to the element absent from the vignette. After the 16 columns come two columns, Rating from the 5-point scale, and the measured Response Time, respectively. Beyond 16 columns to code the input variables and the two original responses (Rating, Response Time), we find two new data columns. The first new data column corresponds to the most positive response, rating 5 (Do believe, Will buy). When the respondent selected the rating ‘5’ on the scale, this cell for the vignette in column Rate 5 is given the value 100, but when the respondent selected rating 1,2,3, or 4, this cell is given the value 0. The second new data column corresponds to the two most negative responses, rating 1 or 2. When the rating is 1 or 2, the cell for the vignette in this column is give the value 100. When the rating is 3,4, or 5, the cell is given the rating 0. A small random number is added to the values 0 or 100, simply to introduce some small but necessary variability in the binary ratings, in preparation for the analysis.
Table 2: Example of a data matrix showing three rows of data from each of two respondents.
|
Row |
Respondent # | Design Structure |
A1 |
A2 | A3 | A4 | B1 | B2 | B3 | B4 | C1 | C2 | C3 | C4 | D1 | D2 | D3 |
D4 |
Rating | Response Time | Rate5 |
Rate12 |
|
1 |
1 | ABC | 0 | 0 | 1 | 0 | 0 | 0 | 1 | 0 | 0 | 0 | 0 | 1 | 0 | 1 | 0 | 0 | 1 | 7.9 | 0 |
100 |
|
5 |
1 | ACD | 0 | 1 | 0 | 0 | 0 | 1 | 0 | 0 | 0 | 0 | 0 | 0 | 1 | 0 | 0 | 0 | 3 | 3.1 | 0 |
0 |
|
8 |
1 | ACD | 0 | 1 | 0 | 0 | 0 | 1 | 0 | 0 | 1 | 0 | 0 | 0 | 0 | 0 | 0 | 0 | 4 | 4.4 | 0 | 0 |
| 25 | 2 | ABCD | 1 | 0 | 0 | 0 | 0 | 0 | 0 | 1 | 0 | 0 | 0 | 1 | 0 | 1 | 0 | 0 | 1 | 9.0 | 0 |
100 |
|
32 |
2 | ABD | 0 | 1 | 0 | 0 | 0 | 0 | 1 | 0 | 0 | 0 | 0 | 0 | 1 | 0 | 0 | 0 | 2 | 8.0 | 0 | 100 |
| 33 | 2 | ABCD | 0 | 0 | 0 | 1 | 1 | 0 | 0 | 0 | 0 | 0 | 1 | 0 | 0 | 0 | 1 | 0 | 2 | 3.4 | 0 |
100 |
Step 8: External Analysis – Do the Groups of Respondents or Vignettes differ from Each Other?
By looking at the structure of the vignette we can learn about how the respondent makes decisions. Recall that each respondent evaluated a unique set of 24 vignettes, and that across the set of 121 respondents and 2904 combinations there are relatively few duplicate combinations. The strategy of covering a wide number of combinations (covering the ‘design space’) avoids repeat combinations in favor of more the combinations to be testing. Thus, it is, as yet, difficult to compare two or more groups on the score of the same test stimuli simply because there are few test stimuli. The objective in the design was to create as many unique vignettes as possible. It is possible and instructive to compare the averages of three key dependent variables across all key groups, if only to get a sense of the average values of the key dependent variables. Table 3 shows the averages for the three variables across all the relevant respondents in the group. Table 3 show two additional pairs. The first is the averages from vignettes 1-12 vs the averages from vignettes 13-24. This information tells us whether there is a change in the criteria as the experiment proceeds, with the respondent evaluating 24 vignettes. The second pair of data comes from the responses to vignettes read quickly (non-engaging, response time operationally defined as less than 2.25 seconds) vs read slow (engaging, response time operationally defined as more than 2.25 seconds).
Table 3: Average of the three dependent variables for all vignettes appropriate for the subgroup.
|
Rate5 |
Rate12 |
RT Seconds |
|
| Total |
22 |
21 |
4.48 |
| First 12 vignettes |
0 |
42 |
4.43 |
| Second 12 Vignettes |
43 |
0 |
4.53 |
| Slow RT > 2.25 Sec |
21 |
19 |
5.97 |
| Fast RT < 2.25 Sec |
22 |
26 |
1.35 |
| Female |
22 |
21 |
4.52 |
| Male |
22 |
21 |
4.41 |
| Age 50-59 |
22 |
21 |
4.44 |
| Age 60+ |
22 |
21 |
4.55 |
| Q3 3Often |
22 |
21 |
4.33 |
| Q3 4Monitoring |
21 |
21 |
4.71 |
| Q3 1No issue |
22 |
21 |
4.42 |
| Q3 2Sometimes |
22 |
21 |
4.52 |
| Rate5 Mind-Set 1 |
22 |
21 |
4.49 |
| Rate5 Mind-Set 2 |
22 |
21 |
4.41 |
| Rate5 Mind-Set 3 |
22 |
21 |
4.54 |
The Total panel generates these three averages across all 2904 vignettes.
Rate5 = 22, viz., 22% of the vignettes are assigned a rating of 5, so that 78% of the vignettes are assigned ratings of 1, 2, 3 or 4, respectively.
Rate12 = 21%, viz. 21% of the vignettes are assigned a rating of 1 or 2, so that 79% of the vignettes are assigned ratings of 3, 4 or 5.
RT = 4.5 meaning that on average the respondent rated a vignette 4.5 seconds after seeing the vignette. This suggests that it took the respondent about 108 seconds, or nearly two minutes to evaluate all 24 vignettes. The rest of the time was occupied with self-profiling classification, and so-forth, making the total time of about three minutes quite reasonable.
Table 3 shows the average responses of the three dependent variables, across Total Panel, Gender, Age, Health Concern (question #3 in the classification), and finally three mind-sets which emerged by clustering together respondents showing similar patterns of strong positive responses towards the elements (mind-sets from clustering). The averages are remarkably similar, except for the responses obtained for the first 12 vignettes vs the second 12 vignettes, and the pattern of rejection (Rate12), for those vignettes read quickly (26% of the vignettes rejected) vs those vignettes read slowly (19% rejected).
Step 9: External Analysis – Does the Structure of the Vignette “Drive the Rating”?
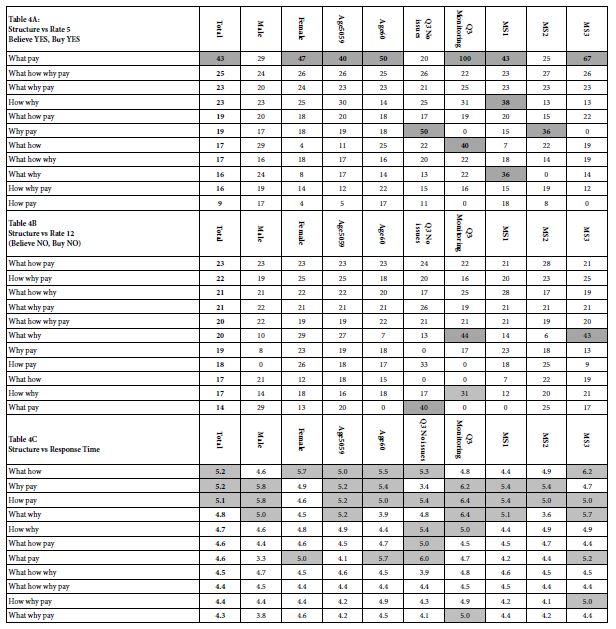
Our first external suggested minor differences across groups, except for the order of the vignette in the set of 24, or the rate of reading the vignette. It helps to understand how the structure of the vignette, the types of elements combined, drives the dependent variables, and whether there are any group differences. Knowing the impact of the interaction gives the researcher a sense of which types of combinations will, in general, drive positive or negative responses from the respondent (or customer or investor). In turn, Knowing the nature of the interaction between structure and subgroup with respect to response time tells us the groups who will be paying close attention to the messaging. It is important to reiterate that, at least yet, we have not seen detailed information about the elements. That information will come later. Our goal here is to better understand the types of messages as they are perceived by the respondents and as they engage the respondent in terms of paying attention. It is also important to note that the respondent does not think in terms of the structure of the vignette, since on average the respondent pays about 4.5 seconds attention to each vignette, sufficient time to read and assign an intuitive, ‘gut reaction.’ Longer response times than 4.5 seconds suggest that the vignette structure presents information which arrests the respondents speed through the interview and may represent a structure of information which strongly engages the respondent. Table 4 presents the averages of the three dependent variables (columns) by the 11 different structures used by the 4×4 Mind Genomics design. Table 4 is divided into three sections, Table 4A for the Rate5, Table 4B for the Rate12, and Table 4C for Response Time. The rows in each section of Table 4 are sorted by the Total Panel, allowing us to get a sense of what interests the respondents, what turns them off, and what engages them. In turn, the subgroups give us a sense of any key differences. To make the inspection of Table 4 easier we have darkened the key cells, respectively cells with averages of 30 or higher for the two binary transformed variables (Rate5, Rate12), and cells with response times of 5.0 seconds or longer. The data reveal patterns very quickly, patterns relevant to investors and marketers alike. The most striking is the importance of the combination of What it is and How it will be paid (AD). The least important is How it works and How will it be paid (BD). The ‘magic’ comes from the combinations of the elements, and that certain combinations are simply strong. When it comes to an outright rejection (Rating12, Not Believe, Not Pay), most of the cells are low. There are a few exceptions, especially for those who are monitoring a condition. When the vignette contains an element of ‘What it is’ and ‘Why should I use it,’ those monitoring a condition find this offensive. In fact, they find both ‘What Why’ and ‘How Why’ to be turnoffs, something that should be remembered when talking to a prospective buyer, but also key information to present to the funding group. Finally, respondents take different amounts of time to process the information. The most engaging vignettes are those with two elements, What How, Why Pay, and How Pay, respectively. The longer vignettes, the one with four elements, but a few with three elements, tend to be glossed over, or at least are less engaging. These results suggest that a great deal of information about the proper presentation can be gleaned simply by understanding the pattern of responses for the three key dependent measures, Rate5, Rate12, and Response Time. Despite the fact that we do not yet know the specific messages to put into the vignette, we should have a sense that the optimal vignette will incorporate ‘What it is’, and ‘How it’s paid for.’
Table 4: How the structure of the vignette ‘drives’ the ratings. The table shows the average values for three key dependent variables, by structure of the vignette (row) and by key group (column).
Step 10: Internal Analysis, to Understand How Elements Drive the Dependent Variables
The original rationale for Mind Genomics was founded on the premise that people could not tell the interviewer what guided their decisions but would likely try to please the interviewer by confabulating one. Such efforts would be especially obvious when the respondent would be asked about the criteria used to guide decision in the routine behaviors, those labelled ‘System 1’ by Nobel Laureate Daniel Kahneman [7]. According to Kahneman, but clearly observed every day, we make thousands of decisions, perhaps many more, simply during our daily lives, doing so virtually automatically. To create a science of the everyday requires an approach beyond observation (too limited, too expensive), and beyond questionnaires and surveys (subject to judgment biases, memory biases, etc.). First a short recapitulation is in order, in order to lay out the rationale for these next steps in the analysis. Mind Genomics works by presenting the respondent with the different vignettes, created by experimental design, doing so in a rapid pace. We saw that the average time for evaluation was approximately 4.5 seconds, from the time that the vignette appeared, and the judgment was assigned. During these 4-5 seconds, on average, the respondent read, thought (almost automatically), and rated the vignette. When these vignettes are presented rapidly, and when the vignettes are created by experimental design, it becomes difficult to think; one simply responds at an intuitive level. The happy result is judgment untainted by most of the cognitive biases which pervade the everyday research. One cannot change the judgment criterion to accord with the specific nature of an element (viz., price versus feature vs benefit, etc.) In contrast, the conventional, one-at-a-time approach the respondent can switch criteria rapidly, depending upon the nature of the element so as to give the ‘right answer.’ Not so with Mind Genomics, which combines these elements into wholes, gestalts, vignettes, each judged, de facto, by the same criterion. The respondent ends up neither able to nor even wants to be ‘correct’ or ‘consistent.’ The respondent simply wants to finish the task, typically doing so in a state of relative indifference, and thus answering honestly, or at least answering in an intuitive way. The benefit is that attempts to ‘game the system’, to ‘please the interviewer,’ to ‘get it right,’ are simply not possible. Armed with the foregoing, we now look at the deconstruction of the vignettes into the part-worth contributions of the elements, doing so by key groups. Each group was self-defined, except by the mid-sets. The mind-sets were discovered by doing the modeling at the individual respondent level, creating 121 models, and then clustering together individual respondents showing the same pattern of coefficients for their 16 elements as those elements drove ‘Rate5,’ viz Believe/Buy. The reader is referred to the in-depth treatments of the clustering method (k-means) in a variety of published papers [8-10].
The actual deconstruction of the vignettes is done by the statistical method of OLS, ordinary least-squares regression. The regression attempts to relate the presence/absence of the 16 elements to the dependent variable. The equations are written as follows:
Rate5 (Believe/Buy) = k0 + k1(A1) + k2(A2) … k16(D4)
Rate12 (Do Not Believe/Will Not Buy = k0 +k1(A1) + k2(A2)… k16(D4)
Response Time = k1(A1) + k2(A2) … k16(D4)
The OLS regression uses the entire data set from the relevant respondents to estimate the additive constant (k0) and the 16 element-linked coefficients (k1 … k16).
It is important to keep in mind that there is an additive constant for the regression model for Rate5 (propensity to believe/buy in the absence of elements), and for Rate12 (propensity to not believe / not buy in the absence of elements). For response there is no additive constant because there is no propensity to respond to a test vignette unless there are elements in the vignette.
Finally, one could create equations without additive constants for both Rate5 and Rate12. The conclusions would be the same, but the data would be someone less easy to understand.
Armed with the foregoing approach, we use the standard method of OLS regression to create models for nine defined subgroups. These are the ones that are most meaningful:
- The Total Panel… all respondents who participated.
- The three mind-sets MS1, MS2, MS3, which emerged from clustering together respondents with similar patterns of coefficients, based upon the models for Rate5 (Believe/Buy). Extensive studies using Mind Genomics suggest that the groupings emerging from this type of clustering generate clear, consistent, and interpretable patterns, pointing to radically different ways of thinking about a topic. These are the so-called mental primaries for a topic, albeit primaries emerging from patterns of response to a granular topic, rather than grand patterns across many topics. Mind Genomics works at the granular level, where the relevant stimuli are likely to be clear, and the relevant behaviors likely to emerge.
- Gender, age, health groups, those who have no concerns (answer 1 to question #3 in the classification), and those who are monitoring a condition (answer 4 to question #3 in the classification).
Step 10: Define the Meaning of the Coefficients, and Present Data in an Interpretable Format
The analysis in Mind Genomics generates a great deal of data because each element generates nine coefficients, one coefficient for each subgroup. Thus, the analyses involve three different groupings; three dependent variable (Rate5, Rate12, Response Time), nine key subgroups, and 16 elements. This total 3x9x16 or 432 cells of data to inspect to uncover strong performing elements and discern patterns.
To make the analyses easier we do the following:
- Present the subgroups in a new order, with Total and mind-sets first, because it will be with mind-sets that the major group-differences emerge.
- Blank out any coefficient which is 0 or lower, because the element with that coefficient is not a driver of Believe/Buy or Not Believe/Not Buy, respectively. A negative coefficient for Rate5 (Believe/Buy) means that the element may either be irrelevant (originally rated 3 or 4) or actively push away (originally rated 1 or 2). In turn, a negative coefficient for Rate12 (Do Not Believe / Would Not Buy) means that the element may be irrelevant (originally rated 3 or 4) or actively push away (originally rated 5)
- Shade all cells with coefficients of 6 or higher for Rate5 or Rate 12. Shad all cells with response times for the element of 1.5 seconds or longer.
Armed with this information, we can now look at the strong messages for the Biofuel invention. Table 5 is sorted in descending order for the positive elements of the three mind-sets. Occasionally an element appears twice in a table, scoring strongly in two of the three mind-sets (viz., coefficient of +6 or higher).
The rationale for presenting the data in descending order by mind-set is that only through mind-set do we see sufficient strong performing elements which, in turn, seem to cohere together to tell a meaningful ‘story.’ Keep in mind that the mind-sets are created through purely statistical methods, without any connection to what the mind-sets or clusters really mean. The researcher’s task is to select the minimum number of clusters which make sense and uncover the latent pattern. For our data, the assignment of the respondent mind-sets showed the clearest pattern when the clustering was done using the coefficients for Rate5 (believe/buy), and when three mind-sets were extracted. The three clusters thus become three new, non-overlapping groups. The separate data was used to create models for Rate5 (the original basis of the clustering), as well as models for Rate12, and models for Response Time. The compositions of the three mind-sets are fixed at after the clustering analysis. The compositions of the other groups are fixed at the time of classification, viz., the before the actual experiment. Once we know the respondents in each group, it is straightforward to create a summary model or equation for each group for each of the three dependent variables. The final act is to create the summary tables, doing so based on the three mind-sets, which carry most of the interpretable patterns. The other subgroups are presented as backup data. The actual interpretation of the data is not relevant for this research exercise, but is extremely relevant for the inventor, marketer, and the investor. Through understanding what specific aspects do very well (viz., high coefficients for a mind-set) it becomes straight to identify a lot more of the potential of the invention. One knows what to say, how to say it, and now to whom. The researcher may stop at one iteration or move quickly (or slowly) to the next iteration, simply deleting poorly performing elements and them. Over time guesswork turns into solid knowledge.
Step 11: Finding these Mind-sets in the Population
As Table 5 shows, especially Table 5A, it is in the mind-sets that one discovers the important messages. It is clear in this study as in most Mind Genomics studies. that the mind-sets are far more important than anything else about the respondent . Knowing the mind-set enables one to present the necessary information to engage that mind-set, to convince that mind-set, and to avoid saying the wrong thing, something that might immediately turn a prospect into a rejector. The traditional thinking of market researchers, political pollsters and the like is that ‘birds of a feather’ think the same way. That is, lacking a deeper understanding of how people think about the world of the everyday, those looking to understand why people differ from each other in known ways generally look at WHO the person is, what the person may THINK in general terms about a topic (e.g., attitudes towards health, or how a person BEHAVES (viz., what does a person search for on the Internet when exploring a topic). The effort towards classifying a group of people by WHO, by THINK and by BEHAVE is significant, usually reserved for large-scale problems. Mind-Genomics, dealing as it does with the granular aspects of the world, and often with the very ordinary (not in the case of the Biofuel Cell!) suffers from the paradox of being able to discover important mind-sets in the population in the short space of a few hours, but then grapples with the problem of generalizing this discovery so that it moves beyond simply a scientific fact, to be applied, whether for knowledge building, or action generating or hopefully both. The mind-sets are reasonably clear from Table 5 and could become the basis of three distinct sets of communications, whether to a customer or to an investor. ‘What to say to convince’ becomes a matter of research, not a matter of a dearly held opinion, possibly irrelevant or even worse, possibly counter-productive. Just consult Table 5B to see what ‘doesn’t work.’ On the other hand, what is the marketer to do when the distribution of the three mind-sets in the population is similar for each key subgroup, whether gender, age, or even monitoring a condition (Question #3, answer 4)? Table 6 suggests that it will be almost impossible to find the way to assign a new person to the proper mind-set. That impossibility discourages the wider use of a rapid, inexpensive, iterative, knowledge-developing system.
During the past four years, since 2016, authors Gere and Moskowitz have introduced and applied a new approach to assign a new individual to one of the mind-sets. The approach is known as the PVI, the Personal Viewpoint Identifier. The PVI uses the table of coefficients (Table 5A), summarizing the coefficients for the mind-sets. The underlying thinking is that the small study presented here provides insight into the basic mind-sets of a topic, viz., combinations of ideas which naturally go together, as can be seen with the small population. These can be likened to ‘mental primaries’, albeit primaries for a limited, quite granular topic, empirically uncovered from experiments. The issue is now to discover the distribution of these primaries across the world, and the lability of these primaries as a function perhaps of experience, of life-situation, etc. A secondary set of goals, not discussed here, is to relate these ‘mental primaries’ to relevant behaviors exhibited by people, viz., the expression of these primaries in everyday life. A third set of goals, also not discussed here, is to these ‘mental primaries’ primaries to genes, to uncover links between genetics and the mind, for defined topics where there is a suspicion that one or another gene might be involved in certain behaviors. Our focus here will simply be the presentation of the PVI, as a ready-to-use tool, one based upon the actual elements used to define the mind-sets. The PVI does not need any theoretical bridge between the mind-sets and the PVI composition. The components of the PVI are the same elements used in the study, with perhaps a slight editing to generalize them where needed. The mathematics underlying the PVI first creates noisy data by adding random variability to the original means, doing so many times, according to a Monte Carlo system. The analysis uses a decision tree to determine which elements and what weighting factors best assign the average individual in each mind-set to the correct mind-set. The scheme which works best across the thousands of perturbations is the scheme used for the PVI. The output emerges in the form of a link to the specific PVI designed for the study. That is the granular data are used as inputs to the assignment program. The PVI emerges with six questions taken from the elements of the study, and put into the form of a statement, with one of two answers. The pattern of the six answers assigns the new respondent to one of the three mind-sets. In studies comprising two mind-sets rather than three, the pattern of the six answers assigns the respondent to one of the two mind-sets. Figure 1 shows the set-up page, configured to be used with the Mind Genomics output. The set-up uses the data from the Mind Genomics study but requires the researcher to assign names to the mind-sets, to create a Yes/No rating question, and an introduction to the task given to the respondent. The actual PVI set-up is presented as an Excel® worksheet, in color, to make the process easy to do, fast, and subject to fewer errors. As part of the set-up, the researcher can specify a video and/or a landing page to which the respondent is immediately directed after the mind-set has been assigned by the PVI program for the specific individual (Figures 2-5).
Table 5: Coefficients relating the presence/absence of the 16 elements to the three dependent variables (5A for Rate5, 5B for Rate 12, 5C for Response Time). The table shows the total panel and key subgroups. Only positive coefficients are shown. Strong performing elements are shown by highlighted cells (coefficient +6 or higher for Rate5 and Rate12; response time of 1.5 seconds or longer).
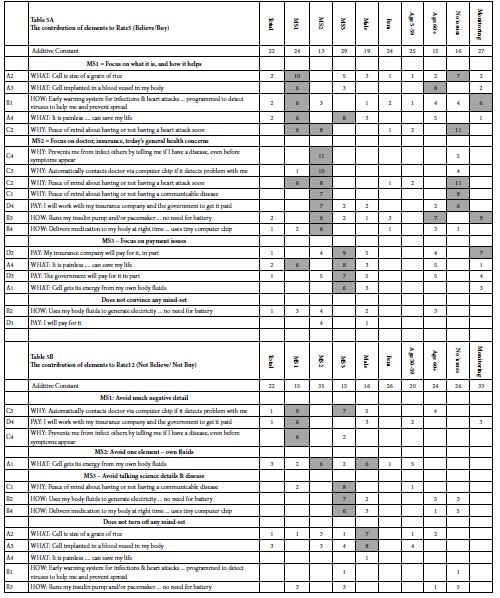
Table 6: Distribution of the total panel and three mind-sets across the different self-defined subgroups in the population.
|
Total |
MS1 | MS2 |
MS3 |
|
| Total |
121 |
41 | 41 |
39 |
| Female |
75 |
27 | 26 |
22 |
| Male |
46 |
14 | 15 |
17 |
| Age50x59x |
76 |
27 | 25 |
24 |
| Age60x |
45 |
14 | 16 |
15 |
| Q32Sometimes |
47 |
18 | 13 |
16 |
| Q33Often |
31 |
9 | 13 |
9 |
| Q31No issues |
24 |
8 | 9 |
7 |
| Q34Monitoring |
19 |
6 | 6 |
7 |
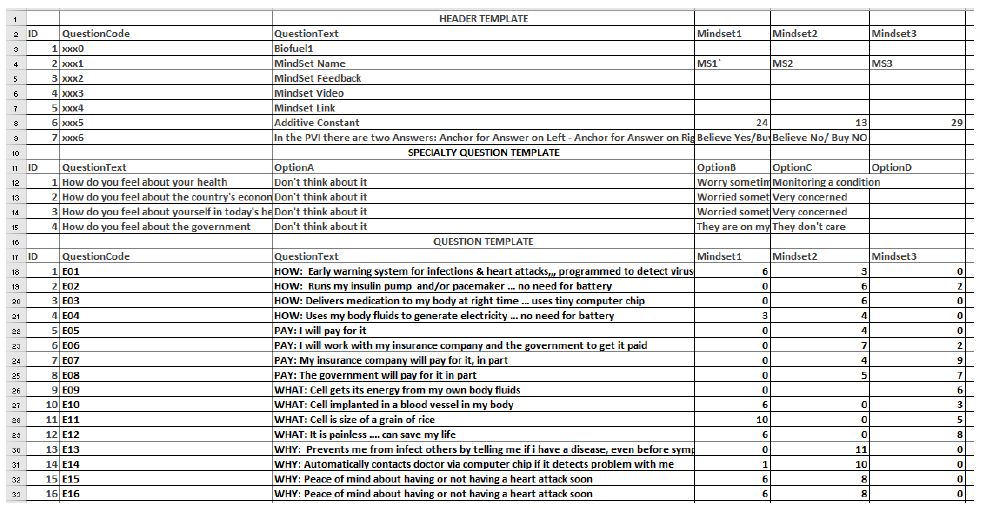
Figure 2: The researcher set-up for the PVI, using the output from the Mind Genomics study.
The orientation page for the respondent, as well as background information. The PVI can be configured to send the data to a database, as well as to the respondent, and to a staff person. The orientation page takes approximately 30 seconds to complete. Individual fields of data, e.g., gender, age, telephone, etc. can be suppressed to ensure privacy. Figure 3 shows the actual PVI, with four background or attitude questions, and the six questions emerging from the Monte Carlo algorithm. The PVI questionnaire also takes about 30 seconds to complete.

Figure 3: The orientation page for the PVI (personal viewpoint identifier) The link to the PVI is: https://www.pvi360.com/TypingToolPage.aspx?projectid=1267&userid=2018.
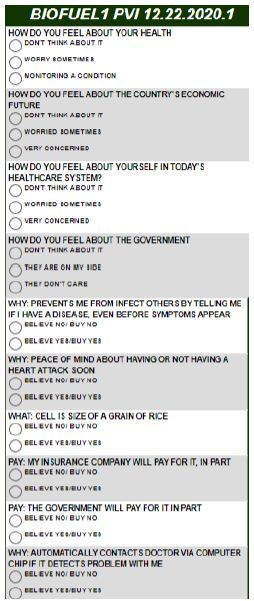
Figure 4: The actual PVI questionnaire, beginning with three questions about one’s attitudes toward health and finishing with six questions.
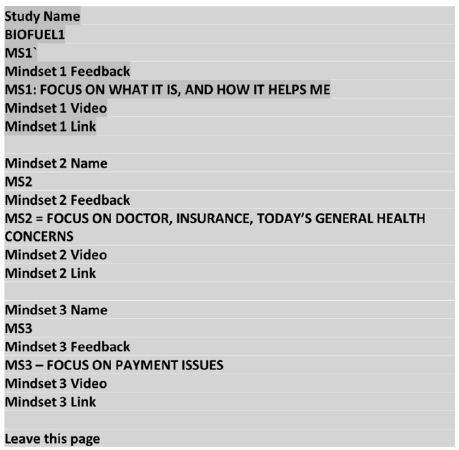
Figure 5: The feedback from the PVI. The data are stored in a database, along with the information from Figures 2 and 3. The respondent’s mind-set determined by the PVI is shaded (MS1).
The feedback for one respondent. This respondent was assigned to Mind-Set 1 based on the pattern of the responses. Figure 4 shows spaces for both a landing page and a link to a video stored in YouTube. Thus, at the time of deploying the PVI, the researcher may show the respondent a video and drive the respondent to a landing page. In the world of social issues, the PVI becomes a game, wherein the respondent finds out about himself or herself and is exposed to messages through video or landing pages.
Discussion and Conclusion
The ingoing rationale for the paper was the observation that in both the private sector with start-ups and in the public sector with major issues, there seem to be few ways to obtain affordable, solid, actionable data in the realistic framework of need for speed and clarity. The ‘soft’ data from people, used to back up major investments and scientific breakthroughs, seem again and again to be remarkably weak. ‘Subjective, soft data’ are perceived to be a necessary nuisance, either impossible to obtain because the data would take years to obtain or because the data simply is not valued. Often the data presented is qualitative, coming from a limited number of respondents or participants in a set of focus groups or depth interviews. Those data are important to set the stage, but they do not give the inventor, the business owners, the investors, or the government a sense of the ‘there there,’ in the immortal quip of Gertrude Stein. There is no need to discuss the specific data from the study. The data are simply of the type that the process delivers, with the nature of the data similar in general form from study to study, but sufficient in depth for any study to provide the necessary guidance. The study is the first of its kind, from the group associated with the inventor, author Samuel Messinger. Rather than polishing the results, it seemed most appropriate to take the results and explicate them, step by step, so that the paper becomes a guide to interpreting the results, a vade mecum. One outcome is that the reader gets a sense of how to do the study and what will emerge from the study step by step. The other outcome is the ease with which the reader can look at the data tables, to identify what to say, what not to say, whether it matters to whom, and ‘who are the relevant whom’.
Note
The Mind Genomics program (BimiLeap) is available at www.BimiLeap.com.
The Personal Viewpoint Identifier (PVI) is available at www.PVI360.com.
Acknowledgment
Attila Gere thanks the support of Premium Postdoctoral Research Program of the Hungarian Academy of Sciences.
References
- Levin LA, Langer KM, Clark DG, Colquhoun TA, Callaway JL, et al. (2012) Using mind genomics® to identify essential elements of a flower product. Horticulture Science 47: 1658-1665.
- Gofman A (2012) Putting RDE on the R&D Map: A Survey of approaches to consumer-driven new product development. In: A. Gofman & H. R. Moskowitz (Eds.). Rule Developing Experimentation: A Systematic Approach to Understand & Engineer the Consumer Mind, 72-89. Bentham Books. https://doi.org/10.2174/97816080528441120101
- Moskowitz HR (2012) ‘Mind Genomics’: The experimental, inductive science of the ordinary, and its application to aspects of food and feeding. Physiology & Behavior 107: 606-613. [crossref]
- Moskowitz HR, Gofman A, Beckley J, and Ashman H, (2006) Founding a new science: Mind Genomics. Journal of Sensory Studies 21: 266-307.
- Moskowitz HR, Porretta S, Silcher M (2008) Concept Research in Food Product Design and Development. John Wiley & Sons,
- Gofman A, Moskowitz H (2010) Isomorphic permuted experimental designs and their application in conjoint analysis. Journal of Sensory Studies 25: 127-145. https://doi.org/10.1111/j.1745-459X.2009.00258.x
- Kahneman D (2011) Thinking, Fast and Slow. Macmillan.
- Gere A, Zemel R, Papajorgji P, Moskowitz H, (2019) “Candy Is dandy”: The mind of sexuality as suggested by a Mind Genomics experiment. In Sex, Smoke, and Spirits: The Role of Chemistry pg: 17-31, American Chemical Society.
- Jain AK, Dubes RC (1988) Algorithms for Clustering Data. Prentice-Hall, Inc.
- Porretta S, Gere A, Radványi D, Moskowitz H (2019) Mind Genomics (Conjoint Analysis): The new concept research in the analysis of consumer behaviour and choice. Trends in Food Science & Technology 84: 29-33.