Abstract
Respondents evaluated systematically varied vignettes describing an automobile from brand KIA. The elements, component messages, presented stand-alone information about the product, performance, service, etc. Each respondent evaluated 48 unique vignettes, rating each vignette on purchase intent, and on the monetary concession that the dealer would have to provide to generate a rating of ‘definitely buy’ for that particular vignette. As the respondent proceeded through the sequential evaluation, the average rating of purchase intent decreased but so did the average dollar concession requested from the dealer. Deconstruction of the ratings into the part-worth contributions of each element revealed two minds-sets of equal size for when the mind-sets were derived from purchase intent (MS1 – Focus on car; MS2 – Focus on driver & situation), and two other mind-sets when derived from price concession (MS3 – Focus on the driving feeling of good product, good experience, good interaction with dealer; MS4 – Responds to deferential dealer, and boast-worthy car). A Mind Genomics cartography of a conventional scenario, e.g., person buying a car, can provide additional, easy-to-develop understanding of how the respondent negotiates, as well as reveal the specific messages which drive a respondent to say YES, MAYBE, or NO.
Introduction
With today’s improvements in technology, new opportunities are emerging to improve the skills of negotiation, ranging from courses on negotiation to electronic-based negotiation [1-3], as well as approaches, such as artificial intelligence. It should come as no surprise that along with the developments in the world of sales capabilities, a great deal of research has been published on the mind of the car buyer. The volume of information should not be surprising for the simple reason that cars are so important to the economy of the world. Next to a house, and education of one’s children, it is the car which often is the most expensive discretionary purchase of ‘something’. It should be no wonder that there has been much published [4]. A Google(r) search for ‘buying an automobile’ generates 907,000 hits for Google Scholar (r) and an astonishing 157 million hits for Google(r), both as of January 9, 2022.
This paper approached the issue of car buying from the point of view of one car, KIA. The objective was to understand from a general population what would be the most compelling messages, both in terms of ability to drive purchase intent, and , in a novel twist, the ability to create motivating price concessions from dealers [5]. Rather than qualifying a respondent ahead of time as interested or not interested in buying a KIA (pre-study screening based on one qualifying question), the study worked with a cross-sectional group of respondents, selecting in the end one or approximately four respondents would, when shown vignettes about KIA, rated at least one vignette ‘9’ (definitely buy), and one vignette ‘1’ (definitely not buy).
How Mind Genomics Works, and Differs from Conventional Attitude Research
Mind Genomics studies present respondents with combinations of messages, so-called vignettes, acquire the respondent’s reactions to these vignettes, and show the link between each element in the study, and the response which is engenders. Side analyses are also feasible and often illuminating, especially when the respondent assigns two types of ratings to the same vignette. In this study the respondent rated both purchase intent and amount of monetary concession from the dealer required to drive a rating of the vignette to ‘definitely buy.’ The Mind Genomics study is really an ‘experiment’, although couched in the form of an online research study, almost a survey although quite different from the classical surveys. The approach has been successfully implemented to create landing pages, and marketing messages for museums [6,7]. The approach provides a general way to understand the different points of view in the negotiation [8]. The overarching world-view of Mind Genomics is to create a usable, searchable, and scalable database about a topic that would seem ordinary, often under-explored, but in actuality reflects a relevant and often important aspect of daily life [9].
The Mind Genomics Method Applied to a Situation – Presenting Information about Brand KIA
The easiest way to understand the study is to follow the study process step by step for a study. The study introduced some departures from the standard Mind Genomics process, departures because of the initial commercial focus of the study, and from the realization that one had to work with respondents who could be persuaded to change their minds, rating at least one vignette 1 (definitely not buy), and rating at least one vignette 9 (definitely buy). If respondents could not be persuaded, the study would not allow us to assume we were dealing with individuals who could be persuaded. The criterion of at least one rating of ‘1’ (definitely not buy) along with at least one rating of ‘9’ (definitely buy) allowed us to reduce the set of respondents from 251 to 63. Thus, we can look at the larger study as the ‘screener’ from which we take only respondents who behaviorally could be swayed at least once. The observation that we discard 75% of the data is tempered by the fact that the data is more relevant to KIA because of this criterion.
Step 1: Create the Raw Materials for the Experiment
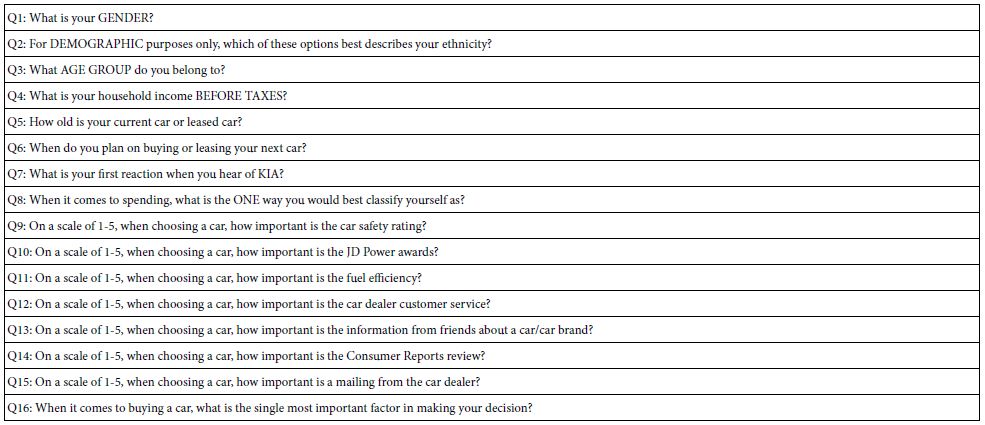
Select the topic, create six questions or topics relevant to the topic, and for each question provide six answers. Mind Genomics takes this raw material, the answers (not the questions), combines the raw material into vignettes, small combinations of messages, presents the combinations to the respondent and obtains a rating. Table 1 shows the raw material, put into the form of a table, comprising the six questions and the six answers (also called elements) to each question.
Table 1: The elements for the KIA study
It is important to keep in mind that the format of question and answer helps to drive the creation of the answers, viz., the raw material that will be shown to the respondent. When Mind Genomics was first introduced in the 1990’s, some thirty years ago, the request by users was to create a system which could handle many alternatives, while at the same time ensuring that a test stimulus, the so-called vignette or combination of elements, would never present mutually contradictory elements. By putting all mutually contradictory elements into a single question, and by ensuring that vignette would comprise at most one answer to a question, it was certain that the mutually contradictory elements would not appear together.
The second reason for the question and answer format is that it made creating the elements easier. Rather having to think about the topic in the abstract, the evolving Mind Genomics applications began feature a template, allowing the researcher to create a story. The respondent had to fill in the questions for the story (different aspects of the same topic), and the answers (elements) for each question. The process was easier because the researcher was given a structure within which to work (Table 1).
Step 2: Create Vignettes, Combining Messages, These Vignettes to be Evaluated by Respondents
Rather than instructing the respondent to rate each message one at a time, of course in random order to reduce bias, Mind Genomics works with combinations of messages, the vignettes. The vignettes are prescribed by an underlying experimental design, a recipe book, specifically created for Mind Genomics. Rather than creating the vignettes by randomly combining the elements, the underlying experimental design ensures that that each element appears equally often, that the combinations of elements allow for the analysis at the level of the respondent, and that the actual vignettes evaluated by each respondent differ from the vignettes evaluated by the other respondents. In this way the experimental design investigates much of the possible combinations (space filling), increasing the chances of discovery by testing more of the design albeit with less precision, instead of small parti of the design space but with more precision (Gofman & Moskowitz, 2011). Mind Genomics is best suited for finding out what really works, in a simulated real world situation where the test stimuli are compound, as they are in nature.
The experimental design prescribes by Mind Genomics for the array of six questions and six answers (elements) per question requires 48 different vignettes. The 48 vignettes comprise 36 vignettes having four elements, and 12 vignettes having the three elements. No question contributed more than one element to a vignette. The experimental design prescribed 36 vignettes in which two questions of six did not contribute an element, and 12 vignettes in which three questions did not contribute an element. The specific elements absented from the combination was dictated by the underlying experimental design, making the entire process straightforward, creatable by a template.
The benefit of the design as described above, viz. 3-4 elements, is that the design allows the researcher to estimate the absolute value of the coefficient, simply because the elements are not collinear. The issue may seem purely ‘theoretical’ until one realizes that many managers demand that their vignettes be complete, incorporating exactly one element from each question (in our case vignettes each of six elements), not realizing that this demand reduces the power of the analysis. Fortunately, Mind Genomics avoid the collinearity issue entirely.
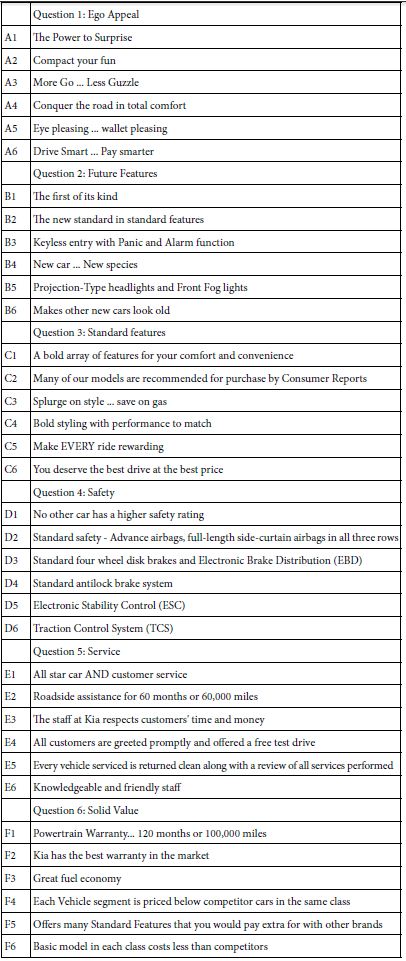
Figure 1A shows an example of a vignette, instructing the respondent to rate the vignette on the Likert scale of likely to buy. The scale is anchored at both ends, but not in the middle. The respondent reads the vignette as a single offering, and rate the vignette on the 9-point scale. The effort is easy because the respondent is presented with a vignette, a combination of elements. It makes ‘sense’ to rate the combination. One does not have to have a lot of information to rate the combination; it suffices simply to have a sense that this could be a real offering. It should be kept in mind that the scale below presents the two ends of the scale, not the middle. The rating ‘9’ (Definitely Will Buy, also called TOP1) will play a featured role in the analyses.
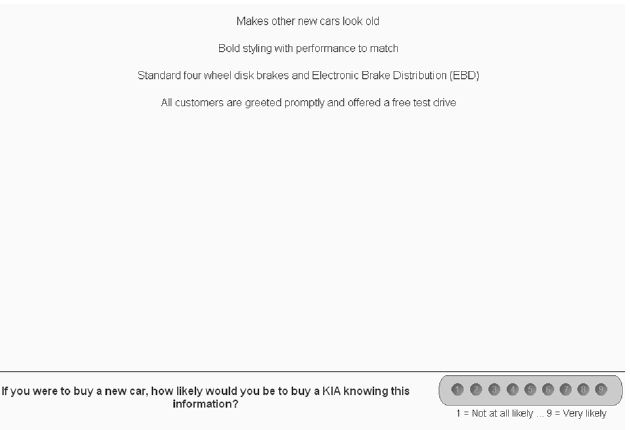
Figure 1A: Example of a four element vignette, with the instructions to rate the vignette
Another aspect of the Mind Genomics effort is the introduction of economics into the study, in this study through price as a rating scale. There are many way ways to incorporate price, such as price as one of the elements, as in Table 1. When price becomes an element (or really several prices become several elements), the objective is to discover how price drives the interest in buying the car. In such a case the typical observation is that people are less interested in buying the car assigned low ratings on the 9-point scale when the same car is offered at the higher price.
Another way to incorporate price is to ask a respondent how much she or he would pay for the car. Experience with price as a rating scale in Mind Genomics suggests that the price willing to pay for a car positively related to the liking of the car but the range of economic ratings are far more constrained than the range emotional ratings. That is, people may love the vignette describing the car (a response of their emotional or hedonic mind’ homo emotionalis), but they are not willing to pay a lot. Emotion is one thing, money is another.
The world of selling and buying presents us with a different problem, more of the type ‘how much of a discount does one have to give to a person for that person to seriously consider buying the product’. We need only look at the signs which features price discounts, or go to an automobile sales office to see the negotiation in real life. The salesperson is trained to reduce price until the buyer agrees to buy the car, walks out, or the process stops because the buyer and the salesperson cannot agree upon a price acceptable to both parties. This study attempted to replicate the give and take by asking the second question ‘If you could get these valuable offerings for less, what monthly savings (if any) would entice you to buy this car over a competitor’s car?
Figure 1B shows the same vignette, this time with second question replacing the first. The rationale for presenting the two questions, one after the other, is to reduce the effort on the respondent, who find the 48 vignettes sufficiently taxing to evaluate, and are compensated for their efforts. Doubling the amount of stimuli is simply infeasible.
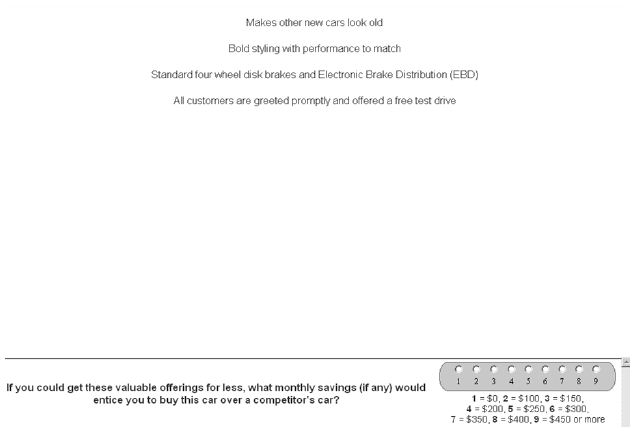
Figure 1B: The same vignette, this time with the price question
Step 3: Create the Orientation Page
The Mind Genomics interview comprises two parts, one of which is the evaluation of the systematically varied vignettes (Figures 1A and 1B), and the second is the completion of the self-profiling questionnaire. The respondent who participates usually does not know the reason for the study, and probably has never done this type of study (or experiment) before. The orientation, viz. the first screen that the respondent reads, presents information about the study.
Figure 2 shows the orientation screen. The screen presents just enough information to tell the respondent about the topic, but little more. It is the job of the elements shown in Table 1 to drive the judgment. Thus, the screen is simply a list of expectations that the respondent should have, such as the meaning of the scales, and the requirement that the respondent ‘mentally integrate’ the information into one idea, something which comes naturally to people. No effort is made to tell the respondent anything else. One recent practice, not done here, is to tell the respondent to give their immediate response, the practice emerging from post-study discussions with respondents who worried that they were not giving the ‘right answers.’ In this study, with the name KIA featured in the elements, and in the rating sale, it was deemed better to let the respondent evaluate the information in the way she or he ordinarily evaluates information when buying a car.
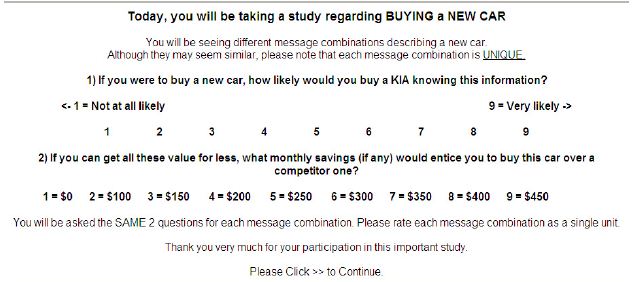
Figure 2: Orientation page for the study
Step 4: Obtain Respondents, Orient the Respondent, and Collect the Data
The respondents were provided by an on-line panel provider, Turk Prime, Inc., located in the metro New York area, with respondents across the entire United States. A total of 251 respondents agreed to participate, and competed the study, the entire process taking about three days, as different waves of invitations were dispatched. The only requirement was that the respondents had to be older than 21 years old. No effort was made to match the sample to any target. The information about the respondents was obtained by the self-profiling classification, whose questions are shown in Table 2.
Table 2: Self profiling questions
Step 5 – Identify the ‘Discriminators’ Who Could be Swayed
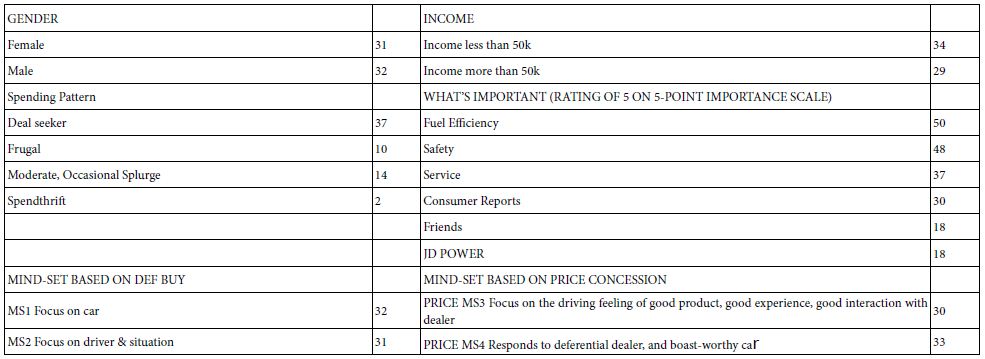
The typical Mind Genomics study focuses on issues of ‘how people think about the topic.’ This study dealt with responses to a specific car brand, KIA. The objective was to identify the relevant elements which would convince a prospective customer to say YES, viz. to say ‘I will definitely purchase this KIA car, when confronted with at least one vignette, and would also say ‘I will definitely NOT purchase this KIA car’ when confronted with another vignette. This criterion, viz., at least one vignette driving to a rating of ‘9’, and another vignette driving to a rating of ‘1’, reduced the 251 respondents to 63 respondents whose ratings showed that they could be swayed strongly, both positively (assigning at least one rating of 9, Definitely Buy), and negatively (assigning at least one rating of 1, Definitely NOT Buy). Table 3 shows the distribution of these 63 respondents in terms.
Table 3: Base sizes of key groups of the 63 respondents whose data are analyzed
Step 6: Is There a Pattern of Covariation between Interest in Purchasing the KIA and Price Concession?
The question is now the pattern, if any, between the rating of purchase intent (rows in Table 4) and the desired concession from the dealer (columns in Table 4). We might think that that a respondent who is ready to purchase the car would require less of a concession from the dealer, because the basic presentation of the car in the vignette is already attractive. The dealer concession would be a ‘sweetener’, but not the major driver, since the respondent has already said that she or he would buy the car (viz., a rating of 9, 8 or 7, respectively).
Table 4: Cross tabulation of the percent of respondents selecting a specific dealer concession for each level of rating assigned by the respondents. The rows add up to 100%.
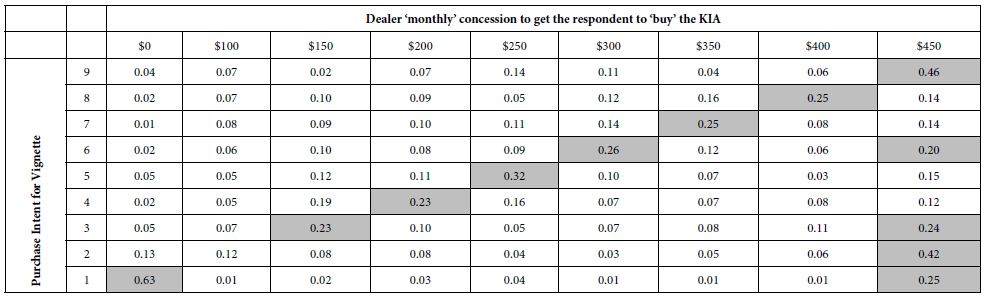
The pattern which emerges from Table 4 is not what we have expected.
- There is a linear relation between rated purchase intent and amount desired to close the deal, but paradoxically, the relation goes in the opposite direction from what might be expected.
- Those vignettes rated 9 (Definitely Buy) are overwhelming associated with a dealer incentive of $450. The dealer incentive is not to change the interest but to close the deal.
- For those vignettes rated 1 (Definitely not buy), there is no incentive to get the respondent to change her or his mind. 63% of the vignettes rated ‘1’ (definitely not buy) are associated with ‘no dealer concession can change my mind’.
- We see from the pattern of dealer concession an unexpected, somewhat paradoxical pattern. People who like something (as shown by their higher purchase intent ratings) also rate the vignette rating of price ‘higher’, viz., want a greater price concession from the dealer.
Step 7: Percent Respondents Choosing Definitely Buy When Offered a $100 dealer concession?
Each respondent profiled himself or herself on who the respondent is (e.g., male female), how the person shops (frugal vs. deal seeker vs. occasional splurger), and the importance of six different factors considered when purchasing a car. Three of them were information (consumer reports, rating by JD Power, word of mouth of friends). The other three were aspects of the car (fuel efficiency, safety, and service).
To review first, each respondent rated 48 different vignettes on a 9-point rating scale. The scale point ‘9’ was transformed to the value 100 to denote definitely buy. The remaining ratings, 1-8, were transformed to the value ‘0’ to denote ‘not definitely buy.’ In turn, the dealer concession scale (rating #2) was converted to the actual numbers. This set of transformations produces metric numbers to be used in a regression analysis, the regressions each estimated at the level of the individual respondent. To prepare for the regression analysis, a vanishingly small random number (<10-5) was added to each transformed number to ensure a minimum level of variation for regression, but at the same time a level that would not affect the coefficients of the regression model.
The final analysis was to estimate the relation between definitely buy vs. concession price. The equation was: (Definitely Buy) = k1 (Dealer Price Concession). The coefficient k1 tells us the amount of Percent definitely buy given a $100 dollars of dealer price concession.
The equation was estimated for each respondent. Each respondent generates a different value of k1. Figure 3 shows the distribution of individual coefficients, . Here is where the 100$ goes the further, keeping in mind that we are looking at the distribution for a subgroup of people. The groups which are likely to be most responsive to offers are: Females, Deal Seekers, Readers of Consumer Reports, Prize Fuel Efficiency, Prize Safety.
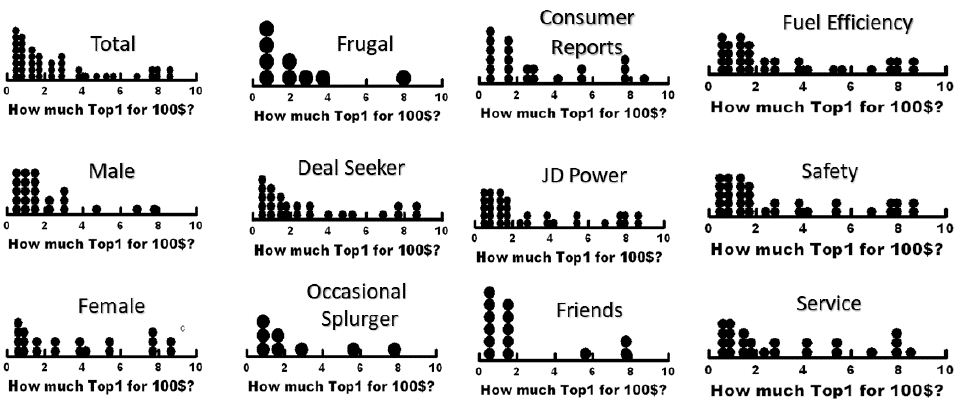
Figure 3: Distribution of a person’s Definitely Buy (TopP1) votes gained when a dealer gives a monthly price concession of $100. Each filled circle is corresponds to a respondent. Each key group of 12 key groups comprises a separate analysis. The abscissa percentages (0-10% additional definitely buy ratings).
Step 8 – The Effect of Repeated Exposures to Offers across the 48 Evaluations
One of the structural foundations of Mind Genomics is that each respondent is to be exposed to the right combination of vignettes, that ‘right combination’ structured by the underlying experimental design. Depending upon the specific design, the Mind Genomics study might comprise as many as 60 vignettes evaluated by a respondent (the 4×9 design, 4 questions, 9 answers or elements), or 48 vignettes (the 6×6 design used here), or 24 vignettes (the 4×4 design). Since 2019 the 4×4 design has been used increasingly frequently, the reason being the practical goal of making the respondent’s task easier. The last three years have witnessed massive oversampling by those parties who want who wants ‘feedback’ on services, and so forth.)
As respondents move through their 48 ratings, do the respondents change their criteria? It is impossible to answer this question by the simple method of repeating the same stimulus again and again, because this strategy to answer the question would entirely disrupt the Mind Genomics protocol. The respondent would either assign the same rating, or more likely assign the same rating and soon terminate the experiment with irritation.
Recognizing that each respondent evaluates a unique set of vignettes, another way we can answer question about changing criterion looks at averages at each test point, averages computed across all the respondents. For the study here we divided the vignettes into eight sequences of six vignettes each, defined as vignettes 1-6, 7-12,… 43-48. Within a single sequence we average the ratings for question #1 (purchase intent), and then average the ratings for question #2 (amount of a dealer concession to get the respondent to say ‘buy’). Thus, each respondent generates 16 new numbers, rather than 96. We then plot the average rating of purchase and concession on separate graphs, side by side, to show how the average rating changes as respondents moves through the valuations.
Figure 4 show these scatterplots of order x rating, for the total panel, and for respondents divided by WHO they are (left panel) and by what they say is most important. The ordinate is labelled ‘new order’ to show that it comprises averages across sets of six vignettes.
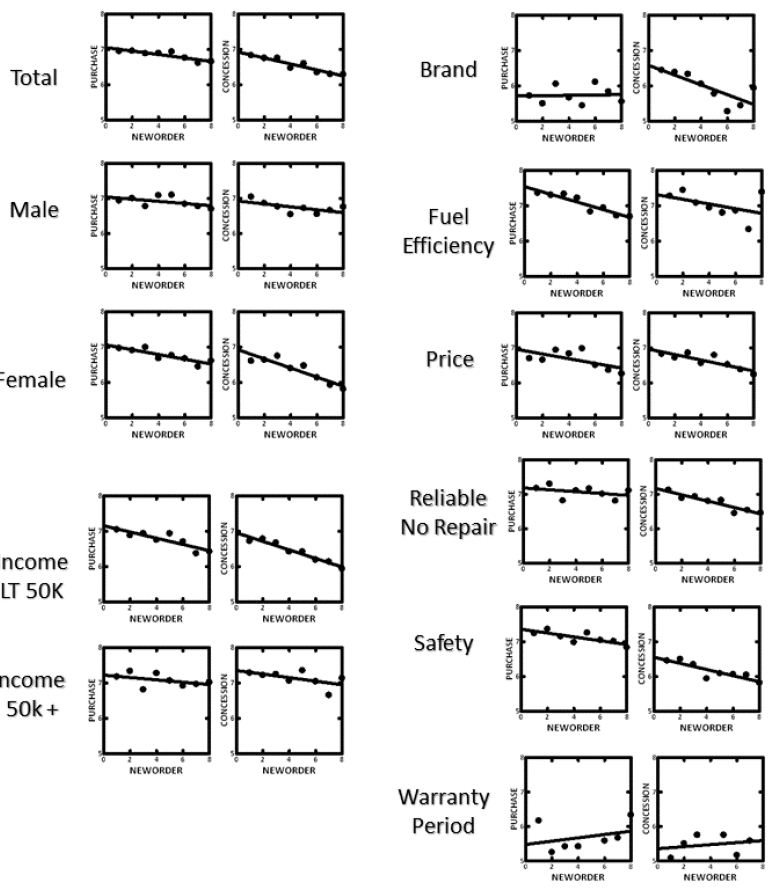
Figure 4: How purchase intent (left scatterplot and desired prices concession from dealer (right scatterplot) change as the evaluation of the 48 vignettes proceed. Each point is the average of 6 sequential ratings (viz., vignettes 1-6, 7-12, 13-18, etc.). The groups at the left are standard geo-demographics. The groups at the right are those who feel that the feature or benefit is extremely important.
For the most part, the curves are parallel. The key departures are:
- Most of the curves show decreasing interest in purchase with repeated exposure, and decreasing magnitude of desired dealer concession with repeated exposure
- With repeated exposures, high income respondents defy the pattern, and show a flatter slope for dealer concession versus
- Those who say brand is most important show no reduction in purchase intent with increasing exposure, whereas every other group does show the drop in purchase intent with repeated exposure.
- Those who say that warranty period is the most important show a strange pattern, of increasing purchase and increase requested dealer concession.
Step 9 – How Messages Drive Rating for Total Panel and Pairs of and Emergent Mind-sets
Our final analysis goes deeply into the messaging. A key benefit of Mind Genomics is the ability to estimate the power of individual messages, even without instructing the respondent to provide a judgment of how impactful each message might be. It is likely that the respondent would have an idea of what is very important, such as safety, price, warranty, etc., or at least the industry, its marketers and its researchers, as well as the advertising agencies would like to believe. Whether one is really cognizant of what is important, including the respondent herself or himself, remains an ongoing issue, not solved even after a century.
The benefits of Mind Genomics emerge when we consider that important need not be stated, but can be statistically inferred by the ability of an element to ‘drive’ a response, whether the response be the rating of interest in buying the car based on the vignette, or the dollar value of dealer concession that the element would command. We assume that in the case of DEF BUY, a high value associated with the element means that the element is a powerful driver of purchase. In contrast, in the caste of PRICE, we assume that a high value associated with the element means that if the message were to include that element, the dealer better be ready to give a bigger concession. In other words, with DEF BUY, bigger is better; with PRICE smaller is better.
Our final analyses relate the presence/absence of the 36 elements to Top1, at the level of the individual respondent: DEF BUY = k1(A1) + k2(A2) … k36(F6). Each of our 63 respondents generates an individual equation, made possible by the underlying experimental design associated with the data of each separate respondent. Unliked previous studies which included an additive constant, the individual-level (and subsequent group-level) modeling does not include an additive constant. The decision to not estimate the constant was to be able to compare estimated coefficients for DEF BUY, with estimated coefficients for PRICE. To do so, we run the same type of linear modeling for price versus elements, first at the level of the individual, and then at the level of the group.
The starting database for each variable (DEF BUY, Price, respectively) comprised 63 rows of data, one row per respondent. For each dependent variable, in turn, a cluster analysis divided the 63 respondents into two groups, based upon the pattern of coefficients. The clustering, k-means clustering [10], used the terms (1-Pearson correlation) to estimate the ‘distance between every pair of individuals. The k-means clustering then puts the 63 individuals into two non-overlapping sets, attempting to make the individuals in a cluster be similar based on the pattern of their coefficients (low distance between people), and at the same time make the distance as high as possible between the centroids of the clusters, viz., the average coefficient for each of the 36 elements, in each of two clusters.
Clustering is purely formal and mathematical, attempting to satisfying mathematical criteria. Clustering is only a heuristic; many different methods exist for clustering, and many different measures of pairwise distance exist within each method. The choice of k-means clustering and the use of the distance measure (1-Pearson Correlation) is simply a choice, with many other choices equally valid. Good research practice extracts as few clusters as possible (parsimony) while at the same time ensures that that each cluster ‘tells a story’ (interpretability). Parsimony is very important; one could tell better and better stories with more and smaller clusters, but the power of clustering to reduce the data to a manageable set would decrease, and general insights would be obscured by a wall of numbers.
Once the clustering is complete, the clustering program assigns each respondent to one of the two clusters for DEF BUY (called Mind-Set 1 and Mind-Set 2, respectively). The second run of the clustering program, based on Price, assigns the same respondents to one of the two other cluster for PRICE (called Mind-Set 3 and Mind-Set 4, respectively).
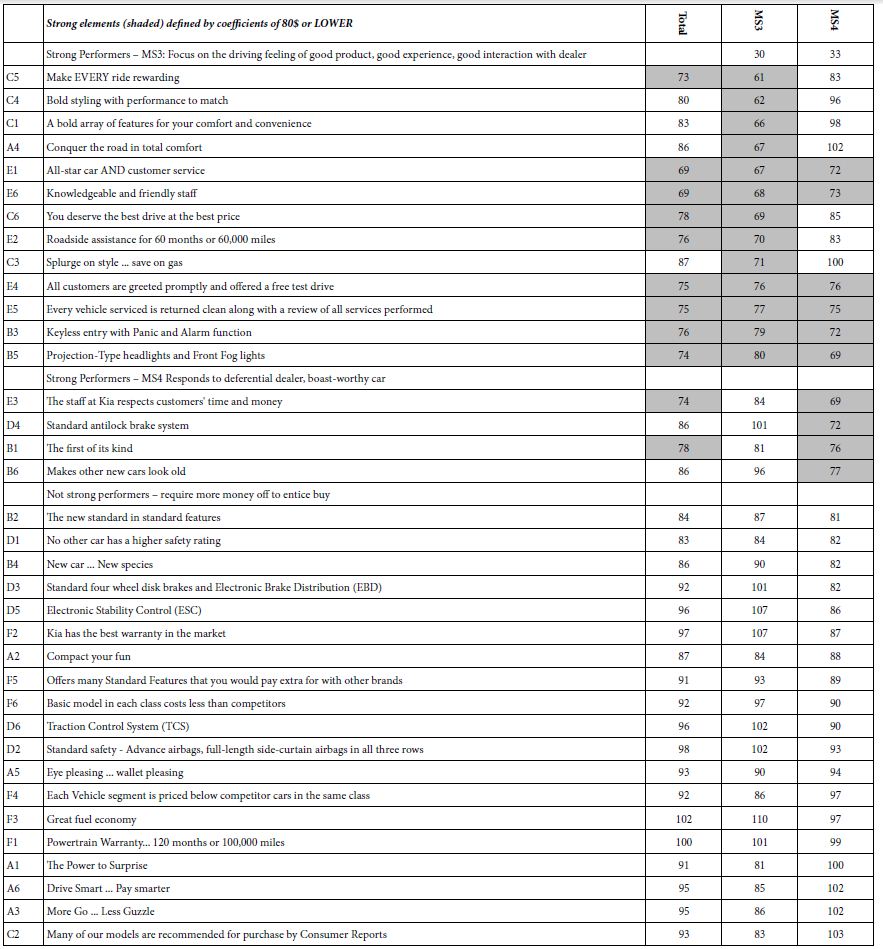
Table 5A shows the total panel and MS1, MS2, two emergent mind-sets (clusters) for DEF BUY. Table 5B shows the total panel and MS3, MS4, two other emergent mind-sets for price. All coefficients are shown for Total Panel, both strong performer, and weak performer alike. For the mind-sets, however, weak coefficients are simply deleted to make the patterns emerge more clearly. We call Table 5A homo emotionalis, because we consider the respondents to assign their ratings based upon their inner feelings about buying. We call Table 5B homo economicus, because the concession data invokes economics, and a presumably more rational way of thinking.
Table 5A: Clustering based on DEF BUY coefficients (purchase intent; homo emotionalis). Elements sorted by coefficients for MS1 and then MS2
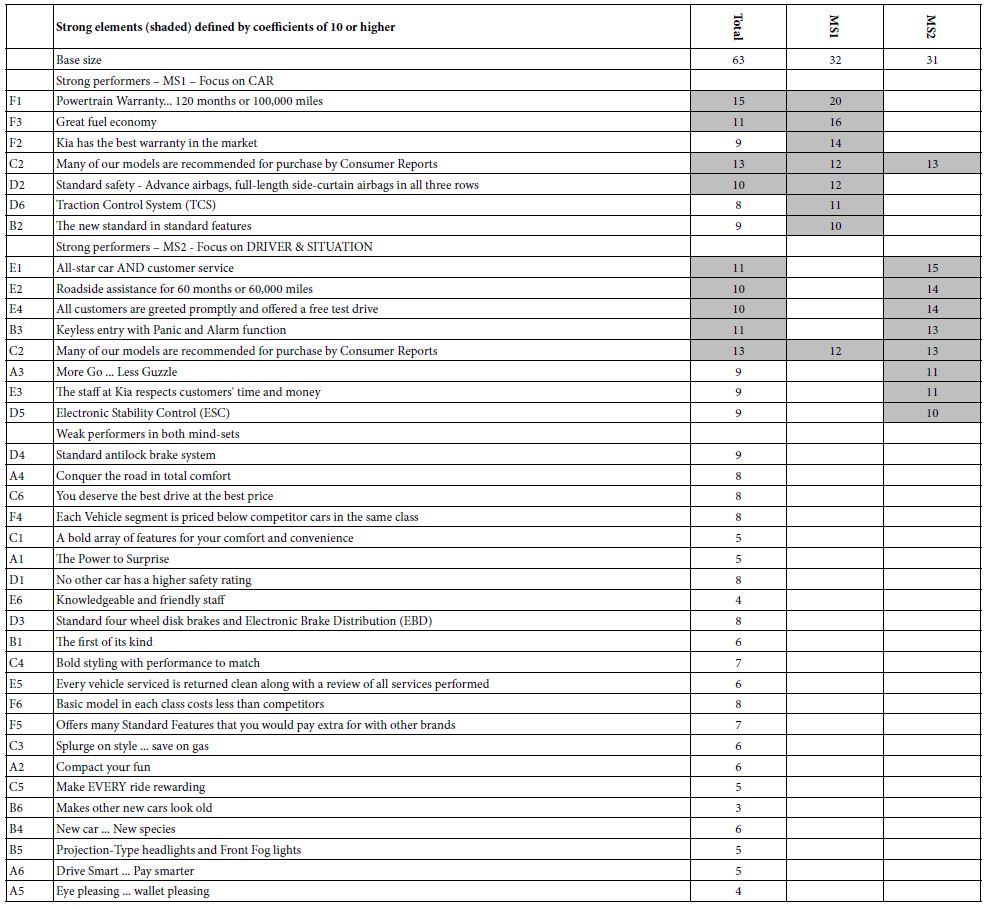
Table 5B: Clustering based on Price Coefficients (homo emotionalis). Elements sorted by coefficients for MS3 and then MS4
DEF BUY MS1 – Focus on car;
DEF BUY MS2 -Focus on driver and situation
PRICE MS3 – Focus on the driving feeling of good product, good experience, good interaction with dealer;
PRICE MS4 – Responds to deferential dealer, and boast-worthy car.
The clustering approach, doable as a short intervention in the marketing process, ahead of the messaging efforts, enables the company to increase the likely fit between the buyer and the salesperson. The potential exists for developing a knowledge-base of messaging (viz., a ‘wiki’ of the mind) for the topic of sales negotiations [11]. The results shown here suggest that such a wiki could be created rapidly, inexpensively, and scaled across different topics in the automobile category, and across countries. Simply knowing that people are different, and having a sense of ‘what works’ in the negotiation, available both to buyers and sellers, might produce a new dynamic in the world of marketing and sales.
An Update on the Purchasing of Cars – Changes Occurring Since the Study was Run
The authors wish to note that the data analyzed for this study were collected prior to the coronavirus pandemic, which began in March 2020. During the pandemic and up to the time of publication, lack of critical computer chips, a decline in new supply, and high demand for both new and used vehicles conspired to create a temporary situation where demand is outstripping supply. With vehicles of any type scarce, pricing for any car is at historic levels. Recent used cars, for example, are selling for prices at or near their original selling price, and new cars are being sold for premiums over MSRP. For these reasons, our findings should be seen as reflecting the pre-pandemic market. We expect that after the shortages ease, the market will return to its historical dynamics and that our findings will be hold.
Design for an ‘Updatable’ Mind Wiki of the World of Automobile Purchasing
We might say that Mind Genomics is a disciplined hypothesis-generating method, which even if it does not emerge with hypotheses about the way a specific part of the ‘world works,’ nonetheless provides a solid, archival database of the world of the mind, for a common behavior, in a known society, at a defined time, under specific circumstances. The fact that these Mind Genomics studies are easy to do, inexpensive, rapid, makes the creation of a database of the mind, a ‘Wiki of the mind of everyday situations’ well in the research of virtually every serious researcher.
What might this wiki look like, what would be its time and cost to develop, but most of all, what might this wiki add to the knowledge of people? If we move away from the world of the hypothetico deductive, and move to the systematic collection of data, such as the features of a KIA, we might lay out the wiki as follows:
- Basic design of a simple study = 4 questions, 4 answer per question, one rating scale (relevant for the situation)
- Number of situations =7 (e.g., thinking about a car, searching for information about a car, visiting a dealer, sitting down with the dealer, reading information about cars, closing the deal, specifying the financial arrangement, specifying service for after-purchase). For each situation, an in-depth set of say the 16 elements
- Number of brands = 10 (for each brand the same information, but the study is totally brand specific, including a ‘no brand at all’ as a brand)
- Number of countries = 10 (study is replicated the precise same way in each of 10 different countries, of course with the same car brand, or matching car brand if necessary)
- Number of respondents per study = 100
- Estimated time using Mind Genomics (BimiLeap.com) = six months (assuming team of individuals do the studies)
- Published costs (assume easy to find respondents) – $6/respondent, or $600/study
- Number of studies and cost per country – 70 studies x $600 = $42,000
- Number of countries – 10 or 700 studies x $600 = $420,00 for the entire wiki (plus time). The number of respondents can be increased by half to 150 for an additional $210,00
Discussion and Conclusions
Mind Genomics provides a tool by which to study the psychology of the everyday, in a way that might be called ‘from the inside out.’ The different analyses presented here are meant as a vade mecum, a guide to what might be learned in a simple Mind Genomics cartography. The cartography is exactly what it says, the act of mapping. There is no hypothesis testing in a Mind Genomics study, at least no formal hypothesis testing. Rather the study, indeed the experiment, is set up to observe everyday behavior, but in a situation where one can easily uncover relationships among behaviors and link behavior (or least verbal judgments) to the nature of the test stimuli [12,13].
With the foregoing as a post-script, what then can we say we have learned, or more profoundly, what are the types of information that Mind Genomics has provided, and which allow us to claim it as a valid method for science? It is certainly not in the traditional of the hypothetico-deductive system, which observes nature, creates a hypothesis about what might be happening, sets up the experiment, and through the experiment confirms or disconfirms that hypothesis. The hypothetico-deductive system is the most prevalent, popular way to advance science, building one block at time, fitting that block into the ‘wall of knowledge’, and creating an understanding of the world. The foregoing is hypothesis-testing.
When we look at the sequence of analyses presented here, we might see a different pattern. The pattern would not be one of offering hypotheses about the way the world works, even the world of automobile negotiation. We might create an experiment on negotiation to prove a point, such as the conjecture that a person who is ready to say YES wants more of a price concession than a person who is not ready to say yes. That would be the hypothesis, perhaps buttressed by reasons ‘why’.
References
- Beenen G, Barbuto Jr, J.E (2014) Let’s make a deal: A dynamic exercise for practicing negotiation skills. Journal of Education for Business 89: 149-155.
- Page D, Mukherjee A (2007) Promoting critical-thinking skills by using negotiation exercises. Journal of Education for Business 82: 251-257.
- Huang SL, Lin FR (2007). The design and evaluation of an intelligent sales agent for online persuasion and negotiation. Electronic Commerce Research and Applications 6: 285-296.
- Wu WY, Liao, YK, Chatwuthikrai A (2014) Applying conjoint analysis to evaluate consumer preferences toward subcompact cars. Expert Systems with Applications 41: 2782-2792.
- Kolvenbach C, Krieg S, Felten C (2003) Evaluating brand value A conjoint measurement application for the automotive industry. Conjoint Measurement Springer, Berlin, Heidelberg. pp: 523-540.
- Gofman A (2011) Consumer driven innovation in website design: Structured experimentation in landing page optimization. International Journal of Technology Marketing 6: 72-84.
- Gofman A, Moskowitz HR, Mets T (2011). Marketing museums and exhibitions: What drives the interest of young people. Journal of Hospitality Marketing & Management 20: 601-618.
- Moskowitz HR, Gere A (2020) Selling to the ‘mind’ of the insurance prospect: A Mind Genomics cartography of insurance for home project contracts.
- Moskowitz HR, Gofman A (2007) Selling Blue Elephants: How to Make Great Products that People Want Before They Even Know They Want Them. Pearson Education.
- Likas A, Vlassis N, Verbeek JJ (2003) The global k-means clustering algorithm. Pattern Recognition 36: 451-461.
- Gofman A, Moskowitz HR (2010B) Improving customers targeting with short intervention testing. International Journal of Innovation Management 14: 435-448.
- Moskowitz H, Baum E, Rappaport S, Gere A. (2020) Estimated stock price based on company communications: Mind Genomics and Cognitive Economics as knowledge-creations tools for Behavioral Finance.
- Gofman A, Moskowitz H (2010A) Isomorphic permuted experimental designs and their application in conjoint analysis. Journal of Sensory Studies 25: 127-145.