Abstract
In this short contribution, we present Raman data for the main lines of the synthetic system NaHCO3-NaDCO3. Furthermore, we show that some CO2– rich fluid inclusions in pegmatite quartz in the 1,400 Ma old Rønne granite from Bornholm Island contain D-rich nahcolite. Moreover, we also found 13C-rich CO2 in some fluid inclusions, as well as coronene [C24H12], a highly condensed six-ring polycyclic aromatic hydrocarbon. The occurrence of 13C-rich diamonds in a granite-pegmatite system forces the acceptance of supercritical fluids coming fast from the old mantle region. Maybe supercritical fluids are generally responsible for pegmatite formation.
Keywords
Raman spectroscopy, NaHCO3-NaDCO3-rich CO2 inclusions, 13CO2-rich inclusions, 13C-rich diamond, Pegmatites, Bornholm Island
During the study of nahcolite-rich [NaHCO3] inclusions in pegmatite quartz from Bornholm [1], we found carbonates that could not identified with Raman spectroscopy because of missing reference spectra. Other with Raman determined carbonates and bicarbonates are calcite, zabuyelite [Li2CO3], rare amounts of natrite [Na2CO3], gregoryite [K2CO3], kalicinite [KHCO3], and dawsonite [NaAl(CO3) (OH)2]. Also, graphite is present. A list of carbonate species is in Table 1, given in Thomas et al. 2011 [1]. Because most inclusions are composed of solid carbonates in CO2 only and there are a small couple of silicate melt inclusions, we can assume that the trapping temperature must be about 700°C or higher. After our studies [2,3] about supercritical fluids coming from mantle deeps, unusual mineral phases are possible. We think here on deuterium-bearing carbonates. No Raman spectra are available for deuterium-bearing nahcolite; therefore, we have synthesized such phases in the NaHCO3 – NaDCO3 system. Furthermore, we observed exceptional 13CO2-rich fluid inclusions, which can traced back to the reaction of the supercritical fluid with 13C-rich diamond present in the pegmatite quartz from Bornholm Island.
Sample Material
The about 1,400 Ma old granite from the Klippelokke quarry, 3 km ENE of Rønne (Bornholm Island, Denmark), contain uncomplicated quartz-feldspar pegmatite veins (subhorizontal or vertical) with a conspicuous graphic texture and only minor amounts of mica. The potassium felspar is flesh-red (called “red admirals”), and the quartz glyphs are smoky-colored (see Thomas et al. 2011) [1]. The quartz contains mainly fluid inclusions of secondary origin. However, a small number of quartz grains contain a very high number of carbonate- CO2 inclusions. Some inclusions also contain significant amounts of zabuyelite [Li2CO3] (see Thomas et al. 2011) [1]. In such grains, secondary fluid inclusions are rare. Figure 1 show typical nahcolite- bearing CO2 inclusions.

Figure 1: Typical nahcolite+D and CO2-bearing inclusion in pegmatite quartz from Bornholm Island.
Because there are no Raman spectra of deuterium-bearing nahcolite present as a reference in the literature, we have prepared such crystals by reaction of analytical poor NaHCO3 and D2O (heavy water).
The simple reaction is NaHCO3 + D2O → NaDCO3 +HDO (D2O in excess). (1)
By the further reaction of NaDCO3 with the produced HDO, we obtain, according to the following equation, the stable compound Na2HD(CO3)2:
2 NaDCO3 + HDO → Na2HD(CO3)2 + D2O (2)
The pure NaDCO3 compound is rare after the reactions (1) because the DHO concentration increases steadily. The pure NaDCO3 phase forms during fractionated crystallization under the microscope as tiny crystals (Figures 2 and 3). X-ray studies about the last compound must follow.
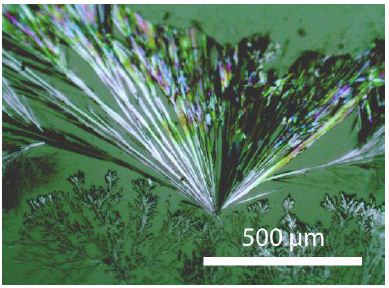
Figure 2: NaDCO3 crystals grown from a concentrated NaDCO3 solution under the microscope (in transmitted light).
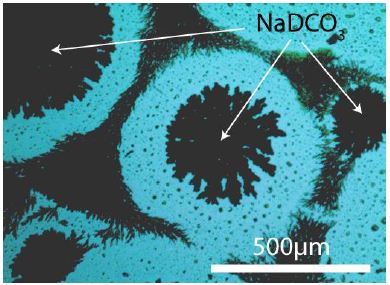
Figure 3: NaDCO3 crystals on silicon grown from a concentrated NaDCO3 solution under the microscope (in reflected light). The arrows show the pure NaDCO3 crystals.
Methodology
For our preliminary studies, we used only microscopic and Raman spectroscopic technics.
Raman Spectroscopy
We have performed all microscopic and Raman spectroscopic studies with a petrographic polarization microscope with a rotating stage coupled with the EnSpectr Raman spectrometer R532. The Raman spectra were recorded in the spectral range of 0–4000 cm-1 using an up to 50 mW single-mode 532 nm laser, an entrance aperture of 20 µm, a holographic grating of 1800 g/mm, and a spectral resolution ranging from 4–6 cm-1. Generally, we used an objective lens with a magnification of 100x – the Olympus long-distance LMPLFLN100x objective. The laser power on the sample is adjustable down to 0.02 mW. The Raman band positions were calibrated before and after each series of measurements using the Si band of a semiconductor-grade silicon single-crystal. The run-to-run repeatability of the line position (based on 20 measurements each) is ± 0.3 cm-1 for Si (520.4 ± 0.3 cm-1) and 0.5 cm-1 for diamond (1332.7 ± 0.4 cm-1 over the range of 80–2000 cm-1). The FWHM = 4.26 ± 0.42 cm-1. FWHM is the Full- Width at Half Maximum. We used a water-clear natural diamond crystal (Mining Academy Freiberg: 2453/37 from Brasil) as a diamond reference (for more information, see Thomas et al. 2022 [3].
class=”pdfsubheading”>Calibration Curve for the Determination of NaDCO3
For the construction of a provisional calibration curve between NaHCO3 and NaDCO3, we solved a small amount of analytical pure NaHCO3 in D2O 99.9% from PelementSamples, Belchertown, MA/ USA. We converted it into a significant excess of pure heavy water [D2O] into NaDCO3 according to reaction (1). We gave a droplet of this solution on a microscope glass slide with a hollow or semiconductor- grade silicon wafer (Figure 3 and Figure 4).
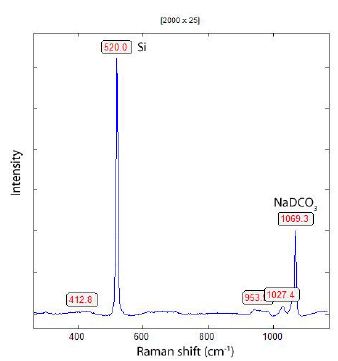
Figure 4: Raman spectrum of NaDCO3 on a Si wafer (520 cm-1 reference).
As described above, we produced NaDCO3-rich phases by reaction of NaHCO3 and heavy water (D2O) according to the equation (1) and (2). Richardson and Hood (1937) [4] wrote that the concentration of NaDCO3 is directly proportional to the amount of D2O. That means pure NaDCO3 crystals are rare (Figure 5).
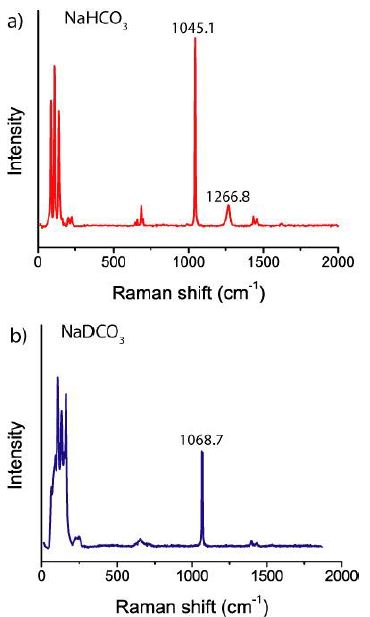
Figure 5: Raman spectra of NaHCO3 (a) and very NaDCO3-rich nahcolite (b) with D = 0.99.
The obtained Raman data are presented in Figure 6. For the first experiment, we used glass test tubes. The solution is strongly alkaline (pH ~ 11) and reacts readily with glass, forming K2CO3, KHCO3, and other compounds. The formation of K2CO3 could proved by Raman spectroscopy (see also Conrad 2020) [5]. Therefore, for most experiments, we used later plastic vessels. In Table 1 are the results of the Raman determination listed.
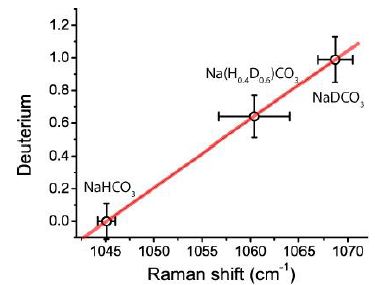
Figure 6: Calibration curve for the determination of the deuterium in mol fractions determined from the Raman shift.
Table 1: Results of the Raman measurements on pure NaHCO3 and NaDCO3 and mixed Na(HD)CO3.
|
Compound |
Origin | Mean (cm-1) | FWHM (cm-1) |
n |
| NaHCO3 |
RRUFF R070237 |
1045.3 | 4.82 |
1 |
| NaHCO3 |
This work |
1045.1 ± 0.9 | 5.41 ± 0.13 |
12 |
| On Si | ||||
| NaHCO3 | This work |
1044.1 ± 0.3 |
7.14 ± 0.23 |
6 |
| Na(H0.18D0.82)CO3 | This work |
1064.4 ± 1.8 |
13.71 ± 4.39 |
12 |
| NaDCO3 | This work |
1069.1 ± 0.2 |
5.91 ± 0.33 |
13 |
| On glass | ||||
| Na(H0.02D0.98CO3 | This work |
1068.3 ± 0.4 |
6.10 ± 1.17 |
10 |
| NaDCO3 | This work |
1069.3 ± 0.6 |
5.45 ± 1.18 |
11 |
Table 2: Results of the Raman measurements on pure NaHCO3 and mixed Na(H, D)CO3 in CO2 inclusion in pegmatite quartz from Bornholm Island.
|
Compound |
Origin | Mean (cm-1) | FWHM (cm-1) |
n |
| NaHCO3 | RRUFF R070237 |
1045.3 |
4.82 |
1 |
| NaHCO3 | This work |
1045.2 ± 0.4 |
5.58 ± 0.89 |
15 |
| Na(H0.32D0.68CO3 | This work |
1061.3 ± 2.5 |
19.87 ± 6.58 |
21 |
Table 3: lists the main Raman lines of synthetic NaHCO3, NaDCO3, and mixed phases in inclusions in pegmatite quartz from Bornholm Island.
|
NaHCO3 |
Rel. Intensity | NaDCO3 (synthetic) |
Rel. Intensity | NaDCO3-rich Bornholm |
Rel. Intensity |
|
88.7 |
s | 75.1 | s | 70.0 | m |
| 110.5 | vs | 110.2 | s | 99.0 |
vs |
|
141.4 |
s | 150.3 | m | 153.8 | s |
| 164.6 |
m |
||||
|
203.8 |
w | ||||
| 224.5 | w | 225.6 |
w |
||
|
684.7 |
w | 672.4 | vw | 695.2 | vw |
| 701.3 |
vw |
||||
|
1045.1 |
vs | 1069.2 | vs | 1065.1 | s |
| 1266.7 | m |
|
|||
|
1434.5 |
vw | 1428.3 |
vw |
Relative intensities: vs: Very Strong, s: Strong, m: Medium, w: Weak, vw: Very Weak. The mean for Bornholm is 1061.3 ± 2.5 cm-1 (21 different inclusions) and corresponds to D = 0.68 ± 0.11 and for 1065.1 cm-1 D = 0.84, the highest value.
From our observation under the microscope, we see for the reaction NaHCO3 + D2O an order of:
NaHCO3 → NaHnD1-nCO3 → NaDCO3 according to the equations (1) and (2).
Results
NaDCO3-rich CO2 Inclusion
In a small number of quartz grains in the Bornholm pegmatite, we found a high concentration of NaHCO3-rich CO2 inclusions. The amount of nahcolite [NaHCO3] in these inclusions is a high variable. Figures 7 and 8 show that variability, from about 0 to more than 40% (in rare cases up to 100%).
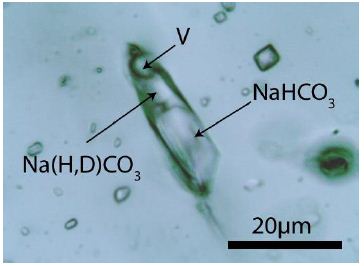
Figure 7: Complex NaHCO3-Na(H, D)CO3 inclusion in pegmatite quartz from Bornholm Island. V – CO2-rich vapor phase.
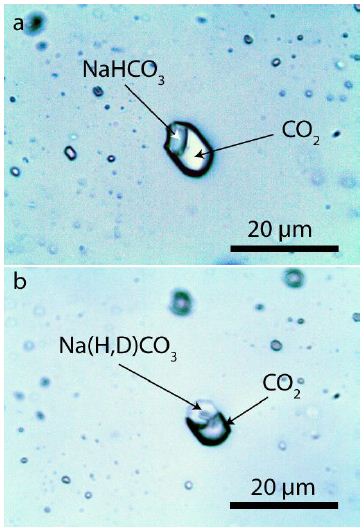
Figure 8: NaHCO3-rich CO2 inclusion in pegmatite quartz. a) The NaHCO3 inclusion is composed of pure nahcolite. b) a deuterium-rich nahcolite inclusion in quartz. The volume of this solid phase is about 40%.
13CO2-rich Vapor Phase in the NaHCO3-NaDCO3-Rich Fluid Inclusions
Some NaHCO3-NaDCO3-rich CO2 inclusions contain also 13CO2– rich phases. According to Vitkin et al. 2021 [6], there is a significant difference between the Raman position of pure 12CO2 and 13CO2, with 1388 cm-1 and 1370 cm-1 (Raman mode ν1), respectively. From measurements at nine different inclusions, we obtained a mean of 1381.6 ± 1.44 cm-1 and a FWHM = 14.8 ± 4.7 cm-1 corresponding to 35.56 ± 8% 13CO2. A natural reference with secondary CO2 inclusion in quartz, taken at the same conditions, gave almost pure 12CO2: 1387.94 ± 0.28 cm-1 (n = 11 different inclusions). Using a mean value comparison at a 0.999 statistical certainty results in a significant difference. A different method is used by Remingi et al. 2023 [7]. The 13CO2-rich fluid phase is the result of the interaction between supercritical fluid and 13C-rich diamond. Figure 9 shows an example of 13C rich diamond beside calcite in pegmatite quartz from Bornholm Island.
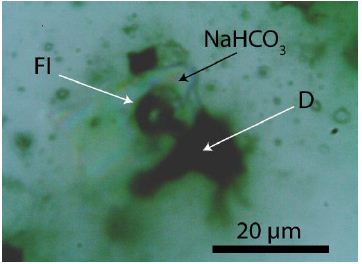
Figure 9: 13C-rich diamond in a near spherical calcite inclusion in pegmatite quartz from Bornholm Island. The figure shows the diamond grain (D) in calcite. In the calcite is a CO2-rich fluid inclusion (Fl).
From 10 different measuring points on the diamond (see Figure 10), a mean of 1316.11 ± 2.5 cm-1 and an FWHM = 60.54 ± 7.16 cm-1, and according to Thomas et al. (2021) [6], this value corresponds to about 40% 13C, which is relatively high. In the 13CO2-rich inclusions, we have often observed coronene [C24H12] (~1351 cm-1, FWHM = 9.9). Coronene is a highly condensed six-ring polycyclic aromatic hydrocarbon. For the formation, high temperatures are necessary.
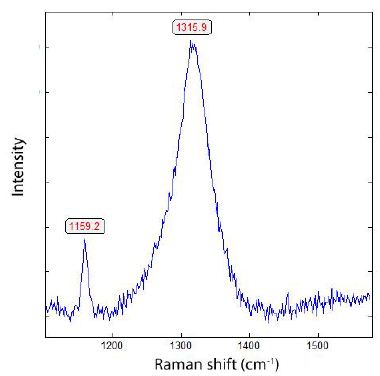
Figure 10: Raman spectrum of 13C-rich diamond in pegmatite quartz from Bornholm Island.
Discussion
The enrichment of D2O can be explained by enrichment of D2O by diffusion because the light water (H2O) diffuses faster than the heavy water D2O (Thomas and Davidson 2019) [8-11] in the supercritical fluid. The presence of 13C-rich diamond (Figure 10) shows clearly that a supercritical fluid has transported diamonds via supercritical fluid from mantle depths to the intrusion level of pegmatites. These findings force the idea that supercritical fluids are responsible for the formation of some pegmatites, as the author and coauthors have shown in many papers.
Acknowledgment
We dedicate this paper to Adolf Rericha from Falkensee/Germany for his insistent interest in supercritical fluids.
References
- Thomas R, Davidson P, Schmidt C (2011) Extreme alkali bicarbonate- and carbonate- rich fluid inclusions in granite pegmatite from the Precambrian Rønne granite, Bornholm Island, Denmark. Contrib Mineral Petrol 161: 315-329.
- Thomas R, Rericha A (2024) Meaning of supercritical fluids in pegmatite Formation and critical-element redistribution. Geol Earth Mar Sci 6: 1-5.
- Thomas R, Davidson P, Rericha A, Recknagel U (2022) Water-rich coesite in prismatine-granulite from Waldheim/Saxony. Veröffentlichungen Naturkund Museum Chemnitz 45: 67-80.
- Richardson JS, Hood GR (1933) An experiment with heavy water. The Journal of Physical Chemistry 37: 82-84.
- Conrad J (2020) Deuterium isotope effects on acid ionization and metal oxide – hydrolysis under hydrothermal conditions. Thesis, Guelph, Ontario, Canada. Pg: 505.
- Thomas R, Rericha A, Davidson P, Beurlen H (2021) An unusual paragenesis of diamond, graphite, and calcite: A Raman spectroscopic study. Estudos Geologicos 31: 3-15
- Remigi S, Frezzotti ML, Rizzo AL, Esposito R, Bodnar RJ, et al. (2023) Spatially resolved CO2 carbon stable isotope analyses at the microscale using Raman Scientific Reports 13: 1-11.
- Thomas R, Davidson P (2019) Shaw meteorite: water-poor and water-rich melt inclusions in olivine and Mineralogy and Petrology 113: 1-5.
- Thomas R, Davidson P, Rericha A, Recknagel U (2023) Ultra-high pressure mineral inclusions in the crustal rocks: Evidence for a novel trans-crustal transport Geoscience 12: 1-12.
- Thomas R, Davidson P, Rericha A, Recknagel U (2023) Supercritical fluids conserved as fluid and melt inclusions in quartz from the Sherba-Gold Mine, Barberton, South Aspects in Mining & Mineral Sciences 10: 1193-1196.
- Vitkin V, Polishchuk A, Chubchenko I, Popov E, Grigorenko K, et al. (2020) Raman laser spectrometer: Application to 12C/13C isotope identification in CH4 and CO2 greenhouse gases. Applied Sciences 10: 1-11.