Abstract
Three experiments explored the perception of the situation in a restaurant from the point of view of an observer. The first experiment, focusing on the projected feelings of a server in a situation, revealed the ease with which respondents were able to project the emotions of the server, as well as exhibiting two easy-to-uncover mind-sets. The second and third experiments focused on the expected price of the meal, expressed relative to the normal amount they would expect to pay. In these two experiments, The results were harder to interpret and did not tell a convincing story, either for the total panel, or for mind-sets extracted. We posit that the psychological mechanism for judging feelings, easily available when judging a situation, are different from the psychological mechanisms for judging the economic aspects of the same situation, when what is being judged is behavior, rather than a specific product..
Introduction
With the proliferation of the catering and restaurant industries, there is a wealth of knowledge emerging about the different aspects of food service, from the point of view of food, but also the point of view of service. Indeed, there is the Food Service Division in US-based Institute of Food Technologists, headquartered in Chicago, USA. There are similar divisions in other food-based organizations, such as the Research Chefs of America. Beyond these organizations are journals devoted to food service, such as Food Service Research. Furthermore, the importance of out-of-home-eating has sparked the growth of restaurants of all sorts, with the interest in how to make a restaurant succeed. Success is not only measured by momentary popularity, but by long-term customers, low staff turn-over, and the ability to focus on the restaurant, and not on the ancillary staff issues. Ideally, the restaurant should run smoothly, the service and food should be good, and the décor should make the restaurant a welcome place for repeat visits.
With the importance of food service, the authors began to consider the potential of understanding how outside people feel about the restaurant, when different aspects of the restaurant are described to them. The emerging science of Mind Genomics suggested itself as a way to get into the ‘mind’ of the prospective customer, based upon a description of the restaurant. The key difference for our Mind Genomics effort was the desire to look into the aspect of describing the restaurant ‘situation’ as it actually ‘is’, from the point of view of a restaurant professional (author Mazzio). The issue was whether it would be possible to understand the emotions of the situation (dubbed homo emotionalis), and whether it would be possible to understand responses to the situation manifesting themselves in monetary terms (dubbed homo economicus). These studies thus reflect a new avenue for Mind Genomics, studies of emotions and of responses expressed in term of money, rather than responses expressed in terms of feelings.
Comparing the ‘outside in’ vs the ‘inside out’ – Anthropology and Sociology vs Mind Genomics
Our approach uses a new way to explore social and psychological factors driving judgments, specifically going in depth from the’ inside out,’ rather than from the ‘outside in.’ Our approach merges sociology, anthropology, and psychology, to create a systematized approach to investigate the topic.
The sociologist investigates the social structure of a situation, the roles people play, and attempts to formulate the structure based upon behavior. There is rarely a focus on the individual in other than a part of this situation. The sociologist adopts the nomothetic approach, searching for general rules of structure of the group. The sociologist might use observation of groups, coupled with questionnaires, surveys, and so forth. The sociologist might even move to big data, large arrays of compiled statistics. When applied to the restaurant, and specifically to the quick server ‘local diner,’ the sociologist eventually uncovers the structure people, positions, and activities regarding what goes on in a restaurant, the nature of cultural norms, and so forth. There is little in the way of focus on the mind of the individual person in the restaurant, what the person feels, thinks, and so forth, except as part of the nomos, the general description of the typical day, and ordinary behavior [1-5].
When we move from sociology to anthropology, we move more deeply into the behavior which occurs [6]. The anthropologist produces a much finer description of what happens in a situation, such as a restaurant, albeit with the focus on a specific restaurant, rather than a summary of restaurants in general. Thus, an anthropological study of the behavior in a local neighborhood diner would focus on a deeper description of the behavior in one or a few restaurants (see as examples; [1, 7-9]. With today’s tools, including the Internet for range of situations, video and video-coding of behaviors, the anthropologist can produce a much deeper understanding of what actually occurs in the restaurant. It is no wonder that many consumer researchers are moving towards quantitative methods combined with qualitative methods. Today’s Internet technology makes it possible to acquire vast amounts of information, by automating the acquisition of behavior, and then the classification of the behavior by coding methods [10].
Delving into the mind through consumer psychology and Mind Genomics
Sociology and anthropology allow us to understand the situation in a restaurant, but do not let us delve deeply into the mind of the customer. Indeed, it is not the mind of the customer that is of interest, but rather the restaurant situation, in which the person and the person’s feelings and behaviors are simply a part. Sociology and anthropology stop at the deep understanding of the mind of the customer, leaving that to psychology, and especially consumer psychology.
Consumer psychologists want to know more from the patron and the server than can be obtained from sociological and anthropological study. Consumer psychologists want to know how patrons and servers think about situations, what they really look for, what they find wonderful, and just as important, what they find horrid. The tools used are primarily discussions with patrons and servers, whether in-depth discussions with one or two people, or group discussions with several individuals, led by a moderator who follows a ‘script’ to discuss a variety of topics. These discussions are called qualitative research, to distinguish them from researching using surveys, called quantitative research. The differences are not relevant for this paper. What is important, however, is that the discussions and the surveys invoke the ‘rational’ part of the individual’s brain. Whether the individual is describing her or his feelings or experiences, either to an interviewer or to a group, the individual is attempting to present a rational, coherent story. IN the same way, when the individual is participating in a survey, the individual typically tried to be coherent, so that the individual will feel that the answers are meaningful, and thus the individual is a worthy person for answering honestly. The information presented in a focus group or in a survey may or may not be accurate, because of many biases [11]. Nonetheless, these are the major ways used by consumer researchers to understand the topic.
With relatively few respondents in these expensive studies, the likelihood is high that we would rediscover a lot of what we know, and perhaps discover a few new nuggets. Our changes of discovery would rest upon the talent of the interviewer to elicit the information, and the ability of the interviewee to verbalize the situation, if that is possible. People are not necessarily articulate, especially in a situation where there is little emotional involvement. Eating in a diner or quick serve restaurant does not typically bring with it deep emotional involvement when one is the guest. When one is staff, such as wait- staff, the emotions may be far deeper, especially when connected with receiving a gratuity.
The emerging science of Mind Genomics represents an approach to understand the way people make decisions, especially about the situations of the everyday. Mind Genomics has been in development for the past 40 years, since 1980, but came into its own during the early part of the 21st Century [12-15].
The science of Mind Genomics can be traced to three major sources, psychophysics, statistical design, and consumer research. Psychophysics, the study of the relation between sensory perception and physical stimulus, is a branch of experimental psychology, which stresses the search for a metric of sensory experience. In turn, Mind Genomics searches for a metric of ideas. Statistical experimental design is a branch of statistics whose focus is the proper combination of independent variables (e.g., ideas), the evaluation by people of those combinations, and the estimation of the contribution of the individual ideas to the mixture. Experimental design is the key tool by which the researcher can set up the appropriate test stimuli, specifically combination of messages. Consumer research focuses on regularities of the everyday, the quotidian, the ordinary.
These three sources of Mind Genomics allow the us to explore the mind of the restaurant patron or the restaurant staff. Rather than observing the situation or conducting a survey, the researcher more directly selects a topic, creating four questions which are relevant to the topic, and then creating four answers to each question, viz., 16 answers. These 16 answers are combined into small, easy-to-read vignettes about a restaurant. An underlying system, the built-in experimental design, prescribes each vignette. The respondent rates each vignette on a scale. It is impossible to ‘game the system’ because the vignettes comprise 2-4 different answers or ‘elements,’ which paint a ‘picture’. Respondents find this task easy to do, viz., read a set of vignettes dealing with a topic relevant to a restaurant, and then rate the particular vignette on a defined scale.
The entire process from the point of view of the respondent lasts 3-5 minutes. Each respondent rates a totally unique set of 24 vignettes, allowing the study to proceed with virtually zero knowledge. The researcher need not select the ‘appropriate’ vignettes, which would imply some level of knowledge at the start of the study. The Mind Genomics process is so efficient that with 20-30 respondents, one can get a good idea of the mind(s) of the consumer, based upon the pattern of responses to many elements of the study. Furthermore, the experimental design works at the level of each individual respondent who participates, even though every respondent tested different combinations (vignettes.)
Over the past decade, the system for Mind Genomics has been templated, to allow rapid input of ideas, followed by rapid field work, and virtually instantaneous analysis. As a result, any topic where judgment is relevant can be studied in small, easy, affordable increments. One need not ‘be right’ at the start. The benefit to the researcher is the ability to understand the ‘mind’ of the respondent from the ‘inside out’. That is, the respondent need not have any conscious idea of WHAT she or he feels, or WHY. The reasons emerge from the pattern of responses to meaningful stimuli.
The Mind Genomics Template used in this set of three studies
The research template follows these steps, which can be accomplished in a matter of an hour or two, from start to finish (type in the elements to inspect the analyzed data).
- Select a topic
- Identify four aspects of the topic just chosen. The four aspects can be thought of as four ‘questions.
- For each aspect, provide four specifics. These are ‘answers or ‘elements, expressed in simple, single-minded phrases, in declarative format. The 16 elements provide the richness of description since they can be particularized to paint a word picture.
- Using experimental design (built into the Mind Genomics program, BimiLeap.com), create vignettes (combinations) comprising these elements (answers). The underlying experimental design specifies the precise set of 2-4 elements, ensuring that only one element from a question ever appears in a vignette.
- Each respondent evaluated 24 vignettes, with the vignettes being unique, viz., different from one respondent to another. Each set of 24 vignettes presents each element 5x, so that the element is present in five of the 24 vignettes, and absent from 19 of the vignettes.
- The underlying view behind this approach is modeled on the MRI, which takes many pictures of the same tissue, albeit from different vantage points, and combines the view into a 3-dimensional picture.
- This uniqueness is important .It means that each respondent evaluates a different set of descriptions, rather than having each respondent evaluate the same set of descriptions. One need not know the ‘correct’ set of elements ahead of time, with the empirical portion of the study measuring how well the limited, pre-selected combinations perform. The ‘underlying picture’ emerge, even though each measurement point is ‘noisy’ and possibly slightly wrong. The pattern will emerge, even from noisy data [16].
- We can estimate the models for the total panel, simply by putting all the data into the datafile, and running one regression equation, with the method being OLS, ordinary least-squares regression. The independent variables are the 16 elements, taking on the value 0 when absent from a vignette, and taking on the value 1 when present in the vignette. The 16 elements, A1-D4, constitute the independent variables.
- Each individual respondent evaluated a unique set of 24 vignettes. Thus, we can estimate the coefficients at the level of the individual respondent. For any set of data, we end up with a data set comprising sets of 24 rows of data, each set corresponding to a respondent.
- For Study #1 (5-point Likert scale, 1=Hate … 5=Love), we convert the ratings of 4 and 5 to 100, the ratings of 1,2 and 3 to 0. This created the binary variable TOP to which we added a very small random number, useful to prevent crashes of the regression program. We also converted the ratings of 1 and 2 to 100, and ratings 3,4 and 5 to 0, to create the variable BOT, again modified slightly by a small random number to prevent crashes of the regression program.
- For Studies #2 and #3 we converted the ratings to relative dollar value, and again added the very small random number.
- To prepare for clustering in each study, we calculated a regression equation for each respondent. We did not estimate an additive constant for the individual-level model estimated in all three studies.
- We then used k-means clustering separately in each study [17] to divide the group of respondents into two complementary groups for that study, these groups showing different patterns of coefficients. In each study, the respondents for that study were assigned to one of the groups, based upon the similarity of the pattern to the average of the group. These groups are ‘mind-sets’, groups of individuals who react similarly to the information about the restaurant.
Study 1 – How the server would feel about the customer
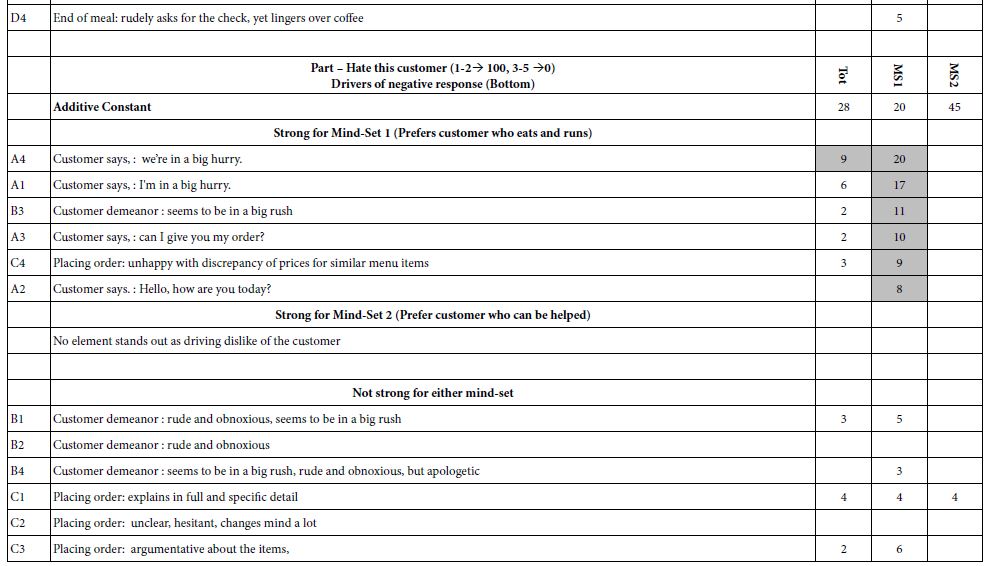
In study 1 the respondents evaluated 24 descriptions of the behavior of the customer. The respondents comprised 30 random respondents from the Luc.id list of respondents who had signed up to participate in these studies. The respondent rated each vignette on a 5-point scale. The ratings were transformed to Top (ratings 4-5 transformed to 100, ratings 1-3 transformed to 0), then transformed to Bot (ratings 1-2 transformed to 100, ratings 3-5 transformed to 0). Finally, individual-level models were created relating the presence/absence of elements to TOP (positive server reaction). The 30 sets of 16 coefficients each, but not the additive constant, were used in a k-means clustering to generate two different mind-sets. The standard distance metric for Mind Genomics was used to calculate distances between pairs of respondents. The distance is D = (1-Pearson R, calculated between two respondents, based on the 16 elements). Thus the clustering put together individuals with similar response patterns.
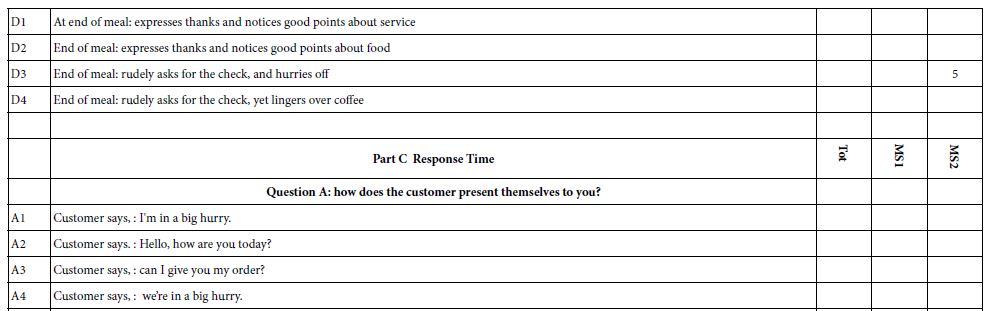
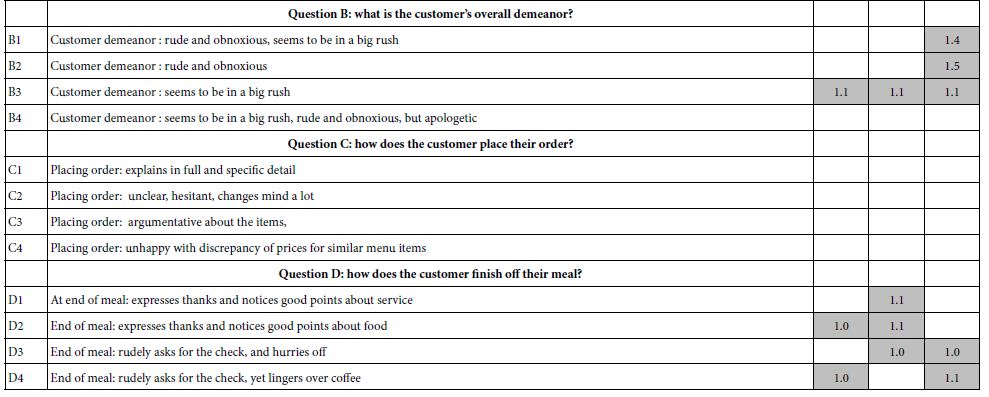
Table 1 shows the results, in three separate parts of the Table. PART A of 1 shows the additive constant and non-zero coefficients. These are elements which drive satisfaction with the customer (viz., a rating of 4-5 for the vignette.) PART B of Table 1 shows the additive constant and non-zero coefficients when we begin by looking at the elements which drive dissatisfaction’ (viz., a rating of 1-2 for the vignette). Finally, PART C of Table 1 shows the estimated response times for the different elements. The Mind Genomics program was able to deconstruct the response time (time between stimulus presentation on the screen and response) into the different response times ascribable to each element. In Parts A and B, only the positive coefficients are shown, in order to allow the patterns to emerge more clearly. In Part C, only the response times of 1.0 seconds or longer for an element are shown, again to allow the patterns to emerge more clearly.
When we look at the ratings of liking the customer (PART A), we begin with the additive constant. We interpret the additive constant to represent the degree of positivity of the server towards the guest, estimated as if there were no elements present in the vignette. Of course, by the underlying design, all vignettes comprised at least two elements, and at most four. Thus, the additive constant is an estimated parameter. The additive constant for liking the customer is about 50. In the absence of elements, the respondent feels that the server is likely to be positive towards the customer, but not very positive. Very positive feelings would be shown by additive constants around 70.
For the total panel, we see no elements strongly driving the server to ‘like’ the customer. That is, there are no strong performing elements (Part A). When we move to drivers of disliking the customer (PART B of Table 1), we see that the total panel less likely to begin with dislikes the customer (additive constant 28, versus additive 51 for liking the customer). The only element which drives disliking for the total panel is element A4: customer says, : we’re in a big hurry.
The division of the 30 respondents into the two mind-sets changes the picture entirely. Mind-set 1, comprising 12 of the 30 respondents, can be characterized as simply wishing as little interaction with the customer. Mind-set 2, comprising 18 of the 30 respondents can be characterized as wanting to help the customer. These patterns emerge from Table 1, Part A.
Table 1: Mind Genomics investigation of how the respondent feels about the customer as a function of their interaction.
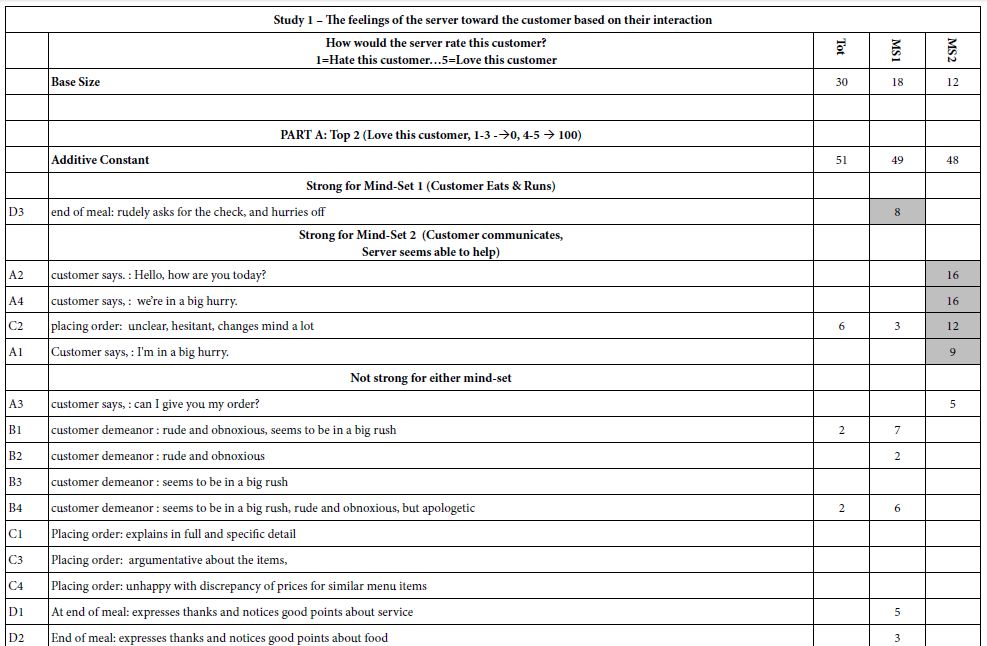
Positive drivers of liking – Mind-Set 1 (little interaction desired)
End of meal: rudely asks for the check, and hurries off
Negative drivers of liking – Mind-Set 1
Customer says, : we’re in a big hurry.
Customer says, : I’m in a big hurry.
Customer demeanor : seems to be in a big rush
Customer says, : can I give you my order?
Placing order: unhappy with discrepancy of prices for similar menu items
Customer says. : Hello, how are you today?
Positive drivers of liking – Mind-Set 2 (likes helping the customer)
Customer says. : Hello, how are you today?
Customer says, : we’re in a big hurry.
Placing order: unclear, hesitant, changes mind a lot
Customer says, : I’m in a big hurry.
Negative drivers of liking – Mind-Set 2
None
One of the unexplored areas of consumer research is the amount of attention paid to the different messages. Researchers can ask a respondent to guess how much attention the respondent pays to information. The answer may or may not make sense, but most certainly the respondent will try to give a sensible answer, not so much based on real attention or engagement time, but on a guess. The Mind Genomics program measures the total time of engagement with each screen, viz., each combination of messages, and then deconstructs the response time to the estimated number of seconds that can be attributed to each element. The model or equation used to fit the data is absent an additive constant, the rationale being that in the absence of elements, the response time should be 0.
With this introduction in mind, let us look at the coefficients in PART C of Table 1. We show only response times of 1.0 seconds or longer. These are the elements which ‘engage’ the respondent. Mind-Sets 1 and 2 spend the longest times looking at the description of the customer saying that she or he is in a big rush, and then reading the end of the meal.
The data from this first study suggests that asking the respondent to rate the emotional reaction of the server is likely to result in patterns which make sense or at least do not appear to be radically contradictory. We conclude from this first study that using emotion-based ratings unleashes f homo emotionalis, with the ratings telling a story, making sense, and dividing the two mind-sets from each other, at least in a basic way.
Homo economicus – letting the respondent judge in terms of money
The first study, summarized in Table 1, suggests that the respondent can vicariously estimate the feelings of the server in a diner type restaurant. The assignment of ratings to denote feelings appears to be straightforward, at least judged by the outcome that the data make sense, viz., ‘tell a story.’ We now change the dependent variable to money. Rather than having the respondent rate the expected feeling (hate to love), we instruct the respondent to read the vignette and estimate the relative amount of money to change hands during the transaction, from a low of 25% less than expected to a high of 25% more than expected. The scale is anchored at the bottom (1=25% lower) and at the top (9=25% higher).
The 9-point scale was divided into nine equal values, starting with 75 (corresponding to 25% lower), through 100 (corresponding to same), and 125 (corresponding to 25% higher). The respondent simply assigned a number. It was at the analysis stage that these nine numbers were assigned their corresponding percent values (75% of what is expected to 125% of what is expected).
The data for the two studies appear in Table 2 (Size of check vs described staff behavior and problem resolution), and Table 3 (Size of check vs described behavior with the customer). The coefficients for dollars are the expected percent of the check that can be ascribed to the element. The response time is the number of seconds estimated for reading and processing the element.
Study 2, expected size of the check as a function of described staff behavior and problem resolution, suggests two mind-sets (Table 2).
Table 2: Study 2 – Expected size of the check as a function of described staff behavior and problem resolution
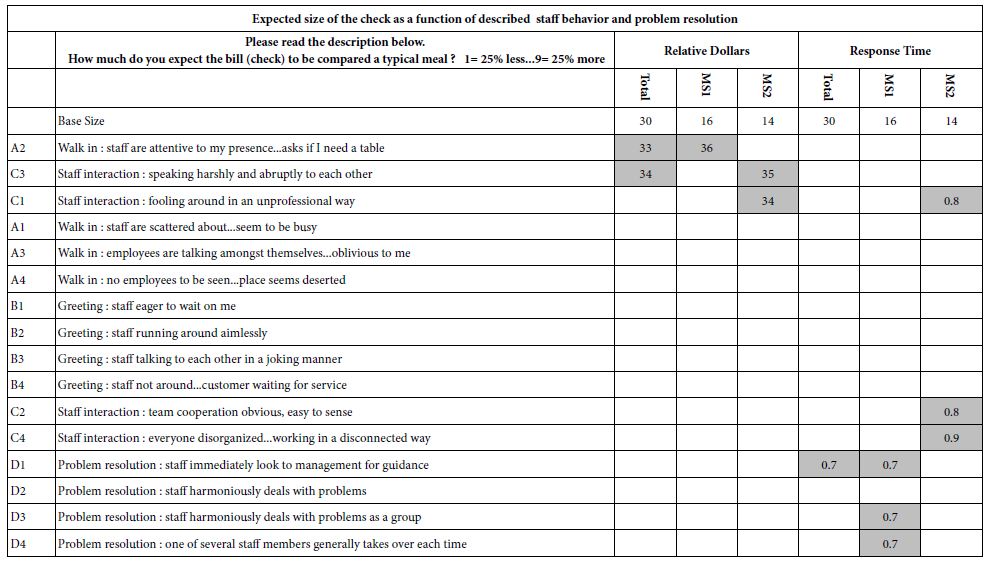
Mind-Set 1 expects to have a higher check for the meal when the staff is described as more attentive. Respondents read with more attention, and thus engagement, messages about problem resolution.
Mind-Set 2 expects to have a higher check for the meal when the staff is described as unprofessional, fighting with each other or kidding around with each other. Respondents read with more attention, and thus engagement, messages about the staff interaction with each other.
The elements which engage the respondents are staff interaction and problem resolution, neither group having any significant affect on the expected size of the check for the meal. These elements are almost stories about ‘human behavior’, interesting in and of themselves, as topics that people would discuss with each other.
Study 3, the expected size of the check as a function of described staff-customer interaction, also suggests two mind-sets (Table 3).
Table 3: Study 3 – Expected size of the check as a function of described staff-customer interaction
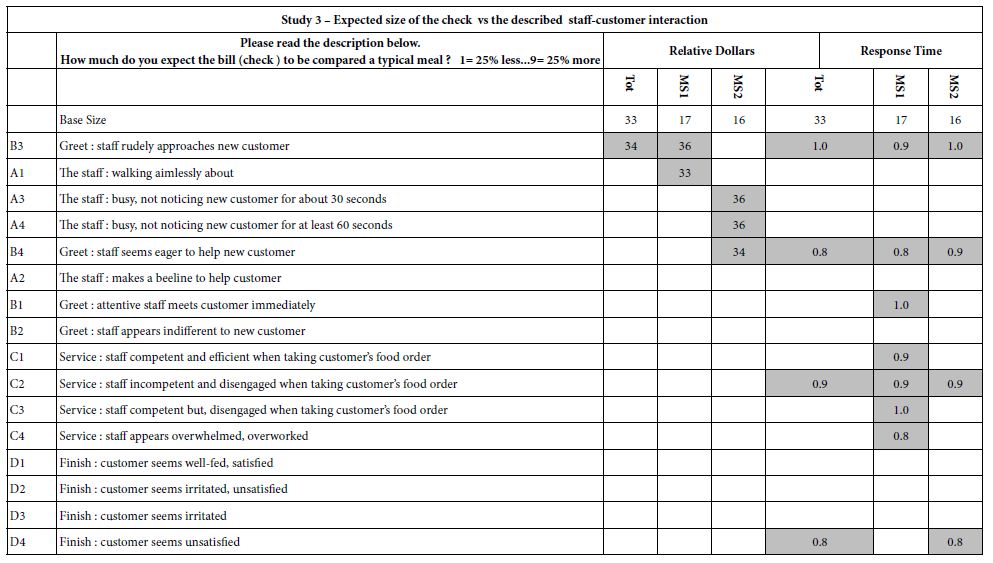
Mind-Set 1 expects a higher check for the meal when the wait staff is indifferent, walking around. Mind-Set 1 is engaged by messages talking about the competence of the wait staff, in terms of taking order.
Mind-Set 2 expected a higher check for the meal when the wait staff is a measured number of second late, noticing the waiting customer. There is no clear pattern to the elements which engage Mind-Set 2.
Discussion
Our goal in this paper is to apply a newly emerging branch of psychological science, Mind Genomics, to the mundane, virtually every-day topic of the quick serve restaurant or diner. The objective is to move beyond the surface research, the efforts of sociology and anthropology, and beyond business practices and issues as dealt with by the HR department, human resources. The objective is to dig deeply into the mind of the customer, faced with different situations in a restaurant, and understand attitudes towards those situations, using Mind Genomics as the structure for investigation, and using first emotional attributes as the rating scale (Study 1), and then ‘financial outcomes’ (e.g. estimated check price) as the rating scale (Studies 2-3). To our knowledge, this paper is among the early papers to probe the mind of the respondent using monetary scales rather than emotional scales (viz., rating using the mind as homo economicus versus the mind more ordinarily used in the form of homo emotionalis).
During the four-decades experience developing Mind Genomics, a number of studies were executed wherein the elements, the messages, were either features of the product, or numerical aspects, such as weight of the product. The ratings used were evaluative, such as interest or value for the money, both emotional. In the different studies, once the part-worths of the elements were estimated by OLS regression, as in Study 1, it was straightforward to plot the coefficient for the element (e.g., part-worth estimate for value for the money) versus the element, where the element presented a numerical attribute. In almost all cases the coefficients for judgment emerging from the ratings show high correlation with the numerical information about the product, e.g., the weight. These results suggest the usefulness of Mind Genomics to quantify the perceived value of an aspect of the product [12-15, 18].
The issue now emerges regarding the success of Mind Genomics in the use of numbers to measure emotions generated by the description of situations (Study 1), but the seeming failure of the use of numbers described as money to measure emotions generate by the description of situations (Study 2 and Study 3, respectively). We know from everyday experience that we can estimate the ‘fair value,’ but it is generally the ‘fair value’ of something tangible, whether that be a physical object or an experience such as the value of a recording of an opera or the value of a ticket to the opera. What then is the difference? It may be that we have not yet found the appropriate way to measure the ‘dollar value’ of emotions tied to the description of an experience. That is, it is not a question of the utility of the experience, but simply that the effort may be difficult, and even perhaps impossible to use dollar value scaling to describe an experience without a tangible outcome of utilitarian nature.
Conclusion
The results from these three studies suggest that Mind Genomics will find more success using measures of good/bad than measures of money as the dependent variable. Money (viz., the price of an item or a service) may well be a strong performing element, driving feelings of like/dislike, or good/bad. Money as a response, viz., the use of money as a rating scale may well work when the stimulus messages are about items, but it does not appear from this study that money as a rating scale can be used easily to rate situations or behaviors, at least not in foodservice.
At a deeper level, the notion that it is difficult for respondents to rate the expected size of a check based upon description of staff behavior calls up the need to think about the ‘meaning’ of assigning monetary damages to situations where the damages cannot easily be quantified, viz., damage to the psyche human being. That corollary to this study deserves its own set of studies, viz., homo economicus and the law.
References
- Butler S, Skipper Jr JK (1981) Working for tips: An examination of trust and reciprocity in a secondary relationship of the restaurant organization. Sociological Quarterly2: 15-27.
- Haghighi M, Dorosti A, Rahnama A, Hoseinpour A (2012) Evaluation of factors affecting customer loyalty in the restaurant industry. African Journal of Business Management6: 5039-5046.
- Heung VC, Gu T (2012) Influence of restaurant atmospherics on patron satisfaction and behavioral intentions. International Journal of Hospitality Management31: 1167-1177.
- Madanoglu M (2006) Validating restaurant service quality dimensions. Journal of Foodservice Business Research7: 127-147.
- Ryu K, Han H (2011) New or repeat customers: How does physical environment influence their restaurant experience? International Journal of Hospitality Management30: 599-611.
- Mariampolski H (2006) Ethnography for Marketers: A guide to Consumer Immersion. Sage.
- Gueguen N, De Gail MA (2003) The effect of smiling on helping behavior: Smiling and good Samaritan behavior. Communication Reports16: 133-140.
- Gueguen N, Jacob C (2014) Clothing color and tipping: Gentlemen patrons give more tips to waitresses with red clothes. Journal of Hospitality & Tourism Research38: 275-280.
- Leodoro G, Lynn M (2007) The effect of server posture on the tips of whites and blacks. Journal of Applied Social Psychology37: 201-209.
- Porretta S (2021) The Changed Paradigm of Consumer Science: From focus group to Mind Genomics. In Consumer-based New Product Development for the Food Industry. Royal Society of Chemistry 21-39.
- Downey B (2015) The looking glass self and deliberation bias in qualitative interviews. Sociological Spectrum35: 534-551.
- Moskowitz D, Moskowitz H (2012) Conjoint analysis plus (cross category, emotions, pricing and beyond). Product Innovation Toolbox: A Field Guide to Consumer Understanding and Research 192-223.
- Moskowitz HR, Silcher M (2006) The applications of conjoint analysis and their possible uses in Sensometrics. Food Quality and Preference17: 145-165.
- Moskowitz HR, Gofman A, Beckley J, Ashman H (2006) Founding a new science: Mind genomics. Journal of Sensory Studies21: 266-307.
- Moskowitz MR, Ashman H, Minkus-McKenna D, Rabino S, Beckley JH (2006) Databasing the shopper’s mind: Approaches to a ‘mind genomics’. Journal of Database Marketing & Customer Strategy Management13: 144-155.
- Gofman A, Moskowitz H (2010) Isomorphic permuted experimental designs and their application in conjoint analysis. Journal of Sensory Studies25: 127-145.
- Likas A, Vlassis N, Verbeek JJ (2003) The global k-means clustering algorithm. Pattern Recognition36: 451-461.
- Moskowitz HR (2012) ‘Mind genomics’: The experimental, inductive science of the ordinary, and its application to aspects of food and feeding. Physiology & behavior107: 606-613. [crossref]