Abstract
Respondents in Hong Kong evaluated sets of 24 unique vignettes about the Hong Kong Goldfish Market, rating each vignette on ME (agree) or NOT ME (disagree). The vignettes were created by systematically combining elements (messages) from four different categories, into small combinations comprising 2-4 elements each. The experimental design prevented the respondent from ‘gaming’, viz., giving the appropriate answers because the vignette comprises different messages. The deconstruction of the responses by regression showed the contribution of every element to three dependent variables; agree, disagree, and response time (engagement) revealed different types of decision rules for agree versus disagree. Two mind-sets emerged, based on the pattern of responses to the 16 elements; those interested in low price, and the afficionados. The study showed that the engagement times, viz., response times to individual elements were far longer for Mind-Set 2 (afficionados). The study shows the power of simple experiments to create a database of people’s perceptions of the every-day experiences, a ‘Wiki of Daily Life’.
Introduction
An exploration of the world of experimental psychology, social psychology, sociology, and anthropology reveal an ongoing interest in the world of the everyday specially by researchers in sociology and anthropology, as well as social psychology. There is some experimentation by social psychologists and experimental psychologists, generally of a limited nature, often to understand a general principle, and usually with situations that are unusual. The crossing of experimentation with the world of the ordinary is not particularly common, because experimentation looks for general principles of behavior.
During the past two decades, the world of experimentation in psychology has come to embrace new areas, not perhaps in a formal matter, but at least accepting research which shows the everyday. The research may not appear in highly rated journals because of the quotidian nature of the topic, but nonetheless the research plays an important role in our understand of the lives of contemporary people. Some of the work may be found in the topics covered by behavioral economics, other part of the effort may appear in topics covered by consumer research.
Recently, author Moskowitz has suggested that a new discipline of experimental psychology be developed, one called Mind Genomics [1] Moskowitz et. al., 2007). The effort is to understand the drivers of decision about the quotidian topics of everyday life, not so much to develop grand schemes of behavior, but rather simply to catalog the myriad different aspects of daily behavior. The effort looks at the world of the granular, from the bottom up, from the specific, limited topics which make up the warp and woof of our daily behavior, topics which would not ordinarily be thought to be the appropriate topics of psychology. The topics might be those of interest to an anthropologist who describes these topics in a discussion of behavior, but issue to explore the topic in depth, to understand the facets of a topic, and the different ways to look at the topic.
Early efforts to study daily behavior focused on things, primarily things one might eat or drink. The objective was to understand the different patterns of preferences regarding food. The underlying reason for choosing food was that studies of preferences for food and studies of eating in restaurants and dining halls were well known, well accepted by the world of scientists [2]. The effort soon expanded to other situations, usually products (e.g., financial industry; [3], but eventually moved into experience itself. As far back as 1957, for example, sociologist William Foote Whyte was recording the sociology of the everyday, producing such classics as the Organization Man [4]. The effort continues, with such evaluation of landmark groups, such as the Baby Boomers [5].
Science need not be focused on the traditional topic, such as foods, topics with a long intellectual and academic history. Anyone with a sensitivity to social issues is typically interested both in general patterns and in specific stories. The general patterns are usually reported in good scientific fashion, with appropriate statistics, general conclusions, and foundational knowledge. The stories are often more interesting, sketchy but real world, and used to make the general science more interesting. The science of Mind Genomics, used here to evaluate a common pet market, the Hong Kong (HK) Goldfish Market, provides a way to introduce rigor into the study of what otherwise might simply an interesting vignette, introduced as part of a deeper presentation of a culture, a society, or a hobby. The HK Goldfish Market has been the topic of studies, primarily of a sociological/business nature [6,7] There does not seem to be a deep understanding of the response of individuals to the both the market itself, and to their spending patterns, perhaps because of the localized nature of the topic, and the fact that the ‘mind’ of the individual regarding the HK Goldfish Market is simply not sufficiently important in the world of science.
Despite its minor position as a topic of study, the HK Goldfish Market is an important market. According to the Wikipedia article ‘History of Goldfish Market, Hong Kong, 2012’:
Hong Kong is one of the leading exporters of Goldfish and other tropical fish for aquarists and fish keepers around the world. In Tung Choi Street Goldish shops have congregated for many years…Originally the interest in fish, particularly goldfish, in Hong Kong was related to the needs of Fung Shui, the ancient Chinese system to bring harmony to a house. Under this system Goldfish are particularly important so therefore there has always been a demand for goldfish in Hong Kong more than typical in other countries… During the 1970s and 1980s the keeping of goldfish alongside other types of tropical fish such as butterfly fish became a very suitable hobby for the majority of Hong Kong’s population who lived in flats in high rise apartments. Without the space to keep pet cats or dogs the keeping of tropical fish, both freshwater and less commonly sea fish, became very popular. (Source: Wikipedia, 2020)
The Mind Genomics Approach to Understanding the HK Goldfish Market
Mind Genomics is an emerging science, philosophically descended from experimental psychology, with an admixture of sociology, anthropology, consumer research, and statistics. The notion is that one should be able to create a ‘wiki of the mind’, a searchable database of how people think and make decisions in their daily lives. These decisions are made with respect to the ordinary events of lives, the daily flotsam and jetsam which constitutes the everyday, the banal activities. As noted above, seminal works emerge from the observation of everyday behaviors, such as eating, using financial services, going to work, and so forth. Those are the inspirations. What Mind Genomics provides is a rapid, focused, experimentation-inspired approach to fill in the gaps, to under the features driving a person’s decision. One might think of Mind Genomics as the experimental science of the everyday, or the mechanism by which to create a ‘Wikipedia of Everyday Life.’
The topic is a cartography or limited exploration of a topic, here the perception of the Hong Kong Goldfish Market as responded by people in Hong Kong. The issue to understand their behavior towards the Goldfish market in terms of spending, and what they would like to see in the market. The ingoing vision was to treat the topic as a combination of anthropology (individual behavior), sociology (dealing with a well known establishment), psychology (how does the respondent think about the topics, what topics or messages engage), and economics (what does the person spend, and how does that interact with features of the market.)
It is important to note that Mind Genomics can be scaled to cover many different aspects of society, from the combined points of view of anthropology, sociology, psychology, and economics. The studies are small (base sizes of 20-30 respondents suffice for a basic understanding), are quick to set up (30 minutes), quick to execute in the field with a panel provider (approximately 60 minutes), and with data that are clear and easy to understand, returned to the researcher in both a PowerPoint® report ready to share, as well as a database in Excel® read for further analysis. As such, the approach of Mind Genomics presented here for the Hong Kong Goldfish Market is a template for many such studies, creating in its wake that ‘wiki of the mind’, or more correctly a ‘wiki of the mind and society’ so relevant to record and understand daily life in an era.
Mind Genomics follows a series of simple steps, with the steps ‘templated’ on the computer interface (www.bimileap.com). Mind Genomics forces the researcher to think of a topic in terms of totality, then break the topic down to four questions which tell a story, and then provide four answers to each question. The rationale is that the sequence forces the researcher to think about the problem in an analytical fashion, rather than in a holistic fashion. The result of the Mind Genomic will be the importance of each of the answers to driving a response. Rather than generating a single answer, Mind Genomics will generate the ‘underlying plans’ of the topic, allowing the person to understand the topic in depth, and to reconstruct the topic in new ways. The Mind Genomics interface has been simplified to follow an easy-to- use template, with the suggest type of answer shown as a suggestion, easily overwritten by the researcher who ‘gets the general idea of what is needed at that step’ from the suggestion. By the end of 2-3 ‘tries,’ viz., set-ups of different topics, the research is proficient, the researcher’s mind forever ‘rewired’ to think in a structure yet creative manner. The explanation for the 2-3 tries is that in every skill there is a learning period. It is difficult to create a computer program forcing a person to exercise ‘creative and critical thinking’, and have a person perform excellently the first time the person uses the program.
Step 1 – Define the Topic
Step 1 is easy, because it requires the researcher to pick a topic of interest, without doing any ‘disciplined thinking.’ The topic here is the above-mentioned HK Goldfish Market, a topic that can be addressed by young researchers and older researchers alike. The fact that the topic is easy approachable, and NOT fear-inducing, allows students to realize that science and research can be fun, and be ‘theirs.’ Students can work with Mind Genomics to explore virtually any topic of interest to them, make discoveries, and ‘own’ knowledge and creative thought, rather than simply hearing about the joy and knowing, thinking, and creating.
Step 2 – Create Four Questions which Tell a Story
It is at this juncture that the researcher is challenged to think in both a critical way and in a creative way. The questions must pertain to the topic (Hong Kong Goldfish Market) but must tell a story which is connected. Experience with this stage suggests that it is at Step 2 that most beginners become frustrated because they never have been required to think in this deconstructive, analytic fashion, breaking down a topic into components. They may have been exposed to topics with components but have never had to exert themselves to define a topic in terms of components. It is at Step 2 when people feel challenged, overwhelmed, and want to drop the topic because they are out of their ‘comfort zone.’ Those who continue, those who do two or three set ups of different studies, report that they ‘overcome’ this block, and feel that the demands of Step 2 force them to learn how to think in a different way, a more structured way, a way that makes them feel proud.
Step 3 – For Each Question, Instruct the Researcher to Provide Four Answers, Preferably Phrases
As Table 1 shows, the phrases for beginners tend to be short, and not descriptive. With practice, however, the researcher feels liberated, and grows more creative. Figure 1 shows the questions and the answers for one question. Table 1 shows the four questions and the four answers. It is important to emphasize that Mind Genomics studies are easy and quick to set-up, inexpensive to run. These simple studies, really scientific experiments, lend themselves to iterations. The life lesson is that nothing is permanent, and that experience can be shown to build ultimate success. In terms of Mind Genomics, one can repeat the study several times, several iterations, at each iteration keeping elements or ideas which just showed themselves to ‘work’, viz., perform well or in interesting ways, and in turn discarding and replacing elements which perform poorly, or which do not teach anything. The elements, phrases in Table 1, represent a first effort to explore the HK Goldfish Market using Mind Genomics. It is important to note that no Mind Genomics experiment is ever ‘too early’ or ‘too late’ in the process of developing an understanding of a topic. The iterative nature of Mind Genomics encourages exploration to the depth of understanding one wishes to achieve.
Table 1: The four questions and four answers to each question (elements).
| Question A:What are youNow spending at the HK Goldfish market? | |
| A1 | Spend money at HK Goldfish Market:Spend about the same as 5 years ago |
| A2 | Spend money at HK Goldfish Market:Spend more than 5 years ago |
| A3 | Spend money at HK Goldfish Market:Spend less than 5 years ago |
| A4 | Spend money at HK Goldfish Market:Never spent money there |
| Question B: How much do you typically spend at the HK Goldfish market | |
| B1 | Annual Spend at HK Goldfish Market: Less than 1,000 HKD at the shops |
| B2 | Annual Spend at HK Goldfish Market: 1,000 HKD – 2,500 HKD at the shops |
| B3 | Annual Spend at HK Goldfish Market: 2,500 HKD – 5,000 HKD at the shops |
| B4 | Annual Spend at HK Goldfish Market: More than 5,000 HKD |
| Question C: What would you like to see in the HK Goldfish Market? | |
| C1 | My wish for the HK Goldfish Market: Larger variety of animals |
| C2 | My wish for the HK Goldfish Market: More exclusive/rare fish |
| C3 | My wish for the HK Goldfish Market:Teachvarious aspects of aquarium … aqua-scaping, maintenance, specialty fish etc. |
| C4 | My wish for the HK Goldfish Market: ready-made aquariums and/or aquarium maintenance. |
| Question D: What is specialabout the HK Goldfish Market? | |
| D1 | The HK Goldfish Market: Offer better advice |
| D2 | The HK Goldfish Market:Big variety of shops |
| D3 | The HK Goldfish Market: Fun to shop |
| D4 | The HK Goldfish Market: Find exclusive/specialty fish |
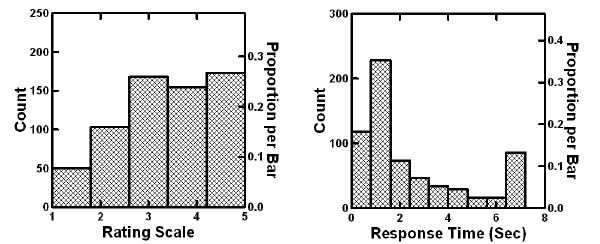
Figure 1: Distribution of responses (left panel) and response times (right panel).
Step 4 – Combine the Answers into Vignettes according to an Experimental Design
Mind Genomics differs from the typical way one would study the HK Goldfish Market. The conventional practice is that the researcher would identify aspects about a topic, create questions pertaining to each aspect, and instruct the respondent to answer the battery of questions, one question at a time. The pattern of answers gives a sense of how the respondent feels about the topic. This approach, known as ‘isolate and study’ may work for most topics, but when it comes to study aspects of daily life it is impossible to prevent a respondent from changing the criteria of judgment. An example comes from two of the questions in Table 1 (Question A, Question B) deal with price. Two of the Questions in Table 2 (A,B) deal with spending, and two deal with features (C,D). It is hard to use the same criterion to judge these two types of questions.
Table 2: examples of three vignettes created by experimental design, and the binary coding of the vignette and the data to prepare for statistical analysis.
|
Vig#1 |
Vig#2 | Vig#3 |
Vig#4 |
|
| The actual vignette in the way the respondent sees but…but wider, so no element takes up more than two lines on the screen. The letters and the numbers (viz., A, or A1) are never seen by the respondent | ||||
|
A |
Spend money at HK Goldfish Market:Spend less than 5 years ago | Spend money at HK Goldfish Market:Never spent money there | Spend money at HK Goldfish Market:Never spent money there |
Spend money at HK Goldfish Market:Spend more than 5 years ago |
|
B |
Annual Spend at HK Goldfish Market: 1,000 HKD – 2,500 HKD at the shops | Annual Spend at HK Goldfish Market: 2,500 HKD – 5,000 HKD at the shops | Annual Spend at HK Goldfish Market: Less than 1,000 HKD at the shops |
Annual Spend at HK Goldfish Market: Less than 1,000 HKD at the shops |
|
C |
Absent from the vignette | My wish for the HK Goldfish Market: ready-made aquariums and/or aquarium maintenance. | Absent from vignette |
My wish for the HK Goldfish Market:Teachvarious aspects of aquarium … aqua-scaping, maintenance, specialty fish etc. |
|
D |
The HK Goldfish Market: Fun to shop | The HK Goldfish Market: Fun to shop | The HK Goldfish Market: Find exclusive/specialty fish |
Absent from the vignette |
| Dummy variable coding (0,1) to prepare the data for OLS (ordinary least-squares) regression | ||||
|
A1 |
0 | 0 | 0 |
0 |
|
A2 |
0 | 0 | 0 |
1 |
|
A3 |
1 | 0 | 0 |
0 |
|
A4 |
0 | 1 | 1 |
0 |
|
B1 |
0 | 0 | 1 |
1 |
|
B2 |
1 | 0 | 0 | 0 |
| B3 | 0 | 1 | 0 |
0 |
|
B4 |
0 | 0 | 0 | 0 |
| C1 | 0 | 0 | 0 |
0 |
|
C2 |
0 | 0 | 0 | 0 |
| C3 | 0 | 0 | 0 |
1 |
|
C4 |
0 | 1 | 0 | 0 |
| D1 | 0 | 0 | 0 |
0 |
|
D2 |
0 | 0 | 0 | 0 |
| D3 | 1 | 1 | 0 |
0 |
|
D4 |
0 | 0 | 1 |
0 |
| Response acquired by the program | ||||
|
Rating |
5 | 4 | 2 | 5 |
| RT Sec | 2.0 | 0.9 | 1.0 |
0.6 |
| Binary transformed rating including the small random number added for prophylactic reasons | ||||
|
Top2 ME |
100.0002 | 100.0001 | 0.0002 | 100.0003 |
| Bot2 NOT ME | 0.0002 | 0.0003 | 100.0001 |
0.0009 |
The experimental design mixes the different answers into vignettes, combinations, comprising both statements about spending and pricing (Questions 1,2), and statements about features (Questions 3,4). Table 2 shows an example of the vignettes and the underlying experimental design. A respondent shown this combination maintains a single focus, a single criterion, when judging the entire vignette. The analysis turns out to be much simpler, much more direct, as we see below.
The texts on experimental designs provide different recommended designs. The specific design used for Mind Genomics is a so-called main-effects design, permuted into 500 different designs having the same structure, but featuring different combinations of the 16 elements. The benefit of the permuted design is that is covers a great deal of the design space, the possible combinations, a strategy to discover underlying patterns [8].
The actual experimental design comprises four independent variables (the four questions), and four ‘options’ or ‘levels’ of each independent variable (viz., the four answers or elements). There are 16 elements in total. Each respondent evaluates a unique set of 24 vignette created according to a main-effects design, in which the 16 elements are each presented five times, in 24 vignettes, and absent 19 times from the 24 vignettes. The design ensures that a vignette comprises 2-4 elements, at most one element from each question. The design further ensures that the 16 answers or elements will be presented in a way that makes them statistically independent of each other. The property of statistical independence is important when one wants to deduce the contribution of each of the 16 elements to the overall rating, using the method of OLS (ordinary least-squares) regression. Ensuring that the 16 elements are independent of each other at the start makes the analysis quite straightforward, virtually automatic, with the results ‘figuratively’ jumping out at the researcher.
In many scientific studies the objective is to obtain data which has as little extraneous variation as possible, so-called error variability. To the degree that the researcher can reduce the error variability, the patterns underneath will emerge more clearly. The standard way to do this error reduction is to either suppress the noise by careful testing (impossible to do with people), or to average out the variability by testing the same set of vignettes with hundreds of people, so that the random variation cancels out. The Mind Genomics worldview goes contrary to the traditional approaches. Mind Genomics is metaphorically an ‘MRI of the mind.’ The patterns of responses generated from the different respondents (here 30 different responses) give information from different perspectives to the same topic. The information can be combined by computer to generate a much more robust, comprehensive, multi-aspect view of the problem. The patterns emerging from the Mind Genomics effort literally ‘jump out’ as we will see below.
Step 5 – Create an Orientation Paragraph
The paragraph introduces the topic and provides the respondent with the scale. The best practices for orientation paragraphs depend upon the specific use. For most situations, the less one says the better. The rationale for ‘saying little’ is that the key information should come from the elements. The paragraph below presents the orientation:
Everyone these days is talking about the HK Goldfish Market. We would like you to have fun with us. We are doing a study on what people REALLY think about the HK Goldfish Market. Please read the whole screen below, and rate the combination… There is no right or wrong. JUST YOUR OPINION, no one else. Don’t think too long…just look, read, rate!
How do YOU feel about this set of statements TOGETHER>?
1=1 = Doesn’t agree at all with MY opinion of the HK Goldfish Market …
5=5 = Perfectly agrees with MY opinion of the HK Goldfish Market
Step 6 – Run the Study
The study can be run among friends, or through a panel service. This study here was run with a panel service, with respondents from Hong Kong, familiar with the HK Goldfish Market. The respondents who agree to participate open the link, read the introduction, complete a short introductory survey (classification) about age gender, and frequency of visiting the HK Goldfish Market. The respondent then rates the 24 different vignettes created for the respondent, doing so in about three to four minutes. The computer records the rating and measures the time between the appearance of the vignette on the computer screen and the respondent’s rating. The actual interview, the experiment, required about three minutes of the respondent’s time.
Results
Mind Genomics data provide a rich bed of test stimuli. Each respondent evaluated 24 different vignettes. The 30 respondents generated 720 different combinations of elements, answers to the question, with, each combination designed to be different from all the others. An initial analysis revealed that three respondents assigned virtually the same rating to all 24 vignettes that were presented to them. The data from these three respondents were eliminated, leaving 27 respondents, sufficient for a quite rich analysis, as will be see below.
Step 7: Transform the Rating Data to Two Binary Scales, the Agreement Scale, and the Disagreement Scale, Respectively
Over the past decades, researchers have come to rely on two types of scales. The first is a graded scale, called a Likert scale, or category scale. The notion is that the scale comprises a set of discrete points. The respondent is required to rate the test stimulus assigning a rating point. The presumption is that the scale points are equally spaced in terms of psychological distances, and thus averaging and statistics are acceptable. The 5-point scale is an example. Consumer researchers recognize that these scale points are neither equally spaced, nor in fact can be readily interpreted by anyone. Users of the scale always ask, for example, “what does Rating X (e.g., 5) mean on the 5-point scale?” In the absence of extensive studies of the scale, it is easier to divide the category or Likert scale into ranges calling one part 0 and the other part 100. The division may not be truly equal, but managers understand the notion of two scale points. For this study, the analysis divided the scale in two ways, both generating a two-point scale easy to understand:
Describes Me scale. Ratings 1-3 transformed to 0 (does not describe me), ratings 4-5 transformed to 100 (does describe me). A small random number is added to every transformed scale value in order to ensure that the data will never generate a situation where all of the transformed ratings are either 0 or 100. There must be some variation in the scale data for the subsequent regression analyses to work.
Does NOT Describe Me Scale. Ratings 1-2 transformed to 100 (do not agree; does not describe me), ratings 3—5 transformed to 100 (agree; does NOT not describe me)
Step 8: External Analyses – Looking at the Patterns of the Data, but Not at individual Elements
As a note about the practice of science, it is always a good practice to plot one’s data, whether the study comprises a few hundred data points, such as this study on the HK Goldfish Market, or the study comprises hundreds of thousands, or even millions of data points. The first step should be to familiarize oneself with the data, to explore the data, to become familiar with it, to find general patterns. Only then, after familiarization, does it make good research sense to start testing for differences, to make substantive conclusions about patterns and so forth.
The first external analysis plots out the distribution of responses, as shown in Figure 1. The left panel shows the distribution of ratings on the 5-point Likert scale. The right panel shows the distribution of responses times. Figure 1 suggests that there are more agreements (describes me, ratings 4-5) and far fewer disagreements (does not describe me, ratings 1-2). Figure 1 further suggests that the responses evaluate the vignettes quite quickly, most taking about 2 seconds or less to rate a vignette. The large number of ratings at 7 seconds correspond to those vignettes which took longer than 7 seconds. The assumption was that these vignettes represent situations during which the respondent was not paying attention to the task.
The summary data shown in Figure 1 tells us just a little about the different aspects of the HK Goldfish Market. We understand that the phrases generate agreement, and that the information is easy and quickly processed. As of yet, we do not know the ‘internal’ aspects of the data, specifically the ‘mind’ of the respondent who is assigning the rating. We can see from ‘outside’, but we do not necessary get a sense of what is going on ‘inside.’ To get a sense of what is going on in the respondent’s mind requires us to understand how the specific elements in the vignette ‘drive’ the ratings. The learning emerging from linking elements to responses which give us a sense of how the respondent is thinking (rating), and what is engaging the respondent’s attention (response time). The former, ratings, is under the control of the respondent’s conscious mind. The latter, response time, is not under control of the respondent’s conscious mind, but rather an uncontrolled behavior reflecting attention to, and engagement with, the task.
Continuing our ‘external analysis’, we can learn more from the data, specifically the average responses. We create four new averages, one for each respondent, based upon the 24 vignettes rated by the respondent. Although each respondent evaluated different 24 unique vignettes, we can get a sense of the general response to the topic. The four new averages are, respectively, the ratings (1-5), the response times (after truncation to move all responses times to a maximum of 7 seconds), average Top2 (Describes ME, viz., agree), and average Bot2 (Does not describe ME, viz., disagree). We will find deeper insights when we plot these averages by respondent.
One of the first questions emerging from the introduction of Top2 and Bot2 is the degree to which these averages parallel the averages that would have been obtained by working with the original 5-point Likert scale. That is, when we average responses for the binary scales, do we see the same pattern as we would see when we average the ratings themselves? Or does the binary transformation lose so much granular information that the transformation creates new problems of ‘meaning’, despite the easier interpretation is easier! Figure 2 shows us the plot from the 27 respondents. Each circle corresponds to one of the 27 respondents. We would make the same decision based upon the patterns of all three plots. The only difference is that the binary transforms of ME (Top2) and Not ME (Bot2) are less clear because we exclude all ratings of ‘3’ from both. Yet can be fair confident that our qualitative conclusions will be the same when we use the 5-Ponit Likert Scale or the Binary Transformed Scale. The binary scale will be easier to interpret, however.
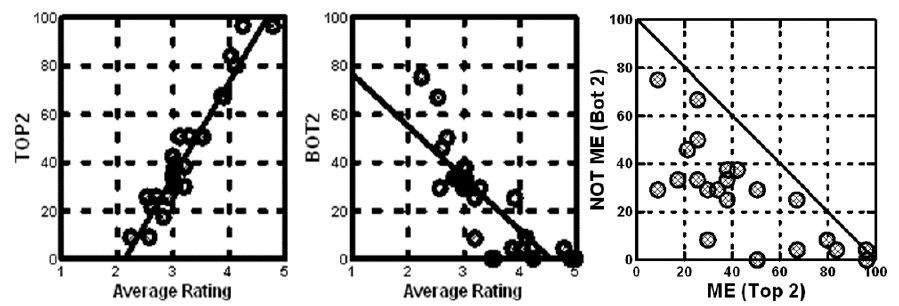
Figure 2: Average ratings for 24 vignettes for each of 27 respondents. Each circle is a respondent. The patterns are similar for Likert Rating Scale vs Binary Scale, noisier for the two binary scales.
The second external analysis searches for relations between response time and either the actual ratings on the original 1-5 scale, or the binary transformed scale. Figure 3 shows a noisy but discernible relation between the average response time from the respondents and the average transformed rating assigned by the respondent. It should be kept in mind that these results come from averaging response times and ratings from a unique set of 24 vignettes for each respondent.
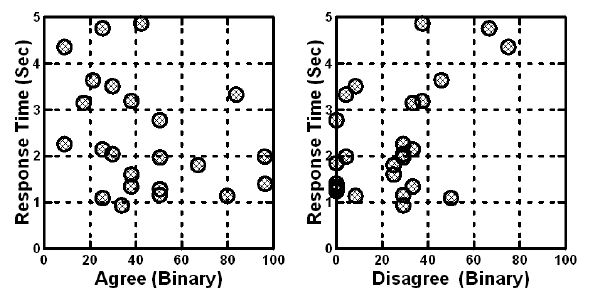
Figure 3: Relation between average binary scale (Top2 – Agree, ME; Bot2 – Disagree, NOT ME) and response time. Each point corresponds to the average of one respondent’s rating of 24 vignettes.
On average, respondents who showed the highest average agreement showed the shortest response times.
On average respondents who showed the highest average disagreement showed the longest response times.
Step 9: Internal Analysis Relating Each Element to the Binary Transformed Rating’s
Had the data been simply combinations of elements without cognitive ‘meaning’ the analysis would have stopped at the external analysis, simply because there is nothing to be learned from the properties of a specific stimulus. The stimulus would just be part of the set of stimuli picked for the analysis to discern a general pattern.
Mind Genomics moves beyond the external, simply because the elements themselves have cognitive richness, meaning in what they communicate, meaning in their sentence structure, meaning in the words, and so forth. The richness need not be explicated at the start of the Mind Genomics study. It suffices only that the elements be chosen for a reason germane to the topic. In this study, there are two questions pertaining to pattern of spending and amount of spending, and two questions about attitude, specifically what one wants in the market, and how one feels shopping in the market. These questions are never asked directly, but rather represent by cognitively rich statements to which the respondent reacts by assigning a rating, doing the assignment rapidly in what Nobel Laureate Daniel Kahneman called System 1 behavior [9].
The experimental design enables the research to create equations relating the presence/absence of the 16 elements to the four dependent variables, whether these be the actual ratings on the 5-point Likert scale, the binary transformed ratings for Agree (Describes ME, Top2), the binary transformed ratings for Disagree (Does NOT Describe Me, Bot2), or response time.
The first analysis using OLS (ordinary least-squares) regression creates equations for each individual, with the binary transformed rating of Agree (Top2) as the dependent variable. The rationale for the individual-level modeling is that the 27 different models will generate the data needed to divide the respondents into two complementary groups, mind-sets, based upon what specific elements they feel describes them.
The general form of the equation is: Top2 = k0 + k1(A1) + k2(A2) + k3(A3)…k16(D4)
The foregoing equation can be estimated at the level of each respondent (27 different equations), or at the level of groups such as Total Panel (one equation), gender (two equations), age (two equations), and finally mind-sets emerging from clustering the respondents by the pattern of their coefficients (two equations).
The OLS (ordinary least-squares) regression model emerges with the additive constant, and 16 coefficients. The ‘rules’ for interpreting the parameters are as follows when the dependent variable is either the Top2, ( Agree, ME) or the Bot2 (Disagree, NOT ME)
The additive constant is the estimate percent of times that the rating will be ‘describes me’ (viz., 4 and 5), when there are no elements. Clearly the experimental design ensures that each of the 24 vignettes comprises 2-4 elements, so the additive constant is a purely estimated parameter. One can consider the additive to be a baseline likelihood to agree (Top2) or a baseline likelihood to disagree (Bot2) even before information is presented. In some ways the additive constant can be considered an indication of the way people think about a topic, in general, without specifics.
The coefficient shows the additional percent of responses are added to the dependent variable when the element is inserted into the vignette. Thus, a coefficient element of +6 means that an additional 6% of the responses will be added to the response when the element is inserted. A coefficient of -5 means that 5% fewer of the responses will move away from the dependent variable.
The additive constant and the coefficients sum together. Thus, for the situation of the dependent variable Bot2 (Disagree, Not Me), when the additive constant is 37 and the coefficient is -6, the expected percent of responses for Bot2 for that 1-element vignette is 37 – 6 or 31. In this case the element takes away from Bot2. In contrast, when the coefficient is +9, then the expected percent of responses for Bot2 for that 1-element vignette is 37+9 or 46, meaning there will be 46% of the Bot2 responses for that 1-element vignette.
The vignettes comprised 2-4 elements, meaning that one can combine 2-4 elements to create a new vignette, and estimate the likely rating, making sure that the elements come from different questions. The estimated value is simply the arithmetic sum of the additive constant and the elements.
The strategy for presenting the results will be to show only the elements which are positive, viz., greater than 0, for either Top2 or Bot2, for any subgroup. The rationale is that we are interested in learning about the pattern of elements which drive the response. Showing only positive numbers lets the patterns emerge clearly. Highlighting strong performing elements (coefficients of +8 or higher for the binary transformation) further allows the patterns to emerge in greater relief.
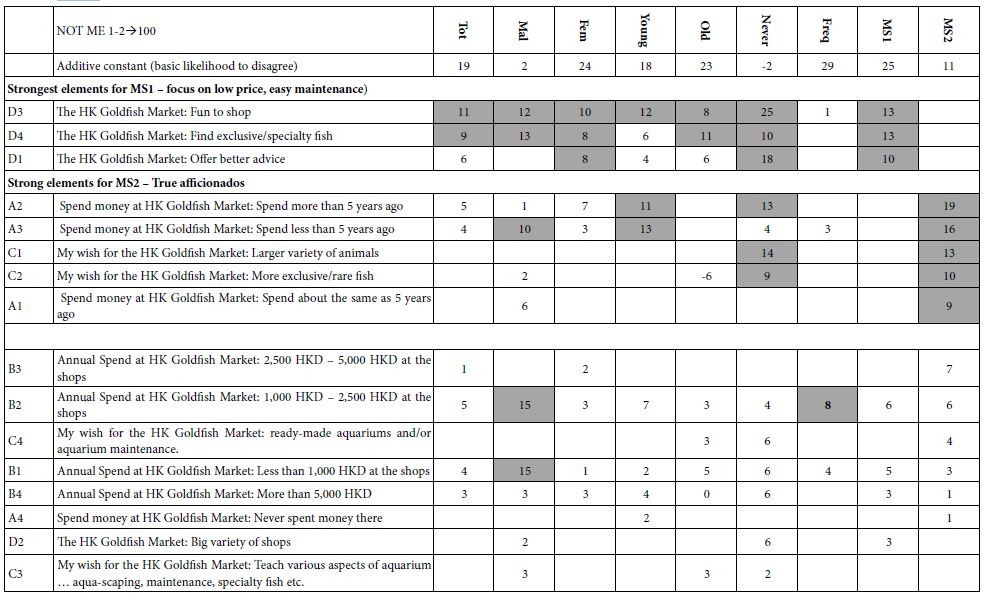
A further strategy when presenting the data will be to sort the data in descending order by the two mind-sets, highlighting the strong performing elements by shading the cells in which coefficients are +8 or more. A coefficient of +8 corresponds to an element which is around two standard errors beyond the coefficient of 0, and suggests a strong impact of the element on the binary rating
Table 3 presents the results for the Top2 binary variable, defined as: Agree, or ME. we begin with the additive constant
- Total Panel – About Half of the responses will agree (additive constant = 46).
- Males show a strong propensity to agree (additive constant = 70), females show a moderate propensity (additive constant = 43).
- Younger respondents (17-29) and older respondents (30+) show similar propensities to agree (additive constants of 45 for younger and 42 for older).
- Respondents who never frequented the HK Goldfish Market show a strong propensity to agree (additive constant = 76), frequent shoppers show a moderate propensity to agree (additive constant = 40).
- Mind-Set 1 (focus on low price, easy maintenance) show a moderate propensity to agree (additive constant = 40), Mind-Set (True Afficionados) show a strong propensity to agree (additive constant = 63).
In terms of the performance of the elements, many elements are positive, meaning that the respondent feels that they describe the respondent’s feelings. There are, however, a great number of elements with zero or negative coefficients.
- The most consistently strong element is C4: My wish for the HK Goldfish Market: ready-made aquariums and/or aquarium maintenance.
- A variety of other elements emerge as strong for the different geo-demographic and behavioral groups, but not consistent pattern that lends itself to easy identification.
- When we divide the respondents by the pattern of what describes them, creating two mind-sets, we find two clear groups. Mind-Set 1 focuses on easy maintenance, appearing to spend less money or no money. They have a lower additive constant, 40, meaning that they are not likely to agree, to feel that the phrases in the vignette apply to them. In contrast, Mind-Set 2 spends a lot of money, and wants high quality, interesting fish, and equipment. Furthermore, Mind-Set 2 has an additive constant of 63, meaning that they are ready to agree. We present the mind-sets as the final two columns of data, sorting the table by mind-set to reveal the patterns, which emerge clearly after the sorting. There is no such clarity of pattern for any other grouping of the respondents, viz. WHO they are or what they DO.
The approach to creating mind-sets using Mind Genomics has been previously described in previous papers [10]. The ingoing assumption is that respondents with similar patterns of coefficients for the 16 elements on Top2 (agree) belong to the same mind-set. Respondents with dissimilar patterns of coefficients belong in different mind-sets. The data from these studies suggest two clearly different mind-sets. Using mind-sets to organize data is not limited to Mind Genomics but has been shown to be a stimulus to creative thought [11].
4. By focusing only on the positive elements, and highlighting the strong performers, the nature of the mind of the respondent becomes clearly with respect to the HK Goldfish Market, in a way hard to capture by conventional anthropological observation, sociological analysis, or market research. One begins to sense the structure of the people for this granular part of the Hong Kong ‘every day.’
Table 4 present the reverse scale focusing on disagree. The groups are the same, total, gender, age, frequency of visit, and the two emergent mind-sets from clustering the respondents on Top2. Again, only the positive coefficients are shown except for the additive constants.
In contrast to the clarity of results from Table 3, showing agreement (ME), the pattern of additive constants and coefficients in Table 4 is confusing. The difficult of discovering a clear pattern may emerge because responses focus on what they agree with. What they fail to agree upon may either be irrelevant, or important. In either case, respondent appears to focus on using only one side of the scale. The respondent may not be ‘weighing’ the entire set of elements to come up with a single composite judgment, but rather may simply focus on finding the key element, ignoring everything else. In such a case the pattern would be one-sided, clearer when the respondent focuses primarily on agreement. To test this hypothesis may simply require a parallel study with the respondent instructed to focus either on agreement in one test cell, or disagreement in another test cell.
Table 3: Coefficients for the ‘Top2’ model, relating the presence/absence of the elements to the Top2 value. In the interest of clarity, only the positive coefficients are shown.
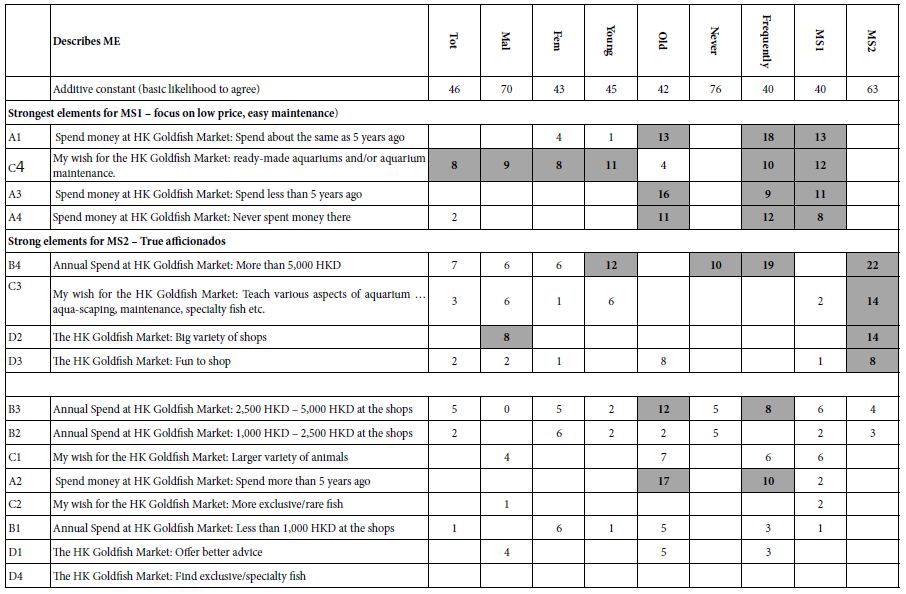
Table 4: Coefficients for the ‘Bot2’ model, relating the presence/absence of the elements to the Bot2 value. In the interest of clarity, only the positive coefficients are shown.
The final analysis of groups looks at the response time, defined operationally as the number of seconds between the appearance of the vignette on the screen and the assignment of a rating by the respondent. The modeling is the same as that for Top2 and Bot2, with one exception. The exception is that the additive constant is omitted from the model for the response time vs elements. The rationale is that in the absence of elements there is no response.
Table 5 shows the estimated response times assignable to each element. The first data column, for Total Panel, shows all 16 coefficients. The range of coefficients goes from a low of 0.3 seconds (A3: Spend money at HK Goldfish Market: Spend less than 5 years ago) to a high of 0.9 seconds, such as D2 (The HK Goldfish Market: Big variety of shops), C1 (My wish for the HK Goldfish Market: Larger variety of animals). B3 (Annual Spend at HK Goldfish Market: 2,500 HKD – 5,000 HKD at the shops), and so forth. There is no clear pattern for the Total Panel, other than perhaps that the elements describing the offerings tend to engage the respondent a little long.
Table 5: Coefficients for the ‘Response Time’ model, relating the presence/absence of the elements to the measured response time. With the exception of the Total Panel, onlypositive coefficients are shown, in the interest of clarity and simplicity.
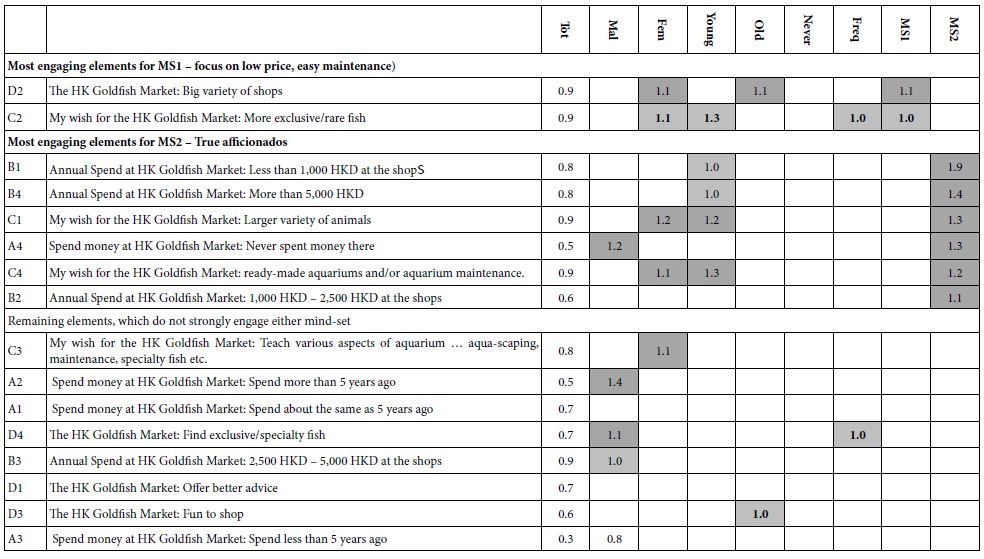
As done for Tables 2 and 3, the rest of Table 4 shows only those elements which are deemed to be ‘engaging,’ viz., show response times of 1.0 seconds or longer. The cut-off of 1.0 seconds is strictly an operational, giving a sense of the types of elements which engage.
- Males seem to be more engaged by elements dealing with price. Females seem to be more engaged by elements dealing with features.
- Young respondents are far more likely to be engaged by elements, older respondents are not.
- Those who say they never frequent the HK Goldfish Market are not engaged by any elements. Those visit frequently are engaged by only one element, D4 (The HK Goldfish Market: Find exclusive/specialty fish)is
- Mind-Set 1, (focus on low price & easy maintenance), is engaged by two elements, D2 and C2, dealing with variety. Mind-Set 2 (true afficionados) is engaged by both price and features, showing deeper engagement as reflected by response time. The deepest engagement is 1.9 seconds, B1 (Annual Spend at HK Goldfish Market: Less than 1,000 HKD at the shops). This element may surprise and intrigue, because it is so contrary to the behavior and interests of the afficionado.
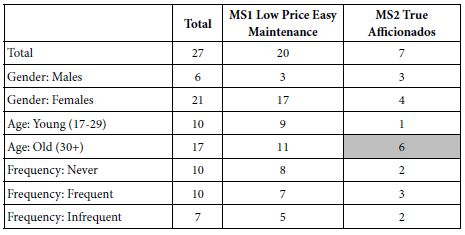
Generalizing the Results – Finding these Mind-sets in the Population for Science and Business. With a small group of 27 respondents, the distribution of respondents into mind-sets will be error prone. The small base size of respondents finds it best use as a tool to uncover hitherto-unexpected mind-sets. The small number of respondents used for discovery does not suffice to estimate the proportion of these mind-sets across the population, especially in different countries. Thus, with small base sizes, the distribution of mind-sets across relevant subgroups is at best a rough estimate. Table 6 shows this distribution. Mind-Set 1 comprises most of the respondents. Furthermore, that the most outstanding aspect of the distribution is that of the seven respondents in Mind-Set 2 (True Afficionados), six are older respondents, far more than would have been expected.
Table 6: Distribution of respondents from the total panel and two mind-sets across gender, age, and frequency of visiting the HK Goldfish Market.
Given the distribution of mind-sets shown by Table 6, how can the researcher or digital marketer assign a new person to one of the two mind-sets for this granular topic of a pet market? Recently, author Moskowitz in collaboration with Hungarian researcher Attila Gere developed an approached called the PVI, the Personal Viewpoint Identifier. The PVI is based upon the data from Table 4, the coefficients from the transformed data (Top2). The PVI uses simulation and decision trees to create a system which assigns a new person to one of the two (or three) emergent mind-sets from a Mind Genomics study [10-14].
Figure 4 shows the introduction to the PVI. These data can be customized, so that the data are entirely anonymized, or the data can include such information at telephone or email, for follows-ups. Figure 5 shows the set of informational questions about the respondent, and then the six questions comprising the PVI itself. The four first questions, ‘information’, are equivalent to the types of questions researchers ask about attitudes and usage for topics of interest. Figure 6 shows the format of the template used to transfer data from the Mind Genomics study to the PVI. Note that after the data from the respondent are stored in a database, and the respondent is sent an email of results, the respondent may be guided to a video stored in YouTube, or to a landing page. Thus, the PVI serves both as an information-gathering system, and as a tool for e-commerce.
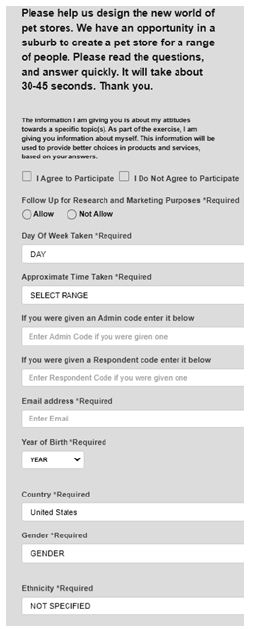
Figure 4: Introduction to the PVI for a ‘pet market’. https://www.pvi360.com/TypingToolPage.aspx?projectid=1269&userid=2
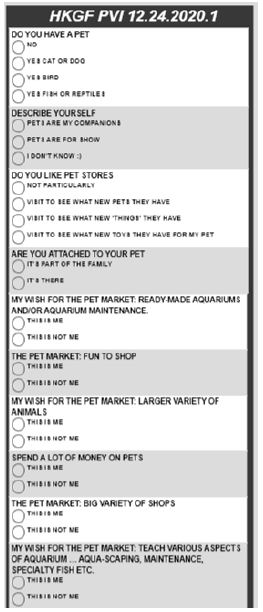
Figure 5: Classification questions and the PVI itself. The first four questions are classification (attitude and usage). The second six questions constitute the PVI.
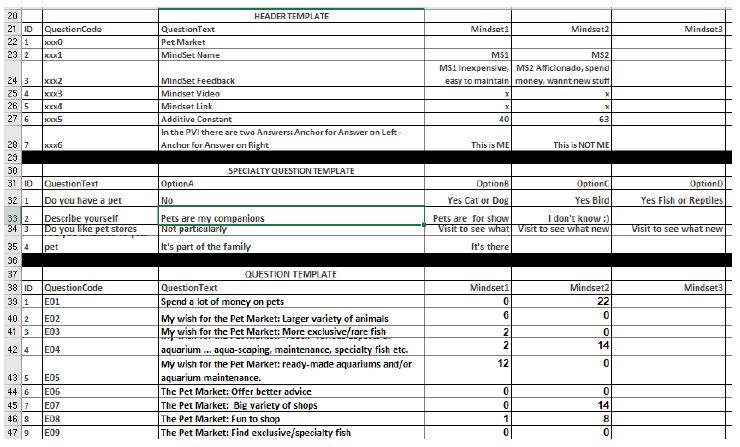
Figure 6: The Excel® based template, allowing the researcher to select the elements, the classification questions, the binary PVI questions, and the post-PVI experience with a video or landing page. The PVI is computed after the template is completed.
Discussion and Conclusions
For most of the history of psychology, experiments have presented the respondent with artificial situations to uncover rules of behavior. The experiments are crafted from theory, to prove or disprove a hypothesis. The study presented here on the HK Goldfish Market reveals the potential of increasing our understanding of the granular, every-day, unremarkable experience, revealing patterns of decision-making, and emergent understanding at several levels.
Taking its cue from consumer research, anthropology, sociology, as well as statistics, the newly emerging science of Mind Genomics works in a different way, one that might be called a cartographic analysis. The objective is to not to develop general hypotheses about behavior, and either show that they describe the data, or falsify the hypothesis. Rather, Mind Genomics uses the methods of experimental science to understand how people react.
The experiments in Mind Genomics are easy to perform, and the subject matter is boundless. As a consequence one need not create a hypothesis and test that hypothesis by manipulation to prove or disprove the hypothesis, or even conjecture It is adequate to act like an explorer, a cartographer, mapping the land, finding interesting areas, unusual formations, and the ‘stuff’ worth talking about. Mind Genomics as a science should appeal to those who are not interested in the traditional tasks of ‘filling holes in the literature,’ nor responding to calls to answer key issues. Instead, and in the spirit of the early Baconian philosophers of natural science, it is sufficient to map the topic, to study the different aspects, without being forced to justify one’s scientific curiosity by first putting up a hypothesis to be proved or disproved, the hallmark of today’s hypothetico-deductive method (Grimes, 1990).
References
- Moskowitz HR (2012) ‘Mind genomics’: The experimental, inductive science of the ordinary, and its application to aspects of food and feeding. Physiology & Behavior 107: 606-613. [crossref]
- Warde A (2016) The practice of eating. John Wiley & Sons.
- Carruthers BG, Kim JC (2011) The sociology of finance. Annual Review of Sociology 37: 239-259.
- Whyte W (1957) The Organization Man. Garden City. NY Doubleday.
- Moschis GP, Mathur A (2007) Baby boomers and their parents: Surprising findings about their lifestyles, mindsets, and well-being. Paramount Market Publishing.
- Han Z, Lai LW, Fan J (2002) The ornamental fish retail market in Hong Kong: its evolution and evaluation. Aquaculture Economics & Management 6: 231-247.
- Lam KKH, Lai LWC (2002) Goldfish (Chin‐yu or Kin‐yu) culture practice in Hong Kong. Aquaculture Economics & Management 6: 275-293.
- Gofman A, Moskowitz H (2010) Isomorphic permuted experimental designs and their application in conjoint analysis. Journal of Sensory Studies 25: 127-145.
- Kahneman D (2011) Thinking, fast and slow. Macmillan.
- Porretta S, Gere A, Radványi D, Moskowitz H (2019) Mind Genomics (Conjoint Analysis): The new concept research in the analysis of consumer behaviour and choice. Trends in Food Science & Technology 84: 29-33.
- Boaler J (2015) Mathematical mindsets: Unleashing students’ potential through creative math, inspiring messages and innovative teaching. John Wiley & Sons.
- Grimes TR (1990) Truth, content, and the hypothetico-deductive method. Philosophy of Science 57: 514-522.
- Moskowitz HR, Gofman A, Beckley J, Ashman H (2006) Founding a new science: Mind Genomics. Journal of Sensory Studies 21: 266-307.
- Moskowitz Howard R, Sebastiano Porretta, Matthias Silcher (2008) Concept research in food product design and development. John Wiley & Sons.