Abstract
In recent years, obesity has been identified as a risk factor for several cancers including endometrial cancer. This paper identifies molecular mechanisms that are potential causes or effects of the correlation between obesity and endometrial cancer. From public sources, metabolites involved in endometrial cancer were extracted and analyzed with pathway analyses. Several elucidated pathways and mechanisms were involved with both obesity and cancer and were studied to better understand the relationship between obesity and endometrial cancer. These pathways include the Adipocytokine signaling pathway, Insulin resistance pathway, and Glucagon signaling pathway. The Adipocytokine signaling pathway showed a relationship between leptin, a body-weight regulating hormone, and the JAK–STAT3 pathway known to promote cancer cell proliferation. The Insulin resistance pathway shows insulin, an obesity-related hormone, activating the STAT3 protein as well as the PI3k–Akt and the mTOR signaling pathways, all of which can lead to increased cancer risk. The Glucagon signaling pathway gave evidence that glucagon may have anticancer properties as it activates the FOXO signaling pathway, which suppresses cancer cell growth. Metabolic syndrome as well as foods with high glycemic loads may hinder the anticancer potential of glucagon and lead to an increase in endometrial cancer risk. Such results can provide targets for reducing the risk or progression of cancer and provides information on the effects of certain lifestyles on endometrial cancer risk.
Introduction
Endometrial cancer is the cancer of the innermost lining layer of the uterus. Endometrial cancer is the most common cancer of the female reproductive organs. In 2020, the American Cancer Society projections for cancer of the uterus in the United States are 65 620 new cases and 12 590 deathsincluding 59 060 and 11 330 for endometrial cancer accordingly (https://www.cancer.org/cancer/endometrial-cancer/about/key-statistics.html, accessed February 17, 2020). Endometrial cancer has a variety of risk factors, such as advanced age, hormonal imbalance, and diabetes. Additionally, one of the most prevalent risk factors of endometrial cancer is obesity. In the US, an estimated 57% of endometrial cancer cases are directly attributable to being overweight or obese [1]. This correlation has been proven by several meta-analyses, such as the American Institute for Cancer Research’s report that for every increase of five Body Mass Index (BMI) units (kg/m2), there was a 50% increase in the risk of developing endometrial cancer [1]. Among the reasons for this correlation is the fact that fat tissue can alter hormonal balance and increase estrogen levels and is related to insulin resistance, all of which have been directly linked to increased risk of endometrial cancer. Furthermore, several mechanisms involved in obesity have been identified as risk factors for endometrial cancer. The identification of obesity-related mechanisms in endometrial cancer networks has shown the oncogenic effects of various pathways and proteins. Such biological functions within the body can activate cancer-causing pathways and genes or inhibit anticancer processes. The Akt signaling pathway, activated by leptin and other obesity-related hormones, was shown to have a correlation with endometrial cancer when cancer cell proliferation decreased as Akt was inhibited in Ishikawa cells [2]. Obesity-caused activation of the STAT3 protein through leptin and insulin resistance, increases endometrial cancer risk as it promotes induction of oncogenic genes such as c-Myc [3]. Insulin resistance, commonly associated with obesity, is related to activation of TNF and mTOR signaling pathways that promote endometrial cancer [4,5]. Obesity-related proteins and genes, such as c-Myc, TNF-ɑ, S6K, and eIF4E, contribute to cell proliferation, protein synthesis, and oncogenesis [6,7]. Other proteins and genes, such as FOXO1, have tumor-suppression properties [8]. Similar studies demonstrated that cancers of the breast, colon, rectum, esophagus, kidney, and pancreas have also been linked to being overweight or obesity (Figure 1) [9,10].
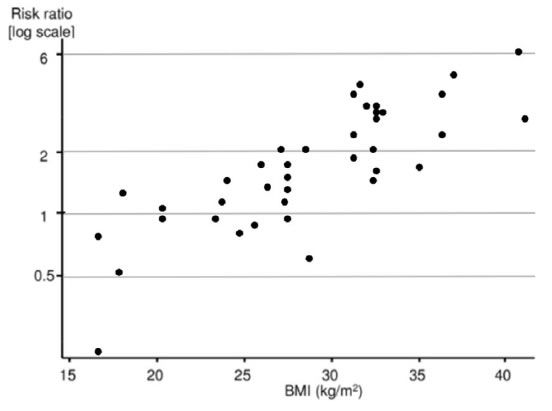
Figure 1. Relationship of Body Mass Index and risk of endometrial cancer. Graph shows a positive correlation between BMI and endometrial cancer risk from several studies. Adapted from reference [10].
Materials and Methods
Approach Overview
Collected from public sources metabolite data were analyzed by Ingenuity® Pathway Analysis (IPA®, Santa Clara, CA; Krämer et al. 2014) [11] program. Created by the IPA program metabolite–gene networks were elucidated by the Database for Annotation, Visualization and Integrated Discovery (DAVID) software and analyzed withGeneFriends package (Figure 2).
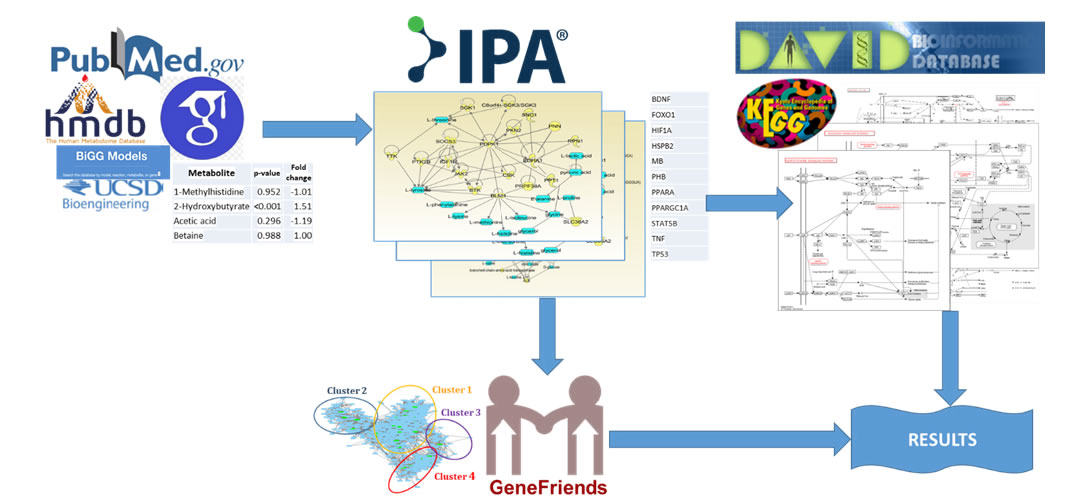
Figure 2. Approach overview. Data from public sources are inputted to Ingenuity Pathway Analysis (IPA®) program and results are analyzed by Database for Annotation, Visualization and Integrated Discovery (DAVID) Functional Analysis Tool yielding significant KEGG pathways. Then results analyzed by GeneFriends program to find co-expressed genes and cluster them.
Metabolite Selection and Analysis
Metabolites specific to endometrial cancer were selected from public sources: articles from PubMed and Google Scholar libraries, Human Metabolite Database (https://hmdb.ca/) and BiGG Models (https://bigg.ucsd.edu). To use significant metabolites only they were cut off by p-value and fold change.
Ingenuity® Pathway Analysis
Ingenuity® Pathway Analysis (IPA®; QIAGEN Inc., Redwood City, Calif., USA; Krämer et al. 2014; https://www.qiagenbioinformatics.com/products/ingenuity-pathwayanalysis) [11] is a web-based analysis software that allow to understand complex ‘omics data. Using a list of genes or metabolites, it allows identifying signaling and metabolic pathways, interaction molecular networks, and their functions.
David
The Database for Annotation, Visualization and Integrated Discovery (DAVID) is an online server that consists of the DAVID Knowledgebase and five integrated functional annotation tools for bioinformatics data. It allows, among other functions, functionally classify and annotate genes, convert gene IDs, search for interesting and related genes, highlight them on signaling and metabolic pathways, and view these genes dynamically.
GeneFriends
GeneFriends is a tool that creates a large co-expression map from a wide variety number of datasets. There are two variants to this tool: a dataset consisting of microarray datasets [12] and a dataset consisting of RNA-seq samples [13]. The RNA-seq map currently consists of 46 475 human samples and 34 332 mouse samples while the microarray map currently consists of 4164 human microarray datasets and 3571 mouse datasets. This tool is used to elucidate clustered co-expressed genes since genes that are activated simultaneously tend to share similar transcriptional regulation. Novel genes probably related to the disease of study can be elucidated based on a guilt-by-association approach when observed to be co-expressed with known candidate genes. The microarray version of the program GeneFriends was used to elucidate the genes coexpressed with our genes of interest using over 1000 microarray datasets [12].
Results
Metabolites Selection
Selected metabolites underwent two cutoffs:
• byp-value (p). Metabolites with p<= 0.05 considered as significant.
• by fold change (FC). To reduce noise, the metabolites with 1.33 < FC < 0.67 were used.
The list of metabolites selected is presented in Table 1.
|
Table 1: List of metabolites from endometrial cancer patients [14]. |
||
|
Metabolite |
p-value |
Fold change |
|
1-Methylhistidine |
0.952 |
-1.01 |
|
2-Hydroxybutyrate |
<0.001 |
1.51 |
|
Acetic acid |
0.296 |
-1.19 |
|
Betaine |
0.988 |
1.00 |
|
L-Carnitine |
0.386 |
-1.31 |
|
Creatine |
0.214 |
-1.19 |
|
Citric acid |
0.612 |
-1.16 |
|
Choline |
0.443 |
1.11 |
|
D-Glucose |
0.386 |
1.09 |
|
Glycine |
0.375 |
-1.13 |
|
Glycerol |
0.620 |
1.09 |
|
Formic acid |
0.911 |
-1.01 |
|
L-Glutamic acid |
0.843 |
-1.03 |
|
L-Tyrosine |
0.540 |
-1.06 |
|
L-Phenylalanine |
0.779 |
1.03 |
|
L-Alanine |
0.816 |
-1.02 |
|
L-Proline |
0.320 |
-1.10 |
|
L-Threonine |
0.772 |
-1.04 |
|
L-Isoleucine |
0.695 |
-1.04 |
|
L-Histidine |
0.832 |
-1.03 |
|
Lysine |
0.850 |
1.02 |
|
L-Lactic acid |
0.601 |
1.06 |
|
Pyruvic acid |
0.419 |
1.08 |
|
3-Hydroxybutyric acid |
<0.001 |
2.76 |
|
L-Arginine |
0.314 |
-1.10 |
|
Creatinine |
0.661 |
1.06 |
|
L-Glutamine |
0.849 |
1.01 |
|
L-Leucine |
0.731 |
-1.04 |
|
L-Methionine |
0.002 |
-1.35 |
|
L-Valine |
0.702 |
-1.04 |
|
Acetone |
<0.001 |
1.79 |
Gene-metabolite Network Analysis
The metabolites were analyzed by the IPA® program, elucidating gene-metabolitenetworks including the selected metabolites, genes, and other entities (Figure 3).
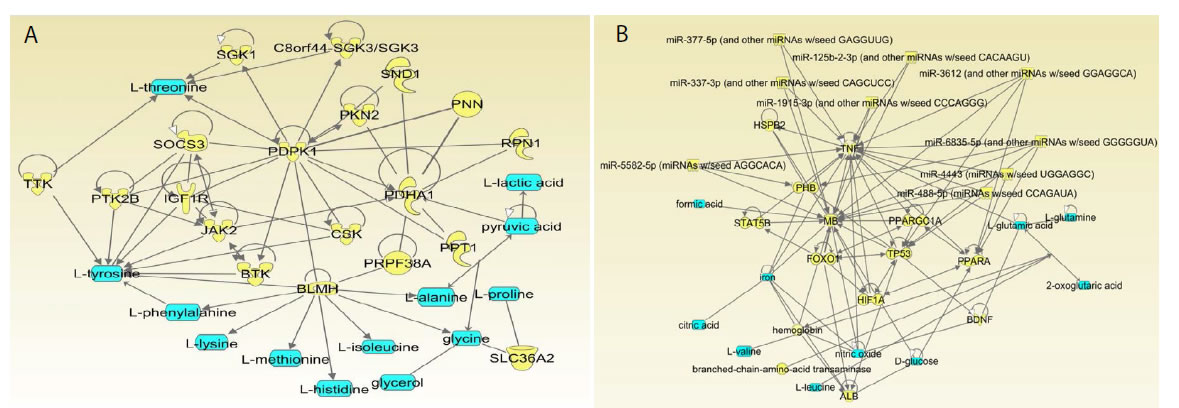
Figure 3. Ingenuity Pathway Analysis networks 1 (a) and 2 (b) including endometrial cancer metabolites. Metabolites from the public sources [14] inputted into IPA, colored in blue. Proteins, colored yellow, were extracted and inputted into DAVID Functional Annotation Tool.
Many genes in these networks have a dual function involved in obesity/insulin resistance/diabetes mechanisms along with clear involvement in cancers including endometrial cancer (Table 2).
|
Table 2: Genes extracted from IPA networks created on the basis of metabolites in endometrial cancer. |
||
|
BLMH |
PPT1 |
BDNF |
|
BTK |
PRPF38A |
FOXO1 |
|
C8orf44-SGK3/SGK3 |
PTK2B |
HIF1A |
|
CSK |
RPN1 |
HSPB2 |
|
IGF1R |
SGK1 |
MB |
|
JAK2 |
SLC36A2 |
PHB |
|
PDHA1 |
SND1 |
PPARA |
|
PDPK1 |
SOCS3 |
PPARGC1A |
|
PKN2 |
TTK |
STAT5B |
|
PNN |
ALB |
TNF |
|
TP53 |
||
Network 1
In this network, a number of genes have dual function and are involved in cancer and obesity mechanisms. We will describe some examples of such dual genes (Figure 3a).
PDPK1 (PDK1)
PDPK1 (PDK1) (3-Phosphoinositide Dependent Protein Kinase 1) as a gene phosphorylating AKT1 and involved in MYC1 pathway is very important in mechanisms of various cancer including endometrial cancer [14,15].PDPK1 gene is also a key player in the obesity. It phosphorylates AKT1, which is important in insulin signaling. Inhibiting of PDPK1 affects AKT1 function and consequently insulin signaling and weight gain [16].Intervention of a lifestyle decreasing insulin resistance led to significant degrease of PDPK1 (PDK1) gene expression confirming its dependence on obesity-related parameters [17].
IGFR1
IGFR1 (Insulin-like growth factor 1 receptor) is an important gene activating PI3K/ACT signaling pathway. Interesting to note that its expression growth proportionally to BMI and is leads tocancer prognosis [18]. Levels of activation of IGFR1 were found to be significantly higher in patients with endometrial cancer and insulin-resistant Diabetes II [19].
PPT1
Palmitoyl-protein thioesterase 1 (PPT1) is a lipoprotein;it has been shown that PPT1 gene is overexpressed in insulin-resistant patients [20]. PPT1 also significantly promotes tumor growth; PPT1 plays an important role in autophagy in cancer cells along with activation of mTORC1 [21].
SOCS3
As pointed by Sutherland and colleagues, silencing of the suppressor of cytokine signaling‑3 (SOCS3) by hypermethylationmay promote the oncogenic transformation of epithelial tissues and support growth of tumors [22]. It brings this gene in the set of tumor-suppressing genes. In obesity, SOCS3 plays a role of negative regulator of leptin-activation signaling actually increasing the leptin-resistance [23]. So, we can speculate that in both cases—cancer development and obesity methylation—silencing of SOCS3 would lead to disease enhancement.
BTK
BTK (Bruton’s tyrosine kinase) functions as a dual regulator of apoptosis and plays numerous other roles in cancer development [24]. BTK also plays a significant role in obesityleading to insulin resistance [25].
TTK
TTK protein kinase is a dual specificity protein kinase associatedwith cell proliferation. TTK has been found to be expressed in cancers such as pancreatic ductal adenocarcinoma, where cell proliferation was weakened when TTK was knocked down [26]. High expression levels of TTK was also found in clear cell renal cell carcinoma cells, and cell proliferation and invasion were suppressed with the knockdown of TTK [27].
SGK1
SGK1 (Serum/glucocorticoid regulated kinase 1) is involved in cellular stress response. SGK1 is known to be stimulated by insulin-related diseases as well as hyperglycemia [28]. SGK1 has also been found to have positive correlations with cancer progression and metastasis [29].
Network 2
Network 2 also contains dual-function genes. Several examples are presents below (Figure 3b).
TP53
Function of TP53 as a tumor suppressor is well known and does not need more explanation. In the same time not very obvious its role in obesity. Interesting findings demonstrated Morikawa and colleagues [30]. They found that TP53 expression changes to increase (positive) in patient with close to normal BMI. In the patients in obese category TP53 mostly has decreased expression (negative).Among the patients of invasive bladder cancer normal weight, overweight, and patients with obesity had a TP53 mutation frequency of 68.4%, 44.8%, and 25%, respectively (P < 0.05)” [31]. It means that mutational frequency of this gene is lower in obese patients. These fact that cancer rate is higher and TP53 expression is lowerin patients with lower BMI leads to a suggestion that obesity plays a significant role in cancer independently of the TP53 mutations. It can be related to higher probability of cancer proliferation in the adipose cells, more intensive development of blood vesicles in the tumors of obese patients, and other factors.Interesting to note that we found the same relations in some viral proteins impact to cancer development. We elucidated that presence of HPV viral proteins in patients with ovarian cancer leads to cancer development requiring less cancerogenic mutations than ovarian cancer without HPV (Shang, 2020 in press).
FOXO
FOXO (Forkhead box O3) phosphorylation leads to insulin resistance initiated by ER stress [32]. FOXO genes family has various roles in cancer development. Inactivation of FOXO function leads to uncontrolled cell proliferation and accumulation of DNA damage associated with cancer development [33].
PPARA
PPARA (Peroxisome proliferator-activated receptor-alpha) polymorphisms lead to cancer development [34]. It is also known that liver oncogenesis is significantly dependent on miRNAimpact on PPARA gene [35].
HIF1
HIF-1 (Hypoxia-inducible factor-1) regulates cellular response to hypoxia.As a transcription factors it increases concentration of genes involved in angiogenesis, cell survivaland other cancer-related activities [36]. In the same time HIF1 activation leads to white adipose tissue expansion in obese patients [37].
PHB
PHB (Prohibitin) is a “pleiotropic protein that has roles in both adipocytes and immune cells” [38]. PHB has been found to be upregulated in tumor cells from leukemia and lymphoma and it is associated with cancer progression [39]. PHB expression has been linked to both diabetes and cancer [38].
BDNF
BDNF (Brain Derived Neurotrophic Factor) has been found to play a role in cancer cell growth and progression through the stimulation of oncogenic pathways [40]. BDNF expression and mutation have also been associated with obesity [41].
Signaling Pathways Analysis
Genes elucidated the IPA networks as interacting with the endometrial cancer-related metabolites were analyzed by the DAVID program (Table 2). As expected, several KEGG pathways involving cancer were identified, including proteoglycans in cancer, prostate cancer, and pathways in cancer (Table 3). Moreover, several pathways that were identified were associated with obesity, which could reveal underlying mechanisms involving obesity and endometrial cancer.In order to understand the relationship between obesity and endometrial cancer, the adipocytokine signaling pathway, insulin resistance pathway, and glucagon signaling pathway from the list of these pathways were closely analyzed.
|
Table 3: KEGG pathways identified by the DAVID program.Count – number of inputted genes in the selected pathway. |
||
|
Pathway Name |
Count |
p-Value |
|
Insulin resistance |
6 |
1.60E-05 |
|
Adipocytokine signaling pathway |
5 |
6.30E-05 |
|
Proteoglycans in cancer |
6 |
3.00E-04 |
|
Hepatitis C |
5 |
5.90E-04 |
|
Prostate cancer |
4 |
2.10E-03 |
|
Glucagon signaling pathway |
4 |
2.90E-03 |
|
PI3K-Akt signaling pathway |
6 |
3.20E-03 |
|
Thyroid hormone signaling pathway |
4 |
4.50E-03 |
|
AMPK signaling pathway |
4 |
5.50E-03 |
|
FoxO signaling pathway |
4 |
7.00E-03 |
|
Insulin signaling pathway |
4 |
7.60E-03 |
|
Hepatitis B |
4 |
8.70E-03 |
|
Central carbon metabolism in cancer |
3 |
1.50E-02 |
|
Fc epsilon RI signaling pathway |
3 |
1.60E-02 |
|
Prolactin signaling pathway |
3 |
2.50E-02 |
|
Pathways in cancer |
5 |
2.70E-02 |
|
Herpes simplex infection |
4 |
2.80E-02 |
|
HIF-1 signaling pathway |
3 |
3.50E-02 |
|
Osteoclast differentiation |
3 |
5E-02 |
|
Sphingolipid signaling pathway |
3 |
5E-02 |
Adipocytokine Signaling Pathway
There is a high correlation between obesity and leptin concentration levels. Leptin is a hormone that regulates appetite, body mass composition, and energy expenditure. This hormone, while promoting lower food intake and fat loss, is often found in high concentrations alongside obesity when the hormone fails to induce weight loss. This effect is known as leptin resistance. Hyperleptinemia, where high levels of leptin are present in the bloodstream, is almost exclusively observed in obese animals. Leptin is primarily secreted in adipocytes and its expression is increased by obesity-related factors, such as overfeeding and insulin resistance [42,43]. The expression of leptin can be a risk factor for cancer. Leptin activates JAK, which then phosphorylates STAT3 (Figure 4). The activation of STAT3 is shown to significantly increase cell proliferation in endometrial cancer cells. When the phosphorylation of STAT3 was blocked with an inhibitor, the cell growth of the cancer cells decreased [2]. The activation of STAT3 leads to the induction of several oncogenic proteins, including c-Myc. In endometrial cancer cells, expression of the c-Myc gene increases cancer cell proliferation, and when the gene is knocked down, proliferation of the tumor cells dramatically decreases [6].
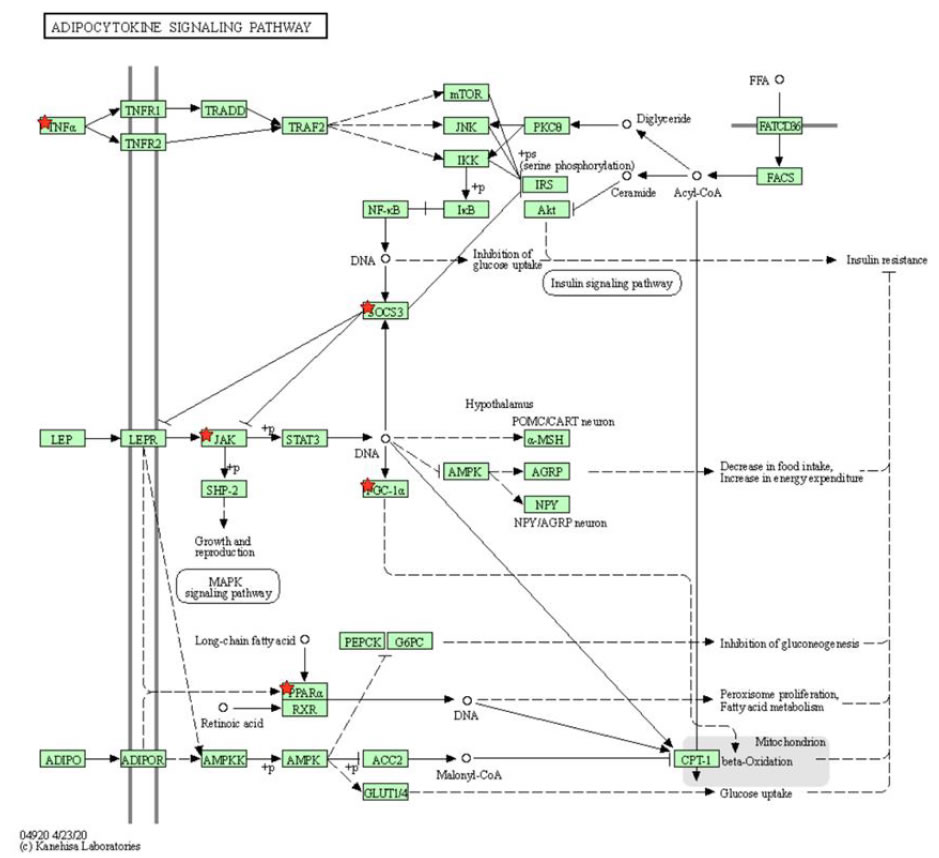
Figure 4. KEGG pathway of adipocytokine signaling pathway selected by DAVID program. Leptin is a hormone that regulates obesity-related functions, such as body mass, appetite, and food intake. Leptin is shown to activate JAK–STAT3 pathway known to drive the proliferation of cancer tumor cells.
Insulin Resistance Pathway
Insulin resistance characterized by resistance to the effects of insulin on glucose uptake is a commonly known result of obesity and is a fundamental aspect of type 2 diabetes. In obesity, weight gain causes an increase in islet β cells, which in its turn increases insulin production. It has been shown that with increased insulin production, hyperinsulinemia occurs and induces insulin resistance [44]. Insulin resistance is related toactivation both the STAT3 and PI3k–Akt pathways (Figure 5). Through IL-6, obesity activates the STAT3 protein, which is known to increase cell proliferation in endometrial cancer through induction of the c-Mycprotein [6]. Additionally, insulin resistance is related to activation the PI3k–Akt and the mTOR signaling pathways (Figure 5). mTOR plays an important role in glucose metabolism and is activated with increased levels of insulin and glucose. Hyperactive mTOR occurs with obesity and nutrient overload, likely due to hyperglycemia or hyperinsulinemia—bothinvolved in the development of insulin resistance and obesity [45]. The activation of mTOR can lead to an increased risk of cancer. mTOR activates S6K and eIF4E (Figure 5), which are responsible for protein synthesis and have been shown to promote cancer cell survival [45]. Obesity leads to the expression of TNF-ɑ (Figure 5). TNF-ɑ can stimulate estrogen synthesis and has a direct impact on cell proliferation in the endometrium; overexpression of TNF-ɑ has been linked to endometrial cancer risk [7].
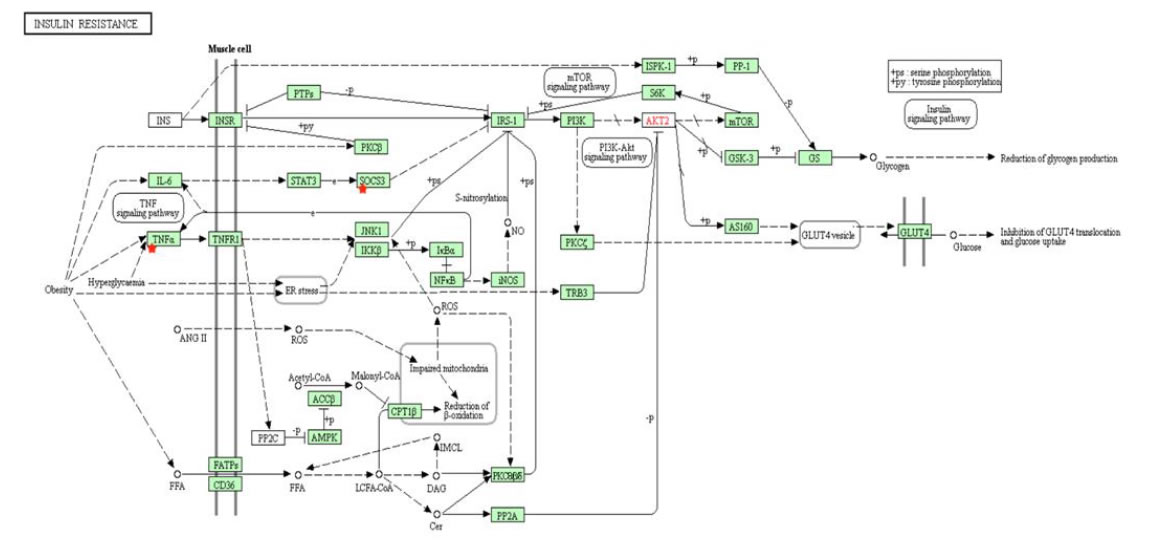
Figure 5. KEGG pathway of insulin resistance from DAVID. Insulin resistance, which is commonly associated with obesity, activates both STAT3 and PI3k–Akt pathways. mTOR, activated by hyperinsulinemia and hyperactive in the obese population, can also lead to increased cancer risk.
Glucagon Signaling Pathway
Several meta-analyses have shown that a high glycemic load diet can increase the risk for endometrial cancer [3,46,47]. Glycemic load (GL) measures the effect a carbohydrate has on blood sugar levels as well as the amount consumed. Diets containing high GL with foods having high glycemic index are commonly associated with weight gain and obesity [48]. High GLs increases blood glucose and insulin levels, which leads to a decline in blood sugar levels within hours, ultimately creating a state of hunger that causes higher food intake and weight gain [49]. During the postprandial stage, a meal with the same nutrition but a higher GL can increase blood sugar levels two-fold, causing hyperglycemia. Hyperglycemia stimulates insulin production to lower blood sugar levels, while inhibiting glucagon release, which in turn would increase blood sugar levels [50]. Increased insulin production could potentially lead to hyperinsulinemia and insulin resistance, increasing the risk of cancer. Furthermore, glucagon has been shown to have anticancer properties on tumor growth as well as breast cancer [51,52]. Glucagon activates the FOXO signaling pathway and phosphorylates FOXO1 (Figure 6). FOXO1 is considered a tumor suppressor gene that is deactivated by insulin and the PI3k–Akt pathway. FOXO1 expression suppressed endometrial cancer cell proliferation in xenograft models and inhibited cell migration in Ishikawa endometrial cancer cells [8]. Diets with a high GL increase insulin levels while inhibiting glucagon release, reducing the activation of FOXO1 and its tumor suppressing properties, causing an increased risk of cancer.
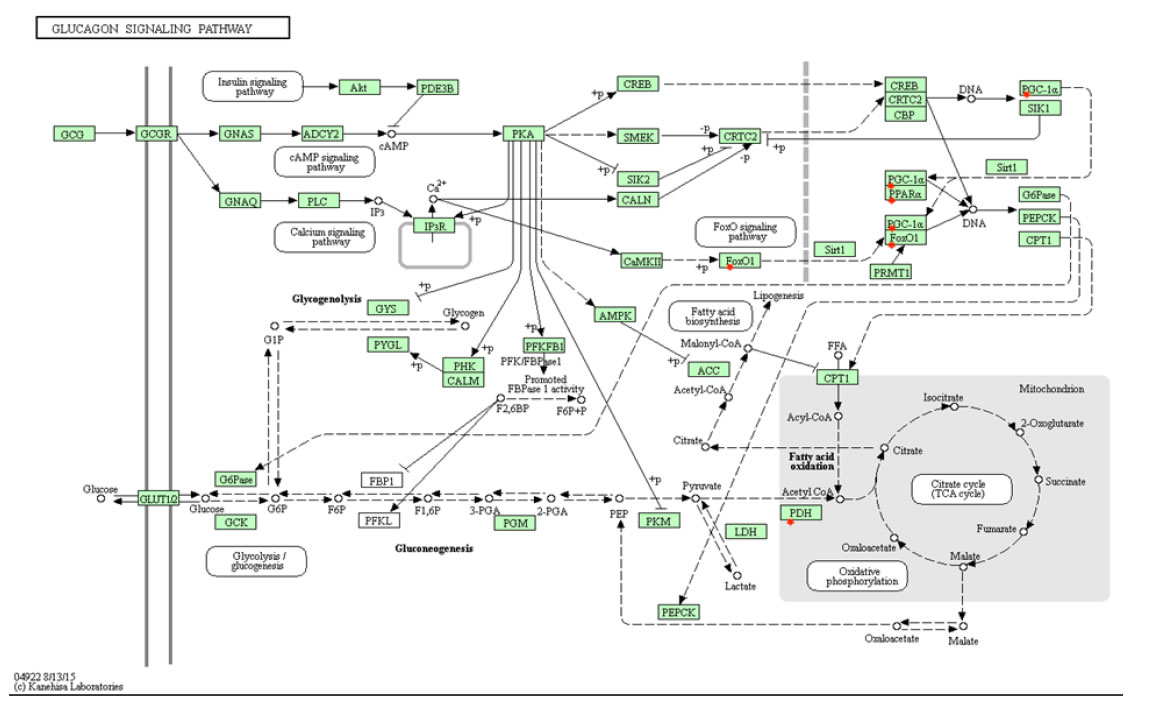
Figure 6. KEGG’s glucagon signaling pathway selected by DAVID program. Foods with high glycemic loads cause hyperinsulinemia and inhibit glucagon release, potentially leading to insulin resistance and obesity. Glucagon, having anticancer properties, can lead to an increased risk of cancer when inhibited.
Similarly Expressed Genes Analysis
To understand more comprehensively the common molecular mechanisms standing behind similarities in endometrial (among the others) cancer with obesity and related events, we performed analysis with the program GeneFriends [12,13]. We submitted to the program our list of genes elucidated by IPA program on the basis of endometrial cancer metabolites. The resulting co-expression networkconsists of four clusters having increased numbers of interconnections (Figure 7). Gene Ontology (GO)—analysis of existing clusters of similarly expressed genes brought the following results.
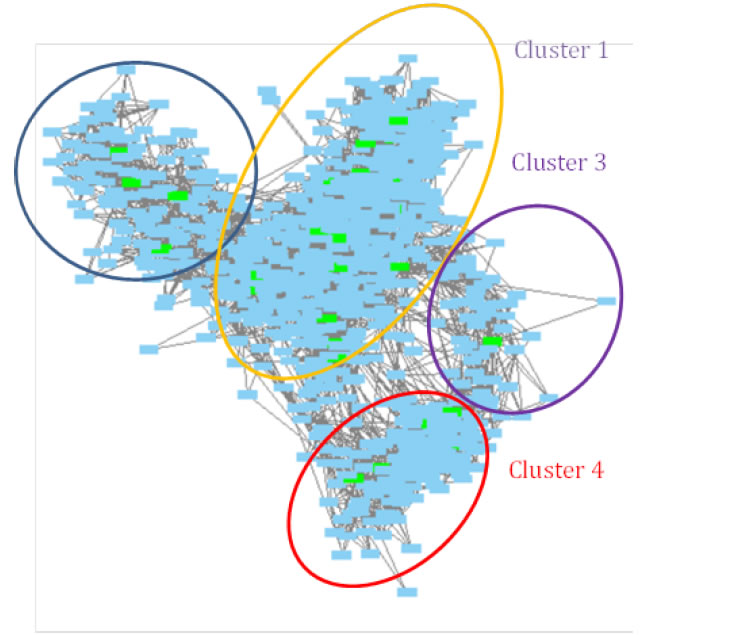
Figure 7. Similarly expressed genes for the genes elucidated based on endometrial cancer metabolites. Green colored nodes represent genes from the original list.
Cluster 1
This contained mostly the genes related to immune response and related pathways activation (Table 4). These results support already pointed fact that immune response related processes are common for cancer and obesity. As noted by Pérez de Heredia and colleagues [53],“Obesity … is known to impair the immune function, altering leucocyte counts as well as cell-mediated immune responses. In addition, evidence has arisen that an altered immune function contributes to the pathogenesis of obesity”. Here, we see the obvious positive feedback when immune response alterations and obesity enhance each other leading to increase of both manifestations. In all cancers, inflammation is a part of the cancer development mechanism and immune response is common to tumor cells. Obesity is also related to inflammation. It is considered a condition causing chronic low-grade inflammation in patients [54]. Adipose tissue produced pro-inflammatory molecules including interleukins 1 and 6, TNFα, IFNγ, etc. and anti-inflammatory interleukins 3, 4, 10, and Ra [54,55].
|
Table 4: GO biological processes of the Cluster 1 of similarly expressed genes. |
|
|
GO biological processes complete |
P-value |
|
Response to organic substance (GO:0010033) |
2.66E-56 |
|
Immune system process (GO:0002376) |
2.29E-53 |
|
Immune response (GO:0006955) |
9.78E-52 |
|
Response to cytokine (GO:0034097) |
4.18E-51 |
|
Cellular response to organic substance (GO:0071310) |
1.92E-50 |
|
Cellular response to chemical stimulus (GO:0070887) |
4.69E-50 |
|
Cellular response to cytokine stimulus (GO:0071345) |
1.10E-49 |
|
Response to chemical (GO:0042221) |
1.59E-44 |
|
Response to stimulus (GO:0050896) |
1.55E-43 |
|
Cytokine-mediated signaling pathway (GO:0019221) |
7.93E-43 |
|
Cell surface receptor signaling pathway (GO:0007166) |
1.60E-40 |
|
Defense response (GO:0006952) |
4.06E-39 |
|
Response to external stimulus (GO:0009605) |
9.91E-39 |
|
Regulation of cell death (GO:0010941) |
2.84E-38 |
|
Signal transduction (GO:0007165) |
1.44E-37 |
|
Regulation of immune system process (GO:0002682) |
1.08E-36 |
|
Positive regulation of immune system process (GO:0002684) |
3.40E-36 |
|
Signaling (GO:0023052) |
7.86E-36 |
|
Cell communication (GO:0007154) |
1.17E-35 |
|
Regulation of cell population proliferation (GO:0042127) |
1.21E-35 |
|
Immune effector process (GO:0002252) |
1.76E-35 |
|
Cell activation (GO:0001775) |
2.98E-35 |
|
Cellular response to stimulus (GO:0051716) |
3.31E-35 |
|
Regulation of programmed cell death (GO:0043067) |
1.07E-34 |
|
Leukocyte activation (GO:0045321) |
4.09E-34 |
|
Regulation of apoptotic process (GO:0042981) |
7.09E-34 |
|
Response to stress (GO:0006950) |
8.63E-34 |
Cluster 2
This contains a number of biochemical reactions-related processes including interactions of various molecules within the cell environment, metabolic processes (Table 5). We will show in some examples that many ofthese processes are common for obesity and cancer.
|
Table 5: GO biological processes of the Cluster 2 of similarly expressed genes. |
|
|
GO biological process complete |
P-value |
|
Lipid metabolic process (GO:0006629) |
9.98E-12 |
|
Steroid metabolic process (GO:0008202) |
7.41E-10 |
|
Small molecule metabolic process (GO:0044281) |
1.66E-09 |
|
Regulation of hormone levels (GO:0010817) |
1.48E-09 |
|
Organic hydroxy compound metabolic process (GO:1901615) |
5.50E-09 |
|
Cellular response to xenobiotic stimulus (GO:0071466) |
1.24E-08 |
|
Regulation of blood circulation (GO:1903522) |
2.42E-08 |
|
Xenobiotic metabolic process (GO:0006805) |
3.68E-08 |
|
Organic acid metabolic process (GO:0006082) |
2.88E-08 |
|
Regulation of system process (GO:0044057) |
3.87E-08 |
|
Monocarboxylic acid metabolic process (GO:0032787) |
3.26E-08 |
|
Hormone metabolic process (GO:0042445) |
3.62E-08 |
|
Negative regulation of endopeptidase activity (GO:0010951) |
3.57E-08 |
|
Negative regulation of proteolysis (GO:0045861) |
4.50E-08 |
|
Cellular lipid metabolic process (GO:0044255) |
4.85E-08 |
|
Carboxylic acid metabolic process (GO:0019752) |
5.82E-08 |
|
Negative regulation of peptidase activity (GO:0010466) |
5.53E-08 |
|
Oxoacid(ketoacid) metabolic process (GO:0043436) |
8.09E-08 |
|
Regulation of wound healing (GO:0061041) |
1.05E-07 |
|
Response to oxygen-containing compound (GO:1901700) |
1.61E-07 |
|
Negative regulation of hydrolase activity (GO:0051346) |
1.73E-07 |
|
Response to stress (GO:0006950) |
1.78E-07 |
|
Platelet degranulation (GO:0002576) |
4.45E-07 |
|
Response to hormone (GO:0009725) |
4.35E-07 |
|
Regulation of response to wounding (GO:1903034) |
5.55E-07 |
|
Response to toxic substance (GO:0009636) |
8.87E-07 |
|
Regulation of localization (GO:0032879) |
8.76E-07 |
|
Response to inorganic substance (GO:0010035) |
1.43E-06 |
|
Regulation of endopeptidase activity (GO:0052548) |
1.96E-06 |
|
Fatty acid metabolic process (GO:0006631) |
2.67E-06 |
|
Terpenoidmetabolic process (GO:0006721) |
2.88E-06 |
|
Secretion (GO:0046903) |
3.20E-06 |
|
Alcohol metabolic process (GO:0006066) |
3.33E-06 |
|
Regulation of peptidase activity (GO:0052547) |
4.13E-06 |
|
Regulation of transport (GO:0051049) |
5.69E-06 |
|
Regulation of response to external stimulus (GO:0032101) |
7.24E-06 |
|
Isoprenoidmetabolic process (GO:0006720) |
8.05E-06 |
|
Tissue homeostasis (GO:0001894) |
8.98E-06 |
|
Drug catabolic process (GO:0042737) |
9.34E-06 |
|
Regulation of heart contraction (GO:0008016) |
1.01E-05 |
|
Drug metabolic process (GO:0017144) |
1.17E-05 |
|
Negative regulation of response to external stimulus (GO:0032102) |
1.30E-05 |
|
Oxidation-reduction process (GO:0055114) |
1.32E-05 |
Lipid Metabolic Process(GO:0006629)
Long and colleagues [56] pointed that “…energy metabolism, especially lipid metabolism, is significantly elevated during carcinogenesis.Furthermore, abnormality of lipid metabolism promotes cancer development, invasion and metastasis…”. In breast cancer the concentration of total cholesterol (TC), triglycerides (TG), high-density lipoprotein (HDL), and low-density lipoprotein (LDL) are significantly higher than in normal tissue. Moreover, concentration of TC and TG significantly higher in patients with metastases [56-58].
Oxoacid (Ketoacid) Metabolic Process
It was shown that key ketolytic enzymes BDH1 and OXCT1 can be biomarkers for possible ketogenic diet for cancer treatment [59]. Low expression level of these genes leads to sensitivity of cancer cells for low carbohydrates treatment.
Cluster 3
Thiscontains mostly processes-related to chromatin assembly, DNA processing, and epigenetic regulation (Supplemental Table S1). Experimental clinical studies of Ebot and colleagues [60] confirmed a link between obesity and prostate cancer through chromatin regulation. Their study demonstrated that in tumor tissues of very overweight/obese vs. healthy weight men, fifteen gene sets were enriched, while they did not change in normal tissues. They noted that patients with high tumor expression of chromatin-related genes had worse clinical characteristics and increased risk of lethal disease independent of grade and stage [60]. Wang with colleagues found that disruption of the bromodomain containing protein 2 (Bdr2), which plays a role in chromatin remodeling, leads to metabolically healthy obesity, with hyperinsulinemia, but enhanced glucose tolerance and low blood glucose, without T2D [61,62].Obesity causes changes in the acetylation distribution in specific cis-regulatory regions. This was supported by the fact of increased gene expression in the carcinogenic genes [63]. Authors also noted that premalignant lesions in obese patients’ colons have more probability to evolve to malignancy [63].
Cluster 4
.This contains mostly processes related to cell cycle (Supplemental Table S2). For obese patients, a number of cell-cycle-related genes were overexpressed including genes mostly involved in adipogenesis that most probably led to expansion of the adipose tissue during obesity [64]. Overexpressed genes promoting cell cycle were also found by Baranova and colleagues [65]. In cancers,defects of cell cycle is one of the most important molecular mechanisms of the disease: “Deregulation of the cell cycle engine underlies the uncontrolled cell proliferation that characterizes the malignant phenotype” [66]. Otto &Sicinski [67] pointed that cell cycle proteins are a promising target for anticancer drugs.
Discussion
Endometrial cancer is the cancer of the endometrium, contributing to an estimated to more than 10000 deaths in 2020. Obesity is recognized as one of the largest factors of increased risk and severity among different cancers, including endometrial cancer. There have been numerous population studies and meta-analyses supporting that an increase in BMI can significantly increase endometrial cancer risk. However, analysis of the molecular mechanisms involving both obesity and endometrial cancer can help elucidate their relationship and provide possibilities for new endometrial cancer therapies. Metabolites related to endometrial cancer obtained from the public sources were analyzed by the IPA program that created the gene–metabolites networks including the genes that interact with inputted metabolites. From the given list of endometrial cancer related genes and metabolites, DAVID Functional Annotation Tool identified several KEGG pathways involved in obesity, including insulin resistance, glucagon and adipocytokine signaling pathways.These pathways revealed potential targets for cancer treatment. For example, the STAT3 pathway, which was involved in both insulin resistance and adipocytokine signaling, could be targeted or inhibited which may reduce the effects of obesity on cancer risk. Lifestyle alterations, such as avoiding excessive food intake and high GL diets, can reduce metabolic syndrome, hyperinsulinemia, and weight gain, which can reduce endometrial cancer risk.In addition, further study on shared obesity and endometrial cancer biological processes via co-expression GO analysis may elucidate how their disease risks are positively correlated.
Data Availability
All data generated are presented in the article and supplemental materials.
Conflicts of Interest
The authors declare that there are no conflicts of interest.
Authors’ Contributions
VLK and IFT designed the study concept; KQW extracted the data; KQW created protein networks and extracted signaling pathways; BKP elucidated the genes with the similar expressions and did GO-analysis of the results; KQW, IFT, and VLK analyzed results; KQW, VLK, and IFT were involved in drafting the manuscript; IFT critically reviewed the manuscript for the intellectual quality of the study. The authors had full access to all data in the study. All authors have given their final approval to the final version of the manuscript.
References
- Onstad MA, Schmandt RE, Lu KH (2016) Addressing the role of obesity in endometrial cancer risk, prevention, and treatment. Journal of Clinical Oncology 34: 4225-4230. [crossref]
- Sharma D, Saxena NK, Vertino PM, Anania FA (2006) Leptin promotes the proliferative response and invasiveness in human endometrial cancer cells by activating multiple signal-transduction pathways. Endocrine-Related Cancer 13: 629-640.[crossref]
- Xu WH, Xiang YB, Zhang X, Ruan Z, HuiCai, et al. (2014) Association of dietary glycemic index and glycemic load with endometrial cancer risk among Chinese women. Nutrition and Cancer67: 89-97.[crossref]
- Thangaraju S, Subramani E, Chakravarty B, Chaudhury K (2012) Therapeutic targeting of the TNF superfamily: A promising treatment for advanced endometrial adenocarcinoma. Gynecologic Oncology127: 426-432.
- Bajwa P, Nielsen S, Lombard JM, Rassam L, PravinNahar, et al. (2017) Overactive mTOR signaling leads to endometrial hyperplasia in aged women and mice. Oncotarget8: 7265-7275. [crossref]
- Subramaniam KS, Tham ST, Mohamed Z, Woo YL, Adenan NAM, et al. (2013) Cancer-associated fibroblasts promote proliferation of endometrial cancer cells. PloS One8: e68923. [crossref]
- Dossus L, Becker S, Rinaldi S, Lukanova A, Tjønneland A, et al. (2011) Tumor necrosis factor (TNF)‐α, soluble TNF receptors and endometrial cancer risk: The EPIC study.International Journal of Cancer129: 2032-2037. [crossref]
- Zhang Y, Zhang L, Sun H, Lv Q, Qui C, et al. (2017) Forkhead transcription factor 1 inhibits endometrial cancer cell proliferation via sterol regulatory element-binding protein 1. Oncology Letters13: 731-737. [crossref]
- Azvolinsky A (2016) The obesity–cancer link: A growing connection. Journal of the National Cancer Institute 108: djw243.
- Renehan AG, Egger M, Zwahlen M (2010) Body mass index and cancer risk: The evidence for causal association. The Open Obesity Journal2: 12-22.
- Krämer A, Green J, Pollard J, Tugendreich S (2014) Causal analysis approaches in Ingenuity Pathway Analysis. Bioinformatics30: 523-530.
- van Dam S, Cordeiro R, Craig T, van Dam J, Wood SH, et al. (2012) GeneFriends: An online co-expression analysis tool to identify novel gene targets for aging and complex diseases. BMC Genomics13: 535. [crossref]
- van Dam S, Craig T, de Magalhães JP (2015)GeneFriends: A human RNA-seq-based gene and transcript co-expression database. Nucleic Acids Research43: D1124-1132. [crossref]
- Bahado-Singh R (2017) U.S. Patent No. 0003291. Washington, DC: U.S. Patent and Trademark Office.
- Gagliardi PA, Puliafito A, Primo L (2018) PDK1: At the crossroad of cancer signaling pathways. Seminars in Cancer Biology48: 27-35. [crossref]
- Chakraborty A, Koldobskiy MA, Bello NT, Maxwell M, Potter JJ, et al. (2010) Inositol pyrophosphates inhibit Akt signaling, thereby regulating insulin sensitivity and weight gain. Cell 143: 897-910.[crossref]
- Miranda DN, Coletta DK, Mandarino LJ, Shaibi GQ (2014) Increases in insulin sensitivity among obese youth are associated with gene expression changes in whole blood. Obesity22: 1337-1342. [crossref]
- Joehlin-Price AS,Stephens JA, Zhang J, Backes FJ, Cohn DE, et al. (2016) Endometrial cancer insulin-like growth factor 1 receptor (IGFLR) expression increases with body mass index and is associated with pathologic extent and prognosis. Cancer Epidemiology, Biomarkers & Prevention25: 438-445.[crossref]
- Dai C, Li N, Song G, Yang Y, Ning X (2016) Insulin-like growth factor 1 regulates growth of endometrial carcinoma through PI3k signaling pathway in insulin-resistant type 2 diabetes. American Journal of Translational Research8: 3329-3336.[crossref]
- Yang X, Pratley RE, Tokraks S, Bogardus C, Permana P (2002) Microarray profiling of skeletal muscle tissues from equally obese, non-diabetic insulin-sensitive and insulin-resistant Pima Indians. Diabetologia45: 1584-1593. [crossref]
- Nicastri MC, RebeccaVW, AmaravadiRK, Winkler JD (2017) Dimericquinacrines as chemical tools to identify PPT1, a new regulator of autophagy in cancer cells. Molecular & Cellular Oncology5:e1395504. [crossref]
- Sutherland KD, Lindeman GJ, Choong DY, Wittlin S, Brentzell L, et al. (2004) Differential hypermethylation of SOCS genes in ovarian and breast carcinomas. Oncogene23: 7726‑7733.[crossref]
- Wunderlich CM, Hövelmeyer N, Wunderlich FT (2013) Mechanisms of chronic JAK-STAT3-SOCS3 signaling in obesity. JAK-STAT2: e23878. [crossref]
- Vassilev AO, Uckun FM (2004) Therapeutic potential of inhibiting Bruton’s tyrosine kinase, (BTK). Current Pharmaceutical Design10: 1757-1766. [crossref]
- Winer DA, Winer S, Shen L, Wadia PP, Yantha J, et al. (2011) B cells promote insulin resistance through modulation of T cells and production of pathogenic IgG antibodies. Nature Medicine17:610-617. [crossref]
- Kaistha BP, Honstein T, Müller V, Bielak S, Sauer M, et al. (2014) Key role of dual specificity kinase TTK in proliferation and survival of pancreatic cancer cells. British Journal of Cancer111: 1780-1787.[crossref]
- Liu XD, Yao DW, Xin F (2019) TTK contributes to tumor growth and metastasis of clear cell renal cell carcinoma by inducing cell proliferation and invasion. Neoplasma66: 946-953. [crossref]
- Lang F, Görlach A, Vallon V (2009) Targeting SGK1 in diabetes. Expert Opinion on Therapeutic Targets13: 1303-1311. [crossref]
- Liu W, Wang X, Wang Y, Dai Y, Xie Y, et al. (2018) SGK1 inhibition-induced autophagy impairs prostate cancer metastasis by reversing EMT. Journal of Experimental & Clinical Cancer Research37: 73. [crossref]
- Morikawa T, Kuchiba A, Liao X, Imamura Y, Yamauchi M, et al. (2012) Tumor TP53 expression status, body mass index and prognosis in colorectal cancer. International Journal of Cancer13: 1169-1178. [crossref]
- Ecke TH, Schlechte HH, Gunia S, Lenk SV, Loening SA (2008) Body mass index (BMI) and mutations of tumor suppressor gene p53 (TP53) in patients with urinary bladder cancer.Urologic Oncology26: 470-473. [crossref]
- Zhang W, Hietakangas V, Wee S, Lim SC, Gunarathe J, et al. (2013) ER stress potentiates insulin resistance through PERK-mediated FOXO phosphorylation. Genes & Development27: 441-449. [crossref]
- Arden KC (2006) Multiple roles of FOXO transcription factors in mammalian cells point to multiple roles in cancer. Experimental Gerontology 41: 709-717. [crossref]
- Golembesky AK, Gammon MD, North KE, Bensen JT, Schroeder JC, et al. (2008) Peroxisome proliferator-activated receptor-alpha (PPARA) genetic polymorphisms and breast cancer risk: A Long Island ancillary study. Carcinogenesis29: 1944-1949.[crossref]
- Drakaki A, Hatziapostolou M, Polytarchou C, Vorvis C, Poultsides GA, et al. (2015) Functional microRNA high throughput screening reveals miR-9 as a central regulator of liver oncogenesis by affecting the PPARA-CDH1 pathway. BMC Cancer15: 542. [crossref]
- Kafshdooz L, Tabrizi AD, Mohaddes SM, Kafshdooz T, Akbarzadeh A, et al. (2014) The polymorphism of hypoxia-inducible factor-1a gene in endometrial cancer. Asian Pacific Journal of Cancer Prevention15: 10393-10396. [crossref]
- Drareni K, Ballaire R, Barilla S, Mathew MJ, Toubal A, et al. (2018) GPS2 deficiency triggers maladaptive white adipose tissue expansion in obesity via HIF1A activation. Cell Reports24: 2957-2971. [crossref]
- Mishra S, Nyomba BG (2017) Prohibitin – At the crossroads of obesity-linked diabetes and cancer. Experimental Biology and Medicine242: 1170-1177. [crossref]
- Ross JA, Robles-Escajeda E, Oaxaca DM, Padilla DL, Kirken RA (2017) Theprohibitin protein complex promotes mitochondrial stabilization and cell survival in hematologic malignancies. Oncotarget8: 65445-65456. [crossref]
- Meng L, Liu B, Ji R, Jiang X, Yan X, et al. (2019) Targeting the BDNF/TrkB pathway for the treatment of tumors. Oncology Letters17: 2031-2039. [crossref]
- Sandrini L, Minno AD, Amadio P, Ieraci A, Tremoli E, et al. (2018) Association between obesity and circulating brain-derived neurotrophic factor (BDNF) levels: Systematic review of literature and meta-analysis. International Journal of Molecular Sciences19: 2281. [crossref]
- Khan BB, Flier JS (2000) Obesity and insulin resistance. Journal of Clinical Investigation106: 473-481. [crossref]
- Yang R, Barouch LA (2007) Leptin signaling and obesity:Cardiovascular consequences. Circulation Research101: 545-559. [crossref]
- Ye J (2013) Mechanisms of insulin resistance in obesity. Frontiers in Medicine7: 14-24. [crossref]
- Yoon M (2017) The role of mammalian target of rapamycin (mTOR) in insulin signaling. Nutrients9: 1176. [crossref]
- Mulholland HG, Murray LJ, Cardwell CR, Cantwell MM (2008) Dietary glycaemic index, glycaemic load and endometrial and ovarian cancer risk: A systematic review and meta-analysis. British Journal of Cancer 99: 434-441. [crossref]
- Nagle CM, Ibiebele TI, Webb PM (2013) Glycemic index, glycemic load and endometrial cancer risk: Results from the Australian National Endometrial Cancer study and an updated systematic review and meta-analysis. European Journal of Nutrition52: 705-715. [crossref]
- Brand-Miller JC, Holt SHA, Pawlak DB, McMillan J (2002) Glycemic index and obesity.The American Journal of Clinical Nutrition76: 281S-285S. [crossref]
- Bell SJ, Sears B (2003) Low-glycemic-load diets: Impact on obesity and chronic diseases. Critical Reviews in Food Science Nutrition 43: 357-377. [crossref]
- Chiu C, Taylor A (2011) Dietary hyperglycemia, glycemic index and metabolic retinal diseases. Progress in Retinal and Eye Research30: 18-53. [crossref]
- Sawin CT, Silbert CK, Mitchell ML (1975) The effect of glucose on the growth hormone response to glucagon and propranolol-glucagon in normal subjects. Metabolism24: 1009-1014. [crossref]
- McCarty M (1999) Vegan proteins may reduce risk of cancer, obesity, and cardiovascular disease by promoting increased glucagon activity. Medical Hypotheses53: 459-485.
- Pérez de Heredia F, Gómez-Martínez S, Marcos A (2012) Obesity, inflammation and the immune system. Proceedings of the Nutrition Society71: 332-338. [crossref]
- Lee H, Lee IS, Choue R (2013) Obesity, inflammation and diet. Pediatric Gastroenterology,Hepatology& Nutrition16: 143-152. [crossref]
- Trayhurn P, Wood IS (2004) Adipokines: inflammation and the pleiotropic role of white adipose tissue. British Journal of Nutrition92: 347-355. [crossref]
- Long J, Zhang CJ, Zhu N, Du K, Yin YF, et al. (2018) Lipid metabolism and carcinogenesis, cancer development. American Journal of Cancer Research8: 778-791.[crossref]
- Wei LJ, Zhang C, Zhang H, Wei X, Li SX, et al, (2016) A case-control study on the association between serum lipid level and the risk of breast cancer. Chinese Journal of Preventive Medicine50: 1091-1095.[crossref]
- Zhu YR, Aupperlee MD, Zhao Y, Tan YS, Kirk EL, et al. (2016) Pubertal and adult windows of susceptibility to a high animal fat diet in Trp53-null mammary tumorigenesis. Oncotarget7: 83409-83423. [crossref]
- Zhang J, Jia PP, Liu QL, Cong MH, Gao Y, et al. (2018) Low ketolytic enzyme levels in tumors predict ketogenic diet responses in cancer cell lines in vitro and in vivo. The Journal of Lipid Research59: 625-634. [crossref]
- Ebot EM, Gerke T, Labbé DP, Sinnot JA, Zadra G, et al. (2017) Gene expression profiling of prostate tissue identifies chromatin regulation as a potential link between obesity and lethal prostate cancer. Cancer123: 4130-4138. [crossref]
- Wang F, Liu H, Blanton WP, Belkina A, LeBrasseur NK, et al. (2009) Brd2 disruption in mice causes severe obesity without type 2 diabetes. Biochemical Journal425: 71-83. [crossref]
- Wang F, Deeney JT, Denis GV (2013) Brd2 gene disruption causes “metabolically healthy” obesity: epigenetic and chromatin-based mechanisms that uncouple obesity from type 2 diabetes. Vitamins and Hormones91: 49-75. [crossref]
- Li R, Grimm SA, Chrysovergis K, Kosak J,Wang X, et al. (2014) Obesity, rather than diet, drives epigenomics alterations in colonic epithelium resembling cancer progression. Cell Metabolism19: 702-711. [crossref]
- Rodríguez-Acebes S, Palacios N, Botella-Carretero JI, Olea N, Crespo L, et al. (2010) Gene expression profiling of subcutaneous adipose tissue in morbid obesity using a focused microarray: Distinct expression of cell-cycle- and differentiation-related genes. BMC Medical Genomics3: 61. [crossref]
- Baranova A,Collantes R, Gowder SJ, Elariny H, Schlauch K, et al. (2005) Obesity-related differential gene expression in the visceral adipose tissue. Obesity Surgery15: 758-765. [crossref]
- Williams GH, Stoeber K (2012) The cell cycle and cancer. Pathology226: 352-364. [crossref]
- Otto T, Sicinski P (2017) Cell cycle proteins as promising targets in cancer therapy. Nature Reviews. Cancer17: 93-115. [crossref]
- Shang Z, Kouznetsova VL, Tsigelny IF (2020) Human papillomavirus (HPV) viral proteins substitute for the impact of somatic mutations by affecting cancer-related genes: meta-analysis and perspectives. Journal of Infectiology 3(1): 29-47. [crossref]