DOI: 10.31038/AFS.2021334
Abstract
Since the early 1990s, rod catches of wild Atlantic salmon (Salmo salar L.) from the north-western (NW) Scottish Highlands have reportedly been in decline, whilst those elsewhere across Scotland have increased. This study separates catches of grilse (one winter at sea) and salmon (more than one winter at sea) recorded in official Scottish rod fishery statistics. Catches of salmon from the NW Highlands have declined overall since 1952 as have salmon returns across Scotland. Catches of grilse, however, were found to have increased both in the NW Highlands and across Scotland. These observations are in line with longer term cyclical trends identified from over two hundred years of net catch data from east coast rivers that also show grilse catches have increased since the 1960s. Analysis of the make-up of total NW Highland catches shows that the larger proportion of salmon caught masks important trends in these regional catches. Varying cycles of grilse and salmon catches highlight the importance of presenting both salmon morphs in evaluations of Scottish salmon and the dangers of relying on aggregated data that can hide important nuances that can have a bearing on management of Scotland’s wild salmon.
Keywords
Atlantic salmon, Catch data, Fisheries Management, Grilse, Salmo salar L.
Introduction
Numbers of salmon returning to Scottish rivers from their marine feeding grounds have fallen overall since at least 1971 [1]. This has led to widespread concerns about the poor state of wild salmon populations around Scotland [2]. These concerns have grown in recent years with [3-5] all showing total annual catches of Atlantic salmon have declined significantly in rivers in the NW Highlands. Recreational rod catch data recorded by Marine Scotland, however, hints at a more complex picture of Scottish salmon which appear to have been relatively stable overall between 1950 and 2010 (Figure 1).
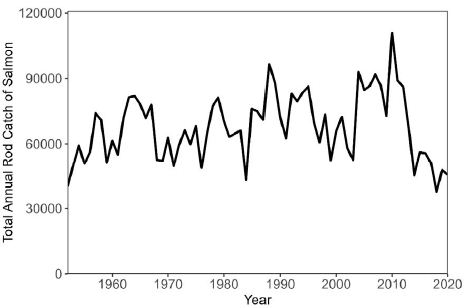
Figure 1: Scottish rod catch of Atlantic salmon (Salmo salar L.) 1952-2020 (from Anon 2021).
To better evaluate why reports of declining salmon returns seem to be contrary to recreational catch records it is important to first understand the life history of Atlantic salmon. These salmon exhibit a partially heritable polymorphism in which the morphs are distinguished by the duration of the sea phase of their lifecycle [6]. Commercial net fisheries have recorded catches of the two morphs: smaller grilse versus larger salmon over three hundred years. By aging salmon using scale growth ring measurements, [7] found that grilse were not simply stunted salmon but rather salmon that had spent just one winter at sea unlike the larger salmon that had spent at least two winters at sea [2].
Commercial net fisheries have identified that at times the number of grilse caught have dominated Atlantic salmon catches whilst, during other periods, salmon have outnumbered grilse [8-11]. These changes have occurred concurrently in several different rivers implicating multi-variate factors as possible causes to the different ratios returning to Scotland’s rivers. [8] found a positive correlation for returns of larger salmon with higher sea surface temperatures near Iceland and a negative correlation for grilse.
Despite different theories regarding how and why grilse versus salmon numbers fluctuate in Scotland – such as variation in marine growth rates [12], differences in inherited characteristics [13] and changing sea temperature [8] – relatively little investigative work has been conducted to evaluate the state of wild Atlantic salmon stocks using rod catch data, even though Marine Scotland Science (MSS) recognise that rod catch is the most accurate measure of Atlantic salmon stock for many Scottish rivers [14]. Since 1952, it has been a statutory requirement for riparian owners in Scotland to supply a record of all the salmon caught from their part of the river to the Scottish authorities. Catch time series recorded by MSS are therefore extensive, spanning 1952 to 2018, and are separated into grilse versus salmon, yet overall trends and consensus regarding Scottish salmon stocks are based on total catches that combine both morphs.
Using 66 years of recreational salmon rod catch statistics reported annually in Scotland, I investigate the patterns in salmon catches dividing catch numbers by grilse and salmon. The aim is to shed more detailed light on patterns in Scottish salmon abundance. I specifically focus on comparisons between the whole of Scotland versus fishery districts (named by river) in the NW Highlands that illustrate the importance of key insights into understanding the differences between the morph types in officially reported salmon statistics.
Materials and Methods
Data used herein comes from MSS annual salmon fishery statistics [15] – (Version used recorded catches to 2018).
Catch time series of salmon, grilse, and salmon and grilse combined were compared across 3 different geographic areas: the whole of Scotland, the NW Highlands (a combination of MSS fishery regions North West, West Coast and Outer Hebrides [16] and NW Highlands per river (Ewe, Gruinard, Awe, Moidart) (Table 1). Ordinary Least Squares (OLS) regression has been used as the standard analysis yet because annual recruitment and subsequent annual catch can be highly variable in fish stocks, 5-year moving averages are also useful to help avoid overweighting long-term trends based on exceptionally high or low years in the time series. I therefore use both analytical methods to look at the trends in salmon, grilse, and salmon combined with grilse across the different geographies for the entire times series available (1952 to 2018). OLS regressions of the five-year moving averages are included in the supplementary materials.
Table 1: Time series comparisons used to investigate trends in Scottish salmon rod catch data.
|
Salmon morph |
NW Highlands (total) |
Scotland (total) |
NW Highland per fishery district | |||
| Gruinard | Ewe | Moidart | Awe | |||
|
Salmon + Grilse |
S+G | S+G | S+G | S+G | S+G |
S+G |
| Salmon |
S |
S | S | S | S |
S |
| Grilse |
G |
G | G | G | G |
G |
To understand the contribution of large salmon in rod catches across Scotland, I also calculate the percentage of salmon in rod catches across the time series. All statistics from the analyses were run in R version 4.1.1 and are reported using adjusted R-squared values and P values with an alpha value of 0.05. All lines are plotted with shaded 95% confidence intervals.
Results
NW Highlands and Whole of Scotland Combined Data
Rod catches varied between 1952 and 2018 and show varied trends depending on the morph type and the region (NW Highlands versus whole of Scotland) (Figure 2). Catches of grilse and salmon combined from the NW Highland region overall show a significant, shallow decline across the entire times series (P = <0.01, R2 = 0.115). Catches of grilse and salmon combined for the same period for the whole of Scotland, however, show the reverse trend: a significant, positive trend over time (P < 0.01, R2 = 0.179). Catches of salmon only data from the NW Highland region overall show a significant, steep decrease across the entire times series (P = <0.001, R2 =0.457). Catches of salmon only data for the same period for the whole of Scotland, show a shallow, positive trend over time, although not significant (P = 0.079, R2 = 0.034). Catches of grilse only data from the NW Highland region show a significant, steep increase across the entire times series (P < 0.001, R2 =0.191). Catches of grilse only data for the same period, for the whole of Scotland, also show a significant, positive trend over time (P < 0.001, R2 = 0.68).
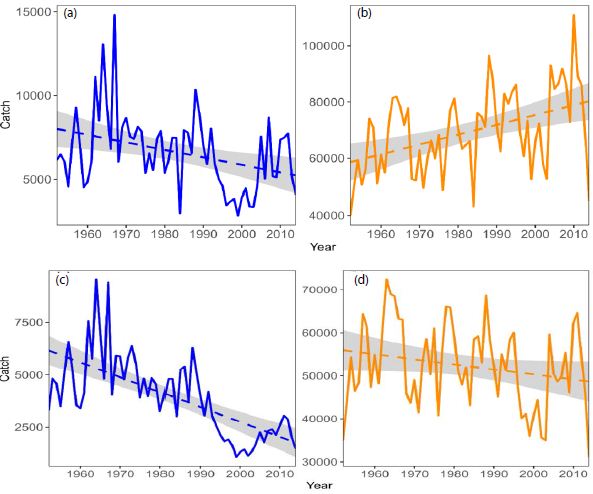
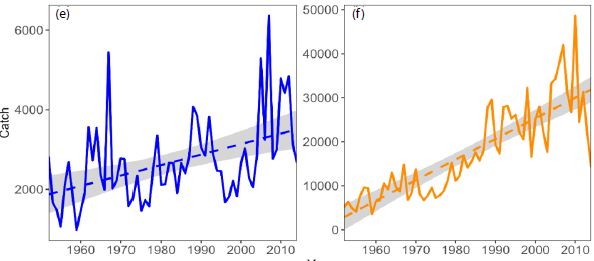
Figure 2: OLS regressions of salmon and grilse combined for the NW Highlands (blue lines) and whole of Scotland combined (orange lines) between 1952 and 2018 (a) (b) = salmon and grilse combined (c) (d) = salmon (e) (f) = grilse (source: Anon, 2021)
NW Highlands – Fishery-District-Specific Trends
Total salmon and grilse data (combined) for fishery districts in the NW Highlands show varied linear trends. The Gruinard showed a significant positive trend in salmon and grilse catches (P < 0.01, R2 = 0.189) (Figure 3a). The Ewe showed no significant trend in salmon and grilse catches (P = 0.178, R2 = 0.014) (Figure 3b). The Moidart and Awe showed significant negative trends in combined salmon and grilse catches (Moidart: P <0.01, R2 = 0.316 (Figure 3c), Awe: P<0.01, R2 = 0.316 (Figure 3d)).
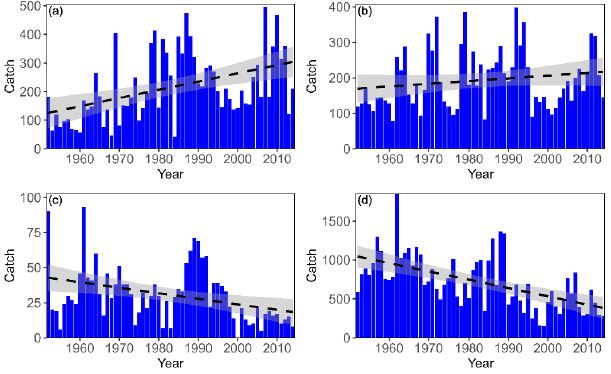
Figure 3: OLS regressions of combined salmon and grilse annual catch for the (a) Gruinard (b) Ewe (c) Moidart and (d) Awe fishery districts in the NW Highlands between 1952 and 2018 (source: Anon, 2021).
Salmon data for fishery districts in the NW Highlands show varied linear trends somewhat similar to those time series that combined salmon and grilse data. The Gruinard and Ewe showed no significant trends in salmon catches (Gruinard: P = 0.46, R2 = -0.007, Ewe: P = 0.734, R2 = -0.014) (Figure 4a and 4b).
The Moidart and Awe showed significant negative trends in salmon catches (Moidart: P <0.01, R2 = 0.451, Awe: P < 0.01, R2 = 0.097) (Figure 4c and 4d).
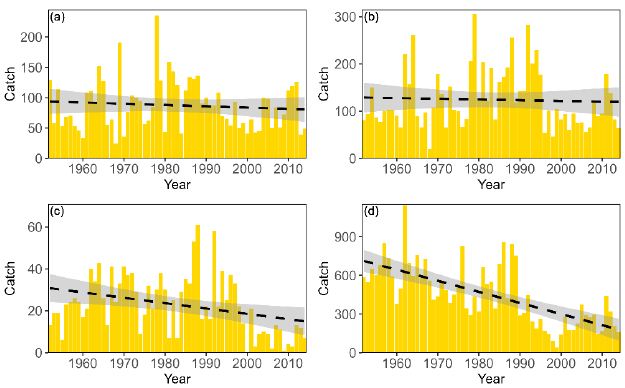
Figure 4: OLS regressions of salmon annual catch for the (a) Gruinard (b) Ewe (c) Moidart and (d) Awe fishery districts in the NW Highlands between 1952 and 2018 (source: Anon, 2021).
The Gruinard showed a significant positive trend in grilse catch (P < 0.01, R2 = 0.367) similar to the data for combined salmon and grilse (Figure 5a). The Ewe also showed a significant positive trend in grilse catch (P < 0.01, R2 = 0.102), unlike the combined salmon and grilse data (Figure 5b). The Moidart showed no significant trend in grilse catches (P = 0.227, R2 = 0.008) (Figure 5c) whilst grilse catches for the Awe fishery district showed a significant negative trend (P = 0.04, R2 = 0.052) (Figure 5d).
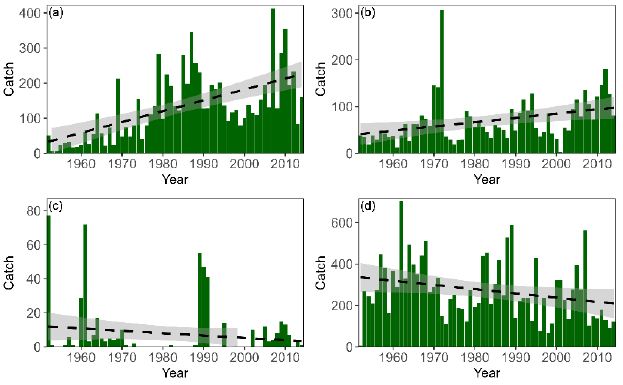
Figure 5: OLS regressions of grilse annual catch for the (a) Gruinard (b) Ewe (c) Moidart and (d) Awe fishery districts in the NW Highlands between 1952 and 2018 (source: Anon, 2021).
Calculating the percentage of large salmon in rod catches across all NW Highland rivers showed a significant negative trend over the time series (P < 0.001, R2 = 0.766) (Figure 6).
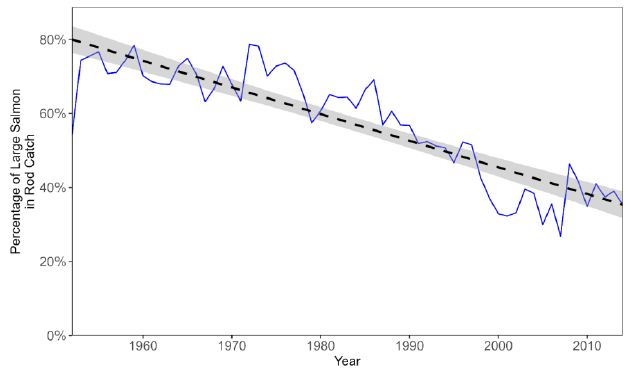
Figure 6: Percentage of large salmon in the rod catch from NW Highland rivers.
Discussion
Limitations of Methods and Data
The data presented herein is considered comprehensive regarding the length of the time series it represents and the fact that it is an officially reported data source by the Scottish government (MSS). However, a few limitations of the data must be highlighted for the sake of transparency.
The data herein is all based on catch data from recreational rod fishing. There is no fishing effort data to accompany this data. This has a bearing on being able to draw firm conclusions on the potential sustainability of the rod catches recorded. This, however, has little bearing on the interpretations I make below because my investigation is not one that primarily concerns the sustainability of recreational Scottish salmon fishing. Rather, the purpose is to illustrate the importance of considering the different morphs within the combined salmon data published by MSS.
In total there are 109 fishery districts in Scotland, of which 59 are located in the NW Highlands. The data presented herein has been selected for the 4 fishery districts that most clearly illustrate the importance of disaggregation of the Scottish salmon landings data into morph types. There is merit in running the same analyses on every river catchment in Scotland to attempt to quantify how ubiquitous the trends shown are throughout Scotland. However, such a large analysis, which would likely highlight that the trends in catch vary widely depending on the size of the river catchment, its location, and the amount it is fished, is beyond the scope of the present investigation.
The statistical power of running linear regressions to understand annual trends in catches is somewhat limited. It would be preferable to run the same analyses by using monthly data and look at cycles in salmon returns, although this would be difficult to discern from catch-only data. The choice to run OLS (annual) and 5-year averages somewhat addresses the issue of cyclical patterns hiding any trends, but a full investigation of cyclical versus linear trends is beyond the scope of this investigation.
Trends in Scottish Salmon
The simple analyses presented herein tell a clear story. There is a significant difference in catches between the different morphs, both in the NW Highland region and across Scotland as a whole.
Catches of Atlantic salmon by rod and line across all of Scotland have more than doubled from just under 40,000 in 1952 to a peak catch of 109,000 fish in 2010 [15]. By comparison, catches of Atlantic salmon from the rivers of the Scottish NW Highland region have declined from a peak of 14,000 fish to a low of under 3,000 [15]. However, catches from this region have shown sizeable variation with some catches in 1952 lower than in 2010 [15].
This variation may be due to changing fishing effort, but this has not been recorded by MSS. It could also be due to the differing geography of the NW Highlands compared to the rest of Scotland. Rivers of the region tend to be short spate rivers compared to the long meandering rivers found elsewhere. The longer rivers, especially of the east coast, have a much greater stock of fish than present in the NW Highlands. In some years, the catch of Atlantic salmon from the River Tweed exceeds that of the 59 NW Highland fishery districts combined. Typically, the catch from the NW Highland region accounts for less than 10% of the total Scottish catch [5].
Despite the considerable variation in catches and the overall small size of the salmon catch in the NW Highlands, various authors [3-5] have all shown that salmon catches have been in decline from the 1970s. The small size of the catches in the region mean that the differences between those years in which catches have increased versus decreased are minor and [17] demonstrated that catches did show a slight increase between 1952 and 1990.
Catches of salmon have declined in the NW Highlands and across all of Scotland, despite a continuous increase in national catches [15]. By comparison, catches of smaller grilse have increased both in the NW Highlands and throughout all of Scotland. There is no published research on the recent changes to grilse and salmon catches, however, the local statutory fishery boards have observed some changes in grilse catches in recent years. The Spey Fishery Board report that the official catch returns showed that the percentage of grilse caught by rod on the river increased with grilse forming 40% of the catch during the 1980s, and that by 1988, the grilse catch surpassed the salmon catch [18]. This supports the findings presented herein which show that although trends in salmon generally appear to show declines, this is certainly not always the case for grilse. In addition, salmon anglers anecdotally refer to some rivers of the NW Highlands as ‘grilse rivers’. For example, the Lochaber Fishery Trust describe the River Lochy as ‘predominantly a grilse river’, but there does not appear to be any peer-reviewed research to support this view.
[19] describe the net catch data from Scotland’s east coast fisheries as an ‘impressive’ set that shows parallel long-term trends in the proportion of grisle in several eastern Scottish rivers. Of these, the River Tweed has the longest time series [6]. The records show a common period of high grilse numbers between 1790 and 1840. This was followed by a period of low grilse catches from 1890 to 1940 after which grilse counts started to increase again. [20] compared grilse net counts from four east coast rivers including the River Tweed, the River Spey, the River Tay, and the River Don. These four rivers all showed similar patterns of increasing and decreasing grilse counts up until the 1990s. This indicates that cyclical patterns may be the cause of the more recent increasing trends seen in some NW Highland rivers compared to the larger salmon in the same rivers.
Analysis of the catch data for grilse, salmon, and grilse and salmon combined shows that the presentation of combined salmon and grilse catches hides important differences between salmon and grilse, when they are considered separately. Analysis of the make-up of the grilse and salmon components of the catch shows that larger salmon dominated NW Highland catches until about 1990, even though they were in decline. This decline masked the increased catches of grilse, which would eventually dominate the total catch between 1990 and 2010. The observed overall decline in salmon reflected the decline in large salmon catches that has occurred across all of Scotland. At the same time, grilse catches have increased in the NW Highlands but not enough to show a noticeable increase in the total catch when grilse and salmon data are considered together.
It is apparent that more detailed analysis and presentation of Scottish salmon catch data is required to ascertain the true underlying trends of salmon catches in Scottish rivers. This is important because salmon catch data is often used as an indication of the state of local and national stocks [14]. Without presenting the full picture, which in this case is a presentation of both grilse and salmon data separately, it is difficult to expect regional management and riparian owners to be able to respond appropriately to changes in salmon catches to help ensure the long-term conservation of stocks.
References
- ICES (2021) Working Group on North Atlantic Salmon (WGNAS) ICES Scientific Reports 2: 358.
- Bacon PJ, Palmer SCF, MacLean JC, Smith GW, Whyte BDM, et (2009) Empirical analyses of the length, weight, and condition of adult Atlantic salmon on return to the Scottish coast between 1963 and 2006. ICES Journal of Marine Science 66: 844-859.
- Ford JS, Myers RA (2008) A global assessment of salmon aquaculture impacts on wild salmonids. PLoS Biol 6: 33.
- Vøllestad LA, Hirst D, L’Abée-Lund JH, Armstrong JD, MacLean JC, et al. (2009) Divergent trends in anadromous salmonid populations in Norwegian and Scottish rivers. Proceedings of the Royal Society 276: 1021-1027.
- Middlemas SJ, Smith GW, Armstrong JD (2016) Using catch data to examine the potential impact of aquaculture on salmon and seat trout 4.
- Gurney WSC, Bacon PJ, Speirs DC, McGinnity P, Verspoor E (2012) Sea-age variation in maiden Atlantic salmon spawners: phenotypic plasticity or genetic polymorphism? Bulletin of Mathematical Biology 74: 615-640. [crossref]
- Calderwood WL (1907) The Life of the Salmon with Reference More Especially to the Fish in Edward Arnold Publishing, London. 574.
- Martin JHA, Mitchell KA (1985) Influence of sea temperature upon the number of grilse and multi-sea winter Atlantic salmon caught in the vicinity of the River Dee. Canadian Journal of Fisheries and Aquatic Sciences 42: 1513-1521.
- Mills DH (1989) Ecology and Management of Atlantic Salmon London Chapman Hall 351.
- Shearer WM (1986) An evaluation of the data available to assess Scottish salmon stocks. In: The Status of the Atlantic salmon in Scotland-Institute of Terrestrial Ecology Symposium 1: 91-111.
- Turrell WR, Shelton RGJ (1993) Climatic change in the north-eastern Atlantic and its impacts on salmon stocks. In D H Mills (ed) Salmon in the Sea and New Enhancement Strategies Oxford Fishing News Books 40-78.
- Saunders RL, Henderson EB, Glebe DB, Loudenslager EJ (1983) Evidence of a major environmental component in the determination of the grilse: larger salmon rates in Atlantic salmon (Salmon salar) Aquaculture 107-118.
- Gardner MLG (1976) A review of factors which may influence the sea-age and maturation of Atlantic salmon (Salmo salar ). Journal of Fish Biology 9: 289-327.
- Anon (2015a) Status of Scottish salmon and sea trout Marine Scotland Science Report 01/15
- Anon (2021) Salmon Fisheries Statistics Marine Scotland Science Topic Sheet no 68.
- Anon (2015b) Collecting the Marine Scotland salmon and sea trout fishery statistics. Marine Scotland Science Topic Sheet 67.
- Walker AF (1994) Sea trout and salmon stocks in the Western In Problems with sea trout and salmon in Western Highlands. Atlantic Salmon Trust. Pitlochry 6-18.
- Spey Fishery Board (2021) Salmon Information.
- Hindar KC, Garcia de Leaniz, Koljonen ML, Tufto J, Youngson AF (2007) Fisheries Exploitation in The Atlantic Salmon, Genetics, Conservation and Eds. Verspoor E, Stradmeyer L, Nielsen L. Blackwell Publishing 299-324.
- Summers DW (1995) Long-term changes in the sea-age at maturity and seasonal time of return of salmon Salmo salar to Scottish Rivers. Fisheries Management & Ecology 2: 147-156.