Abstract
Besides a pseudo-secondary solvus curve (water vs. temperature), we show in this contribution an unusual enrichment of sulfate in melt inclusion in quartz from an aplite vein in the Lusatian granodiorite. Sulfate is Lorentzian distributed. Together with the solvus curve and this type of element distribution, we interpret these as a result of the interaction of supercritical fluids coming from mantle deeps with more crustal rocks.
Keywords
Sulfate-rich melt inclusions, Supercritical fluids, Lorentzian sulfate distribution, Raman spectroscopy
Introduction
The analyses of melt inclusions in quartz give necessary hints to the formation of magmatic mineralizations. Information on the temperature and the composition of the melt belong to this data. A significant result is the bulk-water concentration of the melt inclusions. Temperature and water concentrations often form a pseudo-binary solvus curve with a critical point. Such curves clearly show that the melt inclusions conserve a complex history of formation. In addition, some elements show a direct correlation to the solvus. Some elements form a Gaussian or Lorentzian distribution and
demonstrate, together with the occurrence of indicator minerals (diamond and others), their origin from mantle regions [1,2] as supercritical fluid. Some years ago, the first author found quartz crystals in an aplite vein in the granodiorite from Oppach in the Lusatian mountainous country with extreme sulfate-rich melt inclusions. These results are mentioned only in passing because, at that time, a clear interpretation was not possible. Here, we give primary sulfate results.
Sample Material
For the study, we used quartz crystals from a 1 m thick, strongly weathered aplite vein in an abandoned granodiorite quarry on the boundary of village lands between Oppach and Neusalza-Spremberg (Andert, 1936) [3]. The vein has an incline of 85° to north and a strike of 20° east. Figure 1 shows a quartz-dominated vein part with only tiny specularite (hematite) crystal aggregates. The quartz indicates strong corrosion signs.
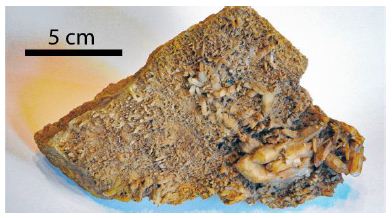
Figure 1: Vein quartz specimen from the aplite vein from Oppach/Lusatia
In the center of the aplite vein, there are miarolitic cavities filled with quartz crystals embedded in black mica-like specularite crystals. Figure 2 shows samples of cleaned water-clear quartz crystal and untreated quartz-specularite samples.
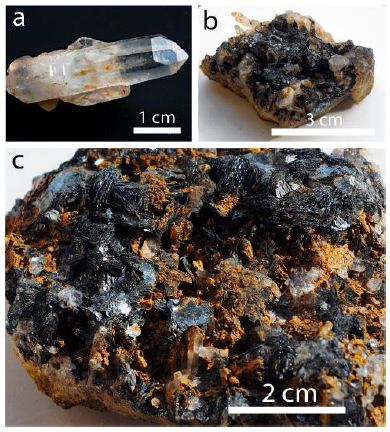
Figure 2: Cleaned quartz crystal (a), specularite, and quartz (b and c). The quartz, mostly in (c), shows a brown covering of Fe-hydroxides.
The quartz of the untreated samples generally has a limonite cover. The quartz contains innumerable fluid and melt inclusions, as well as a lot of different mineral inclusions, like graphite, specularite, albite, rubicline, orthoclase, anhydrite, barite, calcite, dolomite, siderite, smithsonite, bastnäsite-(Ce), xenotime-(Y) and deep-blue monazite-(Ce), as well as hingganite-(Y) [Y, Yb, Er)BeSiO4(OH)] [4]. Figure 3 gives details of the specularite-quartz intergrow (quartz – bright, specularite – black). Such types of specularite veins or miarolitic cavities are in the Lusatian mountainous county widespread [5]. Figure 4 shows some mineral inclusion (siderite and specularite (Hem) in a quartz crystal, and Figure 5 is a BSE image of hingganite-(Y) distributed in the quartz (often at or near the surface, however also in the whole volume). Generally, the fluid inclusions are of secondary origin. That fluid inclusion homogenizes at 256 ± 15°C (n=20) into the liquid phase. In this contribution, we concentrate on the melt inclusions in quartz.
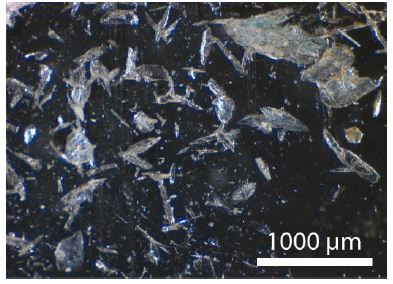
Figure 3: Quartz-specularite intergrowth
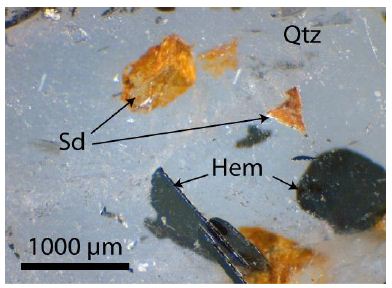
Figure 4: Quartz (Qtz) with mineral inclusions: Sd: Siederite, Hem: Specularite
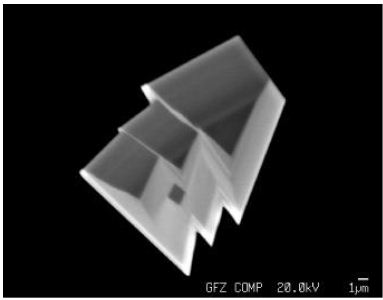
Figure 5: REE-rich Be silicate hingganite-(Y) crystals in quartz from the aplite vein from Oppach/Lusatia.
Figure 3 shows the intense intergrowth of light quartz and black specularite. Maybe the primary quartz was replaced partially by the specularite.
Methodology
Microscopy
For the microscopic and Raman spectroscopic studies, we generally used on both sides polished quartz chips about 300 to 500 µm thick. For both transmission and reflection studies, we used the JENALAB pol and the Olympus BX43 microscopes.
Homogenization Measurements: Cold-Seal Pressure Vessel Homogenization Experiments
Generally, the melt inclusions in quartz are in a wholly crystallized state with a more or less large vapor bubble. Therefore, it was necessary to re-homogenize the inclusions to a homogeneous, daughter crystal-free glass for electron microprobe and Raman spectroscopic studies. We used the conventional horizontal cold-seal pressure vessel technique in GeoForschungsZentrum (GFZ) Potsdam (the procedure is described by Thomas et al. 2000) [6,7]. Here, quartz chips came into an open Au capsule (30 mm long, 5 mm diameter). The vessel was pressurized with CO2 to 1, 2, or 3 kbar, and the sample was moved into the preheated furnace (500, 550, 600, 650, and 700°C respectively). The run time was generally 20 hours. After the experiments, the Au capsule was removed from the furnace and quenched isobarically with compressed air. After quenching, the samples were re-polished and mounted on glass disks to determine the water content of the glass by confocal micro-Raman spectroscopy. It is essential here that by the technique used and the high water content, the primary homogeneous water-rich glass is not stable and disintegrates into a homogeneous water-bearing glass (readily determinable with the Raman spectroscopy [8,9]. The free water phase in the inclusion is determined volumetrically. For this, we used generally well-formed melt inclusions – see Figure 6. The experimental run number could minimized in that way, that in each gold capsule, came up to 10 different samples, which are easily distinguished (thickness, one-sided or on both sides polished chips, or by a specific form). It is also crucial that in the experiments performed at higher temperatures, all inclusions trapped during crystal growth at lower temperatures are also homogenized and can used by interpolation. For special studies, the hydrothermal rapid-quench homogenization experiments with a significantly faster quenching rate showed [6,7,10,13] that by this technique, the whole volume of the inclusion shows under the microscope a homogeneous, however, metastable glass.
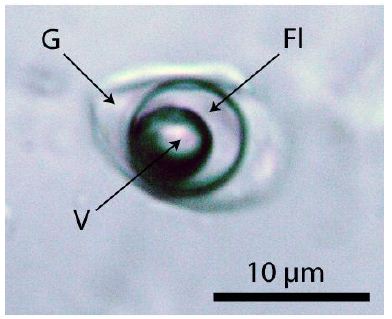
Figure 6: Typical re-homogenized, near-critical (700°C, 3 kb, 20 hours) melt inclusion in quartz from Oppach/Lusatia. Fl – fluid phase, containing high concentrations of sulfate, G – silicate glass, V – vapor phase.
Raman Spectroscopy
For the Raman spectroscopy performed at the GFZ Potsdam, we used a Jobin-Yvon LabRam HR800 spectrometer (grating: 2400 gr/mm) equipped with an Olympus optical microscope and a long-working-distance LMPlanFl 100x/0.80 objective. Generally, we used a 488 nm excitation of a Coherent Ar+ laser Model Innova 70C, a power of 45 mW on the sample, at a resolution ≤ 0.6 cm-1. Each unpolarized spectrum represents an accumulation of six acquisitions of 20 seconds each. We collected the Raman spectra at a constant laboratory temperature of 20°C with a Peltier-cooled CCD detector [10].
Sulfate Determination
From fluid inclusion studies, we know that some inclusion solutions contain high concentrations of SO42-, as indicated by Raman spectroscopy and the strong band at 983 cm-1. The fluid phase of the re-homogenized melt inclusions generally shows a high to very high Raman band for sulfate, too. An assignment to cations is not possible in a simple way. Therefore, we have concentrated on the determination or estimation of the sulfate concentration. In 2012, Thomas and Davidson [9] constructed a calibration curve (unpublished) for the sulfate determination shown in Figure 7.
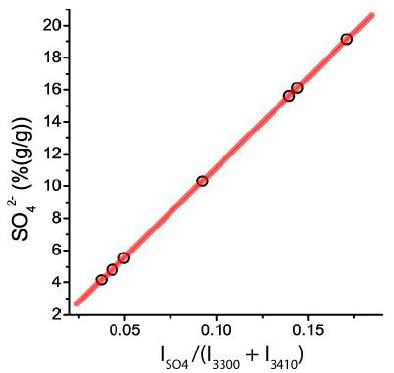
Figure 7: Calibration curve for the determination of sulfate in the liquid phase of the re-homogenized melt inclusion. ISO4 is the intensity of the sulfate Raman band at about 983 cm-1. I3300 and I3410 are the intensities of both sub-Gaussian bands for water (OH stretching bands of water) in the range of 2800 to 3800 cm-1.
Zhu et al. [13] have, in the meantime, developed and published the method of sulfate determination in detail. They also used the integral intensity of the OH-stretching vibrations as an internal standard (see Figure 6a-c in Thomas and Davidson, 2012) [12]. The analog procedure is applicable to the determination of carbonate and bicarbonate [12], too.
Results
Our study first followed the idea that many inclusions form a solvus curve. Figure 8 shows the resulting pseudo-binary solvus curve in the coordinates water content [H2O (%(g/g))] of the melt inclusions versus the re-homogenization temperatures.
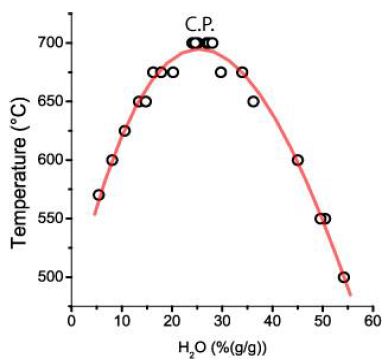
Figure 8: Solvus curve for melt inclusions in quartz crystals from Oppach/Lusatia. C.P.: Critical Point. Each point is the mean of up to ten different melt inclusions.
In Thomas and Rericha (2023 and 2024) [1,2], we have discussed forming a pseudo-binary solvus with a critical point (C.P.) combined with extreme element enrichment in the form of Lorentzian distribution of elements (look at Figure 2b in Thomas and Rericha, 2024) [2] is a strong argument for the influence of supercritical fluids coming from mantle deeps to the crustal mineralization. Therefore, we have analyzed the re-homogenized melt inclusions for different elements. To our surprise, the inclusions contain, besides moderate carbonate concentrations (3.5 ± 0.7% CO32-), high concentrations of sulfate (SO42-), which are Lorentzian distributed (Figure 9). Noteworthy is that the fluid phase of the melt inclusion is homogeneous and contains no daughter crystals at room temperature (20°C). That is also true for the second distribution.
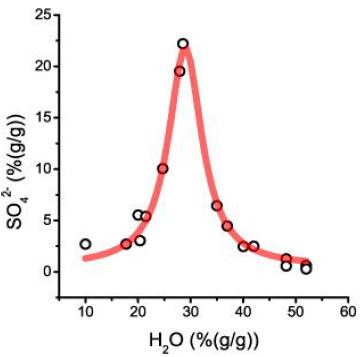
Figure 9: First Lorentzian curve of the sulfate distribution versus water concentration
The offset (0.45% SO42-) corresponds to twice the Clarke for granitic rocks. 21.3% sulfate at the center (29% H2O) is for an aplitic rock exceptionally high. A further careful study yields a second, more complex Lorentzian curve with significantly lower sulfate concentrations (Figure 10). This curve shows two Lorentzian components, which may have been generated by different species or different amounts of water in the corresponding compound (Table 1).
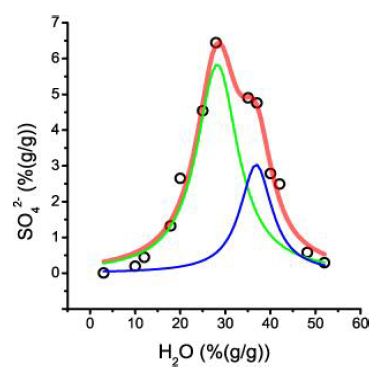
Figure 10: This figure shows the analytical sulfate determination in melt inclusion in quartz from Oppach/Lusatia. Each point is the mean of sulfate of up to ten different inclusions. The bulk curve is composed of two different Lorentzian components.
Table 1: Results of the Lorentzian fit of sulfate vs. water. R2=0.986 (Figure 9)
|
Peak |
Area | Center (%H2O) | Width (%H2O) | Offset (%SO42-) |
Height (%SO42-) |
|
Red |
260 | 29.0 | 7.8 | 0.45 |
21.3 |
Table 2 contains the characteristic data for this Lorentzian curve. Obviously, two different species are forming two distinct curves, which can be traced back to different H2O numbers as the most straightforward explanation.
Table 2: Results of the Lorentzian fit of sulfate vs. water. R2=0.98. The Y offset (SO42-)=0
|
Peak |
Area | Center (%H2O) | Width (%H2O) |
Height (%SO42-) |
|
1 (green) |
102.4 |
28.2 | 11.2 | 5.8 |
| 2 (blue) | 40.9 | 36.8 | 8.6 |
3.0 |
Discussion
The determined sulfate concentration in melt inclusions in quartz from Oppach is exceptionally high for a magmatic granite-aplite system. Because the water solution contains no daughter phase, the solubility of sulfates must be very high. Alkali, beryllium, and iron sulfates are the first candidates. Naumov et al. (2008) [14] described high sulfate concentrations in melt inclusions in chrome diopside from Yakutia/Russia. The situation there seems different because the sulfate concentration of the melt from which the chrome diopside crystallized is significantly lower than in the case of Oppach. In Thomas et al., 2016 [11] a similar high sulfate concentration in fluid and melt inclusions in the Melaune granite is described. There, in some fluid inclusions, the sulfate concentration is 12.2 ± 1.8 (%(g/g)). In Table 3 are put together the solubility of some sulfates at 20°Cs [15,16].
Table 3: Solubility of some sulfates and the corresponding sulfate concentration in the melt inclusion solution at 20°C
|
Compound |
Solubility at 20°C (%(g/g)) |
Sulfate concentration (%(g/g)) |
| BeSO4 · 4 H2O |
28.0 |
15.2 |
| CaSO4 · 2 H2O |
0.202 |
0.12 |
| FeSO4 · 7 H2O |
20.8 |
7.19 |
| K2SO4 |
10.0 |
5.51 |
| Na2SO4 · 7 H2O |
21.3 |
8.12 |
We see that at the critical point of the first Lorentzian curve, the sulfate concentration (21.3%) is so high that besides FeSO4, a lot of other sulfates must be present in the supercritical solution. The mineral inclusions in quartz demonstrate that the supercritical fluid contains, besides H2O, sulfates, carbonates, phosphates, Na, K, Be, Ca, Fe, REE, and others. The dominance of specularite in this paragenesis shows that the following simplified reaction for Fe is responsible for the change of the supercritical state to the under-critical/hydrothermal state – the change from iron(II)- to iron(III)-sulfate, and crystallization of specularite:
Fe2(SO4)3 + 3 H2O=Fe2O3↓ + 3 H2SO4 (1)
The formal formation of sulphuric acid is responsible for the dissolving of macroscopic carbonates (calcite, siderite) and the strong corrosion of the quartz-albite rock. In Electronic supplementary material by Thomas and Davidson (2017) [16], it is demonstrated that of the high sulfate concentration in the melt-fluid system, the behavior of the REE in comparison to granitic systems is very different.
Acknowledgment
The author thanks Christian Hermann for new samples from the Oppach locality, which initiated the present paper. Furthermore, thanks go to Prof. Pei Ni (Nanjing/China) for recalling the sulfate determination method, which goes back to 2006.
References
- Thomas R, Rericha A (2023) The function of supercritical fluids for the solvus formation and enrichment of critical elements. Geol Earth Mar Sci 5: 1-4.
- Thomas R, Rericha A (2024) Meaning of supercritical fluids in pegmatite formation and critical-element redistribution. Geol Earth Mar Sci 6: 1-5.
- Andert H (1936) Wie entstand die Oppacher Landschaft? Grenzland Oberlausitz. Oberlausitzer Heimatzeitung 17: 91-94.
- Thomas R, Davidson P (2017) Hingganite-(Y) from a small aplite vein in granodiorite from Oppach, Lusatian Mts., E-Germany. Mineralogy and Petrology 111: 821-826.
- Lange W, Tischendorf G, Krause U (2004) Minerale der Oberlausitz. Verlag Gunter Oettel
- Thomas R (2000) Determination of water contents of granite melt inclusions by confocal laser Raman microprobe spectroscopy. Am Mineral 85: 868-872.
- Thomas R, Webster JD, Heinrich W (2000) Melt inclusions in pegmatite quartz: complete miscibility between silicate melts and hydrous fluids at low pressure. Contrib Mineral Petrol 139: 394-401.
- Thomas R, Kamenetsky VS, Davidson P (2006) Laser Raman spectroscopic measurements of water in unexposed glass inclusions. American Mineralogist 91: 467-470.
- Thomas R, Davidson P (2006) Progress in the determination of water in glasses and melt inclusions with Raman spectroscopy: a short review. Z Geol Wiss Berlin 34: 159-163.
- Thomas R, Davidson P, Rhede D, Leh M (2009) The miarolitic pegmatites from the Königshain: a contribution to understanding the genesis of pegmatites. Contributions to Mineralogy and Petrology 157: 505-523.
- Thomas R, Davidson P (2016) Origin of miarolitic pegmatites in the Königshain granite/Lusatia. Lithos 260: 225-241
- Thomas R, Davidson P (2012) The application of Raman spectroscopy in the study of fluid and melt inclusions. Z dt Ges Geowiss 163/2: 113-126.
- Zhu D, Zhu Z, Pan J, Ding J, Ni P (2015) Raman micro-spectroscopic study of sulfate ion in the system Na2SO4 – H2 Acta Geologica Sinica 89: 887-893.
- Naumov VB, Kamenetsky VS, Thomas R, Kononkova NN, Ryzhenko BN (2008) Inclusions of silicate and sulfate melts in chrome diopside from the Inagli deposit, Yakutia, Russia. Geochemistry International 46: 554-564
- Nývlt J (1977) Solid-liquid phase equilibria. Elsevier, Amsterdam, 248.
- Thomas R, Davidson P (2017) Hingganite-(Y) from a small aplite vein in granodiorite from Oppach, Lusatian Mts., E-Germany. Mineralogy and Petrology 111: 821-826.