Abstract
Background: Events reported to the Datix database involve a wide range of contexts and processes. Common themes and underlying systemic factors underlying factors. We present the use of a machine learning approach and algorithm called Top2Vec to capture the linguistic meanings and semantics contributing to multiple events are typically identified by individuals responsible for reviewing each such event. This is prone to missing genuine within numeric sequences called word or document embeddings. These document embeddings can be aggregated into clusters representing particular themes, which we represent as wordclouds.
Method: 2112 Datix reports from Critical Care in Dudley Group Hospitals NHS Foundation Trust were imported into a Python 3.9.12 Pandas dataframe. Incident descriptions were processed through the Top2Vec algorithm. Each document was represented by a 300 long numeric vector. Regions of local density and clusters of documents were identified within Top2Vec by Hierarchical Density-Based Spatial Clustering (HDBSC). The centres of these clusters are represented by a group of words with potentially common meanings, revealing the underlying topic.
Results: The wordcloud representations of the following topics were subjectively equated to: Pressure sores, patient aggressive behaviour, Drug prescription and administration, Isolation for loose stool, Nurse staffing capacity, Single sex breach, Safeguarding and vulnerable patients, Missed enoxaparin, Bed capacity, Blood product collection, Patient facial pressure sores, Blood product wastage.
Conclusion: The common words within the wordclouds suggests that Top2Vec is capturing words sharing meanings within the embeddings. We propose that this is an efficient method to analyse large datasets of text and reveal deep themes contributing to many single events.
Keywords
Top2Vec, Datix reports, Critical care, HDBSCAN, Clustering, dimensionality reduction, t-SNE, Topic extraction, Natural language processing
Introduction
The National Health Service (NHS) strives to improve and ensure patient safety is always maintained. The Patient Safety Incident Response Framework (PSIRF) was introduced in August 2022 as part of the NHS patient safety strategy to continuously improve and optimise patient safety. It encourages the reporting of incidents that did or could have resulted in harm to patients, staff, visitors, a member of the public or the Trust. These incidents can vary in severity from no harm done, near miss, serious incidents and never events. The intention of incident reporting is to ensure the environment is safe for everyone, reducing future risk and to raise awareness when things go wrong. It also promotes learning from these incidents as well as ensuring resources are appropriately allocated to deliver improvement. By reporting incidents, it allows managers and staff to recognise and keep an accurate record of incidents so that appropriate action can be taken. Datix is a software system used for incident reporting or more commonly known as a Trust’s electronic incident reporting system. It is widely used across the NHS to record and capture relevant details of the incident reported digitally. It allows a more structured and systematic manner in recording the incidents reported. Subsequently, responsible managers can review and provide feedback based on the incidents logged, thus encouraging lessons to be learnt from them with the aim of minimising recurrence and improving safety. As these incidents are stored digitally, it also allows the individual Trust to collate and analyse the data to identify any wider issues that may contribute to these incidents.
In an effort to facilitate these clinical governance processes, which potentially has thousands of these reports per year, we have used natural language processing to automate the identification of important themes. Natural language processing is the field that brings together computer science and linguistics, whereby free text (as opposed to a formal language, e.g. programming) is processed algorithmically to derive meaning. Potential uses of this technology includes:
Automated ICD-10 coding based on free text entries into electronic health records [1-6];
- Analysis of social media data to see how people view concepts of causality, e.g. stress causing headaches [5];
- Identification of potential candidates for recruitment to critical care trials [7-10];
- Extraction of key features from radiological reports [4];
- Emergency department triage [11];
- Identification of potential adverse drug events [12-15]
A key concept to the processing of natural language computationally is the distributional hypothesis, originally proposed in 1954 [7]. This suggests that language can be described based on the co-occurence of its parts relative to others, i.e. their context. Consider that we have no concept of the word “Tazocin” and we encounter the following statements:
- Tazocin dose given to wrong patient
- Septic patient prescribed Tazocin later than one hour
- Tazocin given outside of antimicrobial guidelines
Based on the words it is close to, we could infer that this is something that has a dose, is given to patients, is something that is supposed to be given to a septic patient within an hour and that it is somehow within an antimicrobial guideline, i.e. is presumably an antimicrobial.
We could also undertake an analysis of a corpus of text and look at not only the semantic relationships between individual words, but between paragraphs and entire documents. Such clusters of semantic relationships between paragraphs and documents are best thought of as topics.
Artificial Neural Networks
The mathematics for the specific network used here and its fitting is outside the scope of this paper, but essentially training the model follows this process: (1) training cases are presented as an input and what the desired outputs are, (2) the difference between what the current model predicts and the actual output is calculated, (3) the model parameters are fractionally adjusted to compensate, (4) the process is repeated with other cases until the overall error is adequately minimised.
Doc2Vec
The first step in the process of analysing free text clinical incident reports computationally is to convert the text into a numerical representation that can then be fed into further algorithms. The first step in this process is to numerically represent each word. One way of doing this would be creating an array of numbers where {1, 0, 0} represents the first word in the dictionary (e.g. aardvark), {0, 1, 0} represents the second word in the dictionary and so forth. This provides no information about the context in which the word is found. We therefore train a model to create an internal representation of each of our words known as an embedding, which is a 1-dimensional list of numbers. If we decided that we would like to represent meaning with 100 numbers, then with only 3 words in our dictionary our end result would be a table of 100×3 numbers representing our dictionary and some way in which to represent them. As per the distributional hypothesis, the starting presumption is that the meaning of a word can somehow be derived from the words used around it. Therefore, the training set for this model is derived by passing each word in turn and the words surrounding it. This is then fed into an artificial neural network, which importantly has the embedding as an explicit part of the model. This overall process forms the basis of word2vec [1]. This model has been further refined to give doc2vec [2], which accounts for the explicit structure of paragraphs themselves and some optional changes to the neural network architecture, namely instead of training with the central word as an input and the context words as outputs, the opposite is true. The output from these models can be used to gain understanding of semantic similarity between words. For example, we could request that a 3 value embedding is generated for a document by word2vec and the first of these values happens to be high for pronouns and the second value of these is higher for the names of different animals. Looking at just the numbers would therefore give us an indication that these words are related to each other, without us needing to provide any supervised input about the language itself. This concept has been taken further and made more explicit in the form of top2vec, which works on the presumption that the output from these models is a continuous representation of topics [3]. Various dimensionality reduction algorithms may then be applied to find highly clustered regions of important topics. The resulting embedding of each word in and of itself is arbitrary, but interestingly has some emergent properties when taken relative to other words. For example, given the pairing of the words “man-woman” and “king-queen”, there is orthogonality such that numerically the difference between “man” and “king” is comparable to “woman” and “queen” (Figure 1).
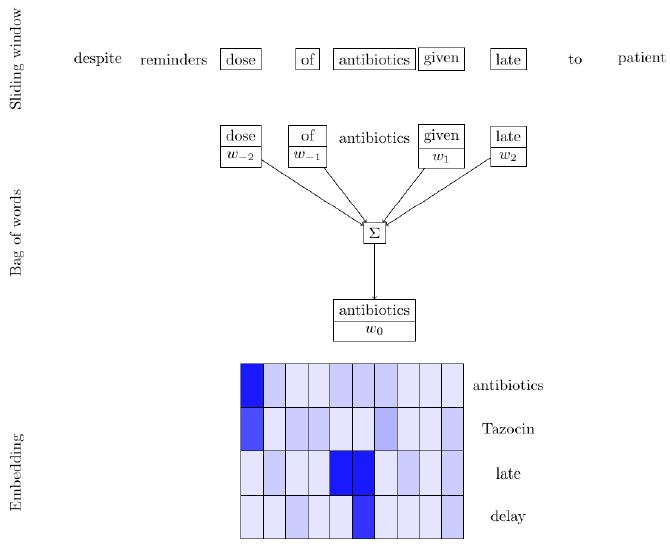
Figure 1: Illustration of the word2vec process. Each word in a document is presented as a training case to the neural network as both an input and an output. In addition to this as an input, the words immediately surrounding it are also provided to give contextual information. An integral part of the hidden layer in this neural network contains an embedding, which is an arbitrary length set of numbers that will (once trained) represent each word semantically.
HDBSCAN
HBDSCAN stands for Hierarchical Density-Based Spatial Clustering of Applications with Noise. It is a clustering algorithm devised by Campello, Moulavi, and Sander.* HBDSCAN groups a dataset by a process of density-based clustering which can be split into 3 stages; density estimation, choosing areas of high density and then merging of the points in the identified regions. To estimate the density around a certain point, a core distance will be used. This is the distance of a particular point from its neighbours, with points in more dense regions having smaller core distances. Given the core distances, the inverse of this can form an estimate of the density. A contour map of estimated densities could then be generated, looking much like a mountainous landscape. DBSCAN uses a simple threshold core distance for its’ clustering. Hence anything above the threshold being a mountain (or cluster) and everything below being considered noise. For this to work effectively and give meaningful clusters, the proper threshold needs to be chosen. If the threshold is set too high, data points may be incorrectly classified as noise and not included in the clustering; this is known as under grouping. If it is set too low all the data points join one large cluster. With DBSCAN and using a global threshold the algorithm will generate a smaller number of clusters than truly exist when the clusters have variable densities. It is highly improbable that there would be an even distribution of topics within the included Datix reports. Therefore, a more nuanced approach to clustering was required. HDBSCAN builds upon the DBSCAN method and instead of using a standardised cut off level, it allows the cut off to be of varying height, depending on when data points are lost from the cluster. This means that the most stable or persistent clusters remain. In simple terms it considers whether each cluster should be kept as one or split into sub clusters ie it is this just one mountain with multiple peaks or multiple separate mountains?
t-SNE
T-SNE or t-distributed Stochastic Neighbour Embedding is a dimensionality reduction algorithm that was developed by Laurens van der Maarten and Geoffrey Hinton in 2008. This algorithm allows for a human interpretation of data that wouldn’t otherwise be possible when data is in a high dimensional space. Its’ main advantage is that it is able to reduce the dimensionality of data whilst minimising the information lost. This means that when visualised the neighbouring data points in the high-dimensional data will remain close to each another when seen in a 2 or 3 dimensional space. t-SNE generates a probability distribution over pairs of data points. This means that similar objects, in our case Datix reports on similar topics, are assigned a higher probability of being neighbours while the converse is true for dissimilar Datix reports. In the high dimensional space a normal distribution is used whereas in the 2 or 3-dimensional space it is a t-distribution. The longer tailed t-distribution enables better spacing of the data points, preventing overcrowding and difficulty with visualisation. The precursor algorithm to t-sne, called stochastic neighbour embedding or ‘sne’, by Hinton and Rowies used a normal distribution for both the high and low dimensional spaces. However, this generated inferior visualisations because the lack of mismatched tails caused overcrowding.
Method
2212 reports between 2nd February 2016 and 21st November 2020 were pulled from our local DatixTM database. These reports included the free text of the descriptions as well as severities of harm caused. Top2Vec was run specifying a minimum count of 5 (i.e. words with fewer than 5 occurrences were disregarded) and the remainder as default parameters. For reference this meant that the PV-DBOW variant of Doc2Vec was used for embedding with a vector size of 300 and a window size 15. This was trained to 40 epochs with hierarchical soft-max. Top2Vec works by running both a word embedding algorithm followed by the clustering algorithm, HDBSCAN. Once each Datix report included in the study was represented by a 300 dimension numeric vector, the next stage was to look for any groups of words with potentially common meanings that could reveal the underlying topic and represent recurrent themes. To look for these clusters, HDBSCAN was used. As previously mentioned HDBSCAN is an extension of DBSCAN with a hierarchical element which makes sense for this project because it was likely that subtopics would emerge from this data. For our data the Top2Vec algorithm assigned each Datix report 300 numerical values. These values or dimensions tell us where each report is located in relation to the others. In order for the clusters to be visualised, a dimensionality reduction was needed. This reduced the number of dimensions from 300 to 3. The t-sne algorithm does this whilst minimising the amount of information lost which is why this algorithm was chosen. Three dimensions was chosen rather than two for this dataset as when the reductionality was taken down to two, the visualisation had some areas of heavy density, making visualisation difficult. Increasing back to three dimensions enabled the geometry of the whole dataset to expand and allow for easier visualisation. For the Doc2Vec, HDBSCAN and t-sne algorithms, standard parameterisations were used as recommended by current literature in this field (Figure 2).
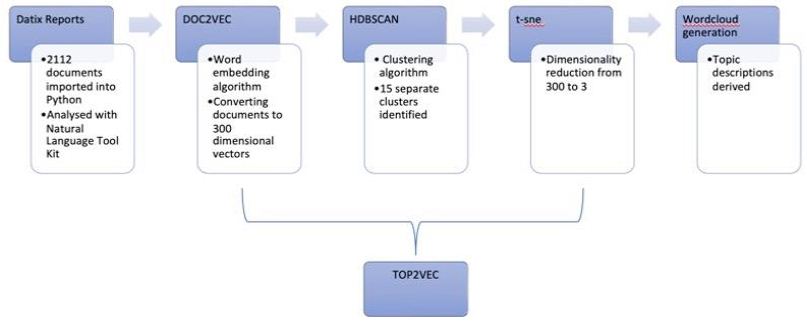
Figure 2: Word clouds are used to visually represent the different clusters generated by HDBSCAN. Each cluster represents a potential topic as words of similar meanings or words referring to a similar incident are grouped together. The frequency of occurrence of specific words and it’s severity are emphasised by larger fonts and different colours. These word clouds are then analysed manually to check for coherence and relevance.
Results
Graphical 3-dimensional representation of the t-sne algorithm generated clusters of data points, labelled by 5 categories: no harm, near miss, low harm, moderate harm, and severe harm (Figure 3 and Table 1):
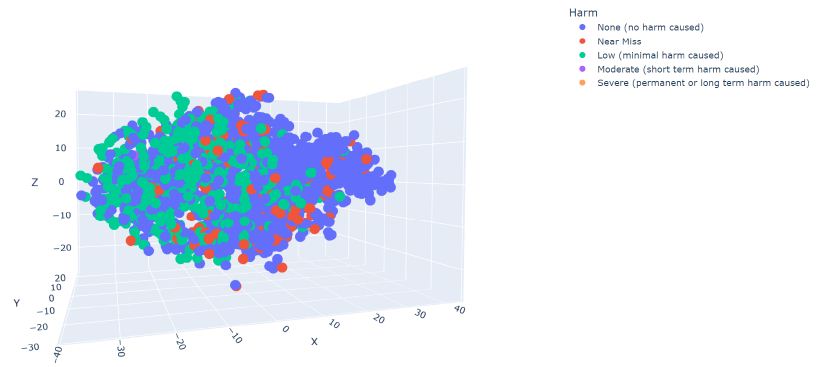
Figure 3: When all the incident descriptions were inputted into Top2Vec, the output was 15 word clouds. These summative visual representations of clustered semantics in text could be manually reviewed for both coherence (i.e. whether clusters obviously focus around a specific theme) and relevance (i.e. whether the generated theme highlights a problem with tangible solutions).
Table 1: Coherent themes highlighted by the word clusters included: breaching of same-sex bed clustering; various pressure sores; mislabelled blood samples; abuse/aggression toward staff; prescription errors; isolation of patients with loose stools in side rooms; issues with patient flow through the hospital including ICU discharges; and 2222 emergency team calls to the wards. Of note, as each word cloud represents hundreds of Datix reports, multiple clouds generated for the same theme clearly represent an issue with greater burden as a larger proportion of all reportable events. To this end, both “breaching of same-sex bed clustering” and “pressure sores” were represented by 4 clouds each, whereas the remaining themes generated only a single cloud each.
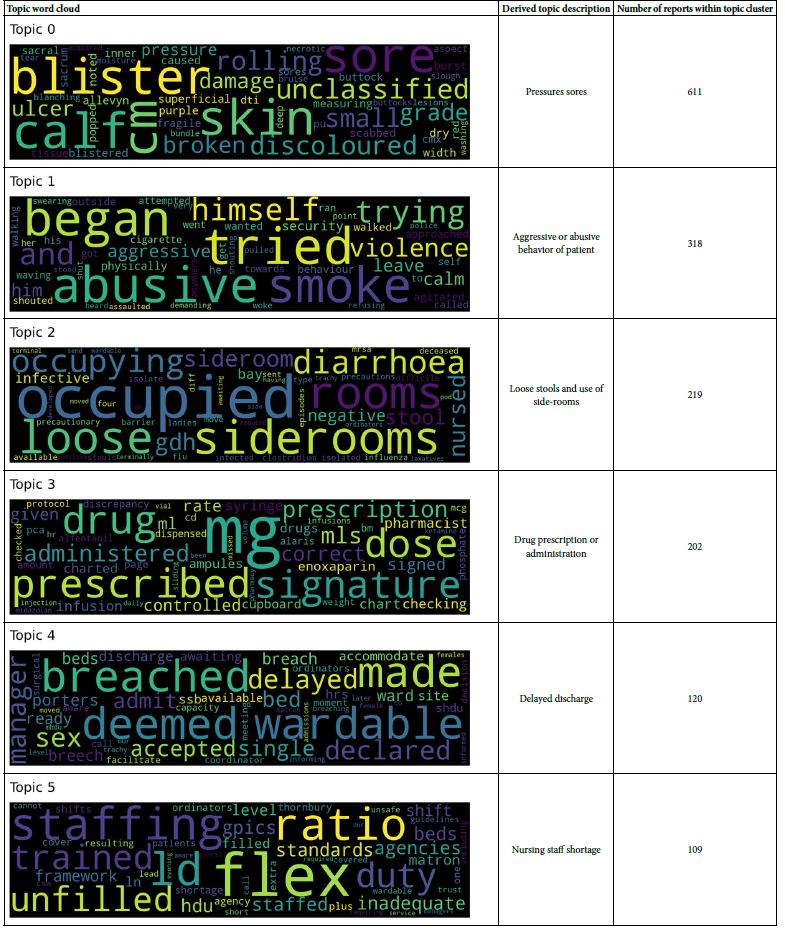
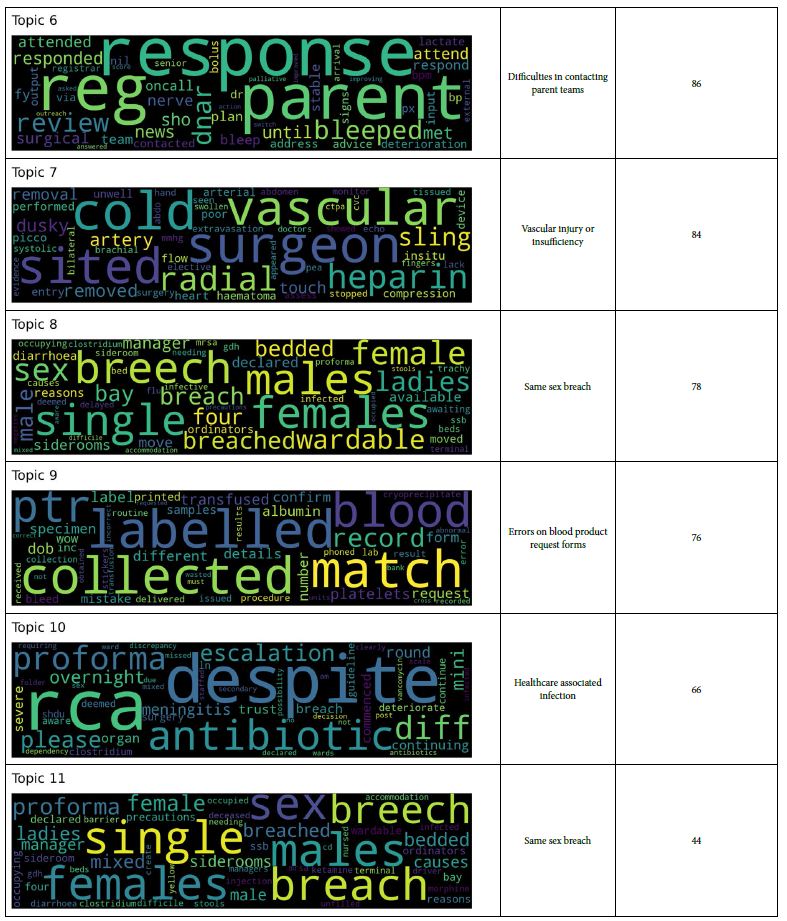
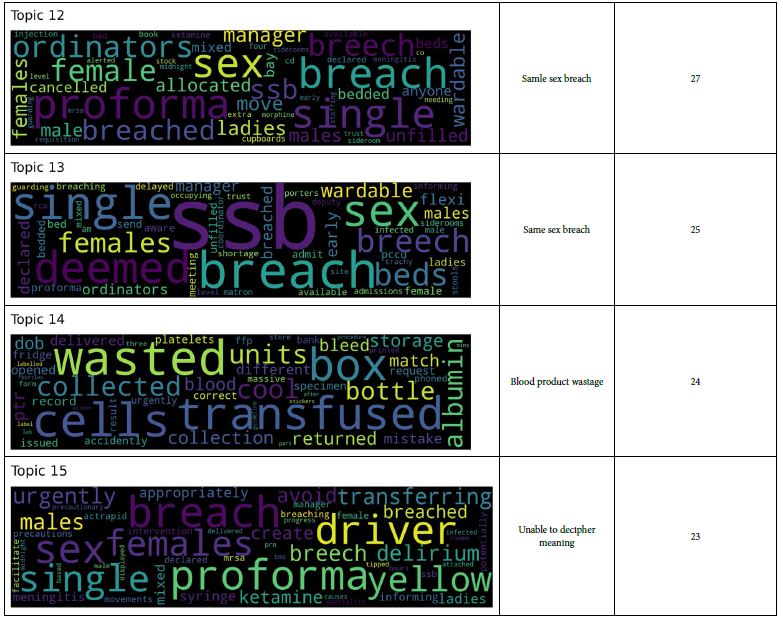
As mentioned previously, coherence of word clouds does not necessarily translate to relevance. One example of this is the “prescription errors” cloud as the largest represented words within the cloud “dose”, “signature” and “administered” do not provide sufficient context to highlight a specific problem, and as a result, allow for a specific solution. “Dose” is clear in its issue but is not amenable to change (e.g. staff education, availability of BNF, amendment of electronic prescribing system) unless the cloud identifies a specific drug that is routinely inappropriately dosed. Similarly, “signature” may have multiple meanings, (e.g. inadequate recording in a controlled drug book; labeling of drug syringes; receipt of medications from pharmacy). Similarly, themes may generate coherent and specific issues, such as the “abuse/aggression towards staff ” word cloud, which despite being a serious – and unfortunately all too common – occurrence, generates a word cloud that highlights an already commonly known issue without known solutions. This may simply represent that Datix is not the most appropriate forum for reporting these events, and that solutions must be found elsewhere.
Discussion
The machine learning-based analysis successfully identified a set of topics and quantified them by magnitude. While the largest topics were pressure sores, aggressive patient behaviours and loose stools, there are differences in practice with regards to reporting particular incidents. For example, all loose stools and pressure sores are reported via Datix for specific audit purposes and so the size of such topics will be accordingly larger than other types of incidents such as needle-stick injury , where these may not be as consistently reported. We propose that this technique enables any healthcare provider to summarise and quantitatively reveal patterns of risk which were not previously known. This enables actions to mitigate the risks associated with such topics. The sixteenth and smallest topic was not easily discernible by reading its wordcloud. This represents how the clusters identified by HDBSCAN have indistinct boundaries. Since Top2Vec is a stochastic process, the results produced have varying numbers of topics and topics themselves. Instead of training a fresh new set of word and document embeddings with these 2112 Datix reports, it is possible to use a pre-trained embedding was trained on a larger body of text eg Wikipedia articles. However, Given how distinct patterns of is used in medical text, There is likely to be inaccuracy in the word and document similarities. Not only did our trained embedding result in reasonable performance in enabling the discovery of common topics, but further training is possible as more Datix reports are accumulated over time. This could enable the training and development of more accurate embeddings for topic extract and other natural language processing tasks. The same technique can easily be applied to other types of text, e.g. medical ward rounds and admissions. This can be used in an attempt to model outcomes where an obvious, traditional predictive model is not apparent. Practical examples that has been demonstrated from such an approach include the use of inpatient records during the peri-delivery period to predict poor maternal outcomes [8] and in the prediction of poor outcomes in acute ischaemic stroke [9]. It would also be possible to work from a document perspective, i.e. find clinical incidents that do not neatly fit into any of the major word clusters, in order to find potential incidents that require special attention over and above what would usually be required. We wish to stress that this technique is not intended to demonstrate superior or more accurate capabilities than human beings to detect common themes and topics across a sequence of texts but the possibility of completing this tasks with much greater efficiency. Hence natural language processing can provide a valuable tool for clinicians.
References
- Tomas M, Kai C, Greg C, Jeffrey D (2013) Efficient Estimation of Word Representations in Vector Space. arXiv 1301.3781.
- Le QV, Miklov T (2014) Distributed Representations of Sentences and arXiv: 1405.4053.
- Dimo Angelov (2020) Top2Vec: Distributed Representations of Topics. arXiv: 09470. Casey et al. (2021). A systematic review of natural language processing applied to radiology reports. BMC Medical Informatics and Decision Making 21.
- Casey A, Emma D, Michael P, Hang D, Daniel D, et (2021) A systematic review of natural language processing applied to radiology reports. BMC Medical Informatics and Decision Making 21. [crossref]
- Doan S, Elly WY, Sameer ST, Peter WL, Daniel SZ, Manabu T. (2019) Extracting health-related causality from twitter messages using natural language processing. BMC Medical Informatics and Decision Making 19:79. [crossref]
- Falissard L, Claire M, Walid G, Claire I, Karim B, et et al. (2022) Neural Translation and Automated Recognition of ICD-10 Medical Entities From Natural Language: Model Development and Performance Assessment. JMIR medical informatics. 10. [crossref]
- Harris ZS (1954) Distributional Word 10: 146-162.
- Clapp MA , Ellen K, Kaitlyn EJ, Roy HP, Anjali JK, et (2022) Natural language processing of admission notes to predict severe maternal morbidity during the delivery encounter. American Journal of Obstetrics and Gynaecology 227: 511.e1-511. e8. [crossref]
- Sheng FS, Chih-Hao C, Ru-Chiou P, Ya-Han H, Jiann-SJ, et al. (2021) Natural Language Processing Enhances Prediction of Functional Outcome After Acute Ischemic Journal of the American Heart Society 10. [crossref]
- Tissot HC, Anoop DS, David B, Steve H, Ruth A, et al. (2020) Natural Language Processing for Mimicking Clinical Trial Recruitment in Critical Care: A Semi- automated Simulation Based on the LeoPARDS Trial. IEEE Journal of Biomedical and Health Informatics. 24: 2950-2959. [crossref]
- Levin S, Matthew T, Eric H, Jeremiah SH, Sean B, et (2018) Machine-Learning- Based Electronic Triage More Accurately Differentiates Patients With Respect to Clinical Outcomes Compared With the Emergency Severity Index. Annals of Emergency Medicine 71: 565-574.e2. [crossref]
- Harpaz R, Alison C, Suzanne T, Yen L, David O, et (2014) Text mining for adverse drug events: the promise, challenges, and state of the art. Drug Safety 37: 777-790. [crossref]
- Campello RGB, Davoud M, Joerg S (2013) Density-Based Clustering Based on Heirarchical Density Advances in Knowledge Discovery and Data Mining 160-172.
- Maaten LV, Geoffrey H (2008) Visualizing Data using t-SNE. Journal of Machine LEarning Research 9: 2579-2605.
- Hinton et al. (2002) Stochastic Neighbour Embedding. Advances in Neural Information Processing Systems 15: 833-840.