Abstract
The Lorendian distribution, also known as the Cauchy distribution, is commonly used in statistical physics and geostatistics to describe here the distribution of some aspects of elements. When applied to the study of tin in the Ehrenfriedersdorf deposit, the Lorendian distribution provides valuable insights into the spatial distribution and concentration patterns of tin within this historic mining area. Furthermore, the Lorendian distribution shows that Sn is extraordinarily soluble and concentrated in the fluid/melt on the critical point corresponding to 25.7% H2O of the pegmatite solvus curve (T vs. H2O in the melt) and in the immediate vicinity of this point, determined by maximal concentration Ic at the critical point xc and the width (half width at half maximum (HWHM) of the curve in the melt-H2O system). The strong Lorendian relationship between Sn and water and especially the strong relationship to the critical point (C.P.) of the silicate melt shows convincing that Sn is related to the supercritical fluid coming from mantle depth, also instigated by the occurrence of diamond, lonsdaleite, 13C-rich graphite, and orthorhombic cassiterite, e.g., as cotunnite-type cassiterite. We also show that other elements (Be, B, P, Cl, Zn, As, Cs, Sn, Ta, and W) have similar behavior in water-rich silicate melt systems.
Keywords
Lorentzian curve, Sn distribution, Solvus curve, Rb and Cs enrichment, Sauberg mine, Ehrenfriedersdorf/Germany
Background
The origin of tin deposits and the nature of the Sn transport in the past are often discussed controversially (e.g., Kosals 1976 [1], Liu et al. 2020 [2]). Before Liu et al. (2020) [2], the discussion was mostly restricted to the solubility of SnO2 in water-rich solutions up to 400°C. Ehrenfriedersdorf, located in the Central Erzgebirge region of Germany, has a rich history of tin mining dating back to the medieval period [3]. The deposits around them have very complex geology and mineralization patterns, which make them an ideal candidate for applying advanced analytical and statistical methods such as the Lorentzian distribution to analyze their tin content and its origin. The surrounding granite was discussed, in the past, exclusively as the source of Sn (primarily cassiterite). At the beginning of the intensive analytical study of melt inclusions in granite and pegmatite quartz from the Ehrenfriedersdorf, starting in 1995 [4], we often observed high runaway trace element data that could not interpreted. With time, the amount of such runaway data increases significantly. A correlation with other elements was not possible at that time [5]. Beginning with the determination of water in glasses and melt inclusions (Thomas, 2000) [6], the situation improved from year to year (see also Thomas 2024a) [7]. It appears fast that many main and trace elements in melt inclusions show strong correlations with the water in them. Thomas et al. (2019 and 2022) – [8,9] showed that many elements correlate with water of the melt inclusions according to Gaussian and manly Lorentzian curves. Furthermore, it was revealed that often, the critical point (C.P.) of the solvus curves (correlation of the water concentration in the silicate melt and the homogenization temperature) and the sharp peak of the Lorentzian curve coincide. The connection between the solvus curve and the Lorentzian curve is illustrated by Thomas and Rericha (2024a) [10] in Figure 2b in there.
Characteristics of the Lorentzian Distribution for Tin
The Lorentzian curve (according to Hendrik Antoon Lorentz (1853-1928), a Dutch physicist) is a mathematical function that describes a peak (here the maximal Sn concentration in ppm) centered at a specific position (here the critical water concentration (25.7 %) in the silicate melt) and is characterized by w, which is the half-width at half maximum (HWHM).
The Lorentzian curve is, in our case:
I(x) = Ic * (w/2)2/((x-xc)2 + (w/2)2) (1)
With:
I(x) height of the Sn concentration (ppm) at the water concentration x (%),
Ic maximal concentration of the Sn (ppm) at xc (center), identical with the C.P. of the complete system,
w width is the half-width at the half-maximum (HWHM). x water concentration (%),
xc water concentration (%) at the critical point (solvus and Lorentzian curves),
y0 offset is the shift of the curve from its original position along the y-axis), which is the Clarke value for Sn (3 ppm according to Rösler and Lange, 1975 [11],
A area – is the result of integrating the Lorentzian curve over all values of x,
R2 correlation coefficient.
The following Figure 1 shows the typical form of the Lorentzian distribution of tin (in ppm) versus water concentration (in %) in melt inclusions from the pegmatite system in the Sauberg tin deposit near Ehrenfriedersdorf. For the Lorentzian fitting, we used the Origin 6.1 program. As we can see from Table 1, using equation (1), the calculated Lorentzian curve is identical.
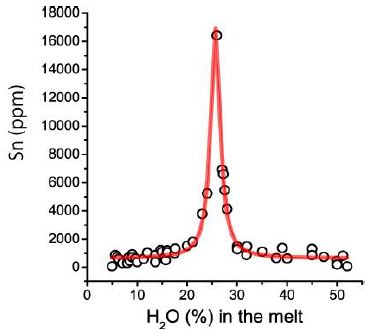
Figure 1: Tin distribution in melt inclusions in quartz from the granite-pegmatite system (Sauberg mine near Ehrenfriedersdorf). The maximal Sn concentration is 16300 ppm at a water concentration of 25.7%.
Figure 1 shows the Lorentzian distribution of Sn vs. H2O, and in Table 1 are the resulting data summarized. The center (25.7 % H2O) is the position of the peak’s center, which corresponds to the critical point of the solvus curve and the maximum (height) of the Sn concentration (here, 16400 ppm Sn). Width is the half-width at half-maximum (HWHM). The offset refers to the displacement of the Lorentzian curve from its original position along the x-axis (H2O concentration) corresponding to 644 ppm.
Table 1: Lorentzian fit of Sn, determined in silicate melt inclusions from the pegmatite system of the Sauberg mine near Ehrenfriedersdorf (46 measuring points). Each point is the mean of 5 to 10 single measurements. The values in the second data row are calculated using Equation 1.
|
|
Area | Center | Width | Offset | Height | R2 |
| A | xc | w | yo |
Io |
||
| Measured |
57799 ppm2 |
25.7% H2O | 2.3% H2O | 644 ppm Sn | 16295 ppm Sn |
0.9843 |
| Calculated |
58871 ppm2 |
25.7% H2O | 2.3% H2O | (603 ppm Sn) | 16295 ppm Sn |
1.0000 |
The offset of the calculated data is, of course, zero – the value of 603 ppm Sn results from the average difference between measured and calculated Sn values. By the way, equation (1) of the Lorentzian curve can be advantageously used for the analyses of analytically determined outlayers. The offset for the calculated case is zero. However, the difference between measured and calculated Lorentzian curves results in a value of 603 ppm Sn. The error (standard deviation) of the offset is ± 348 ppm Sn and results mainly from the values at the tails. The offset represents the concentration of Sn in the surrounding rocks, introduced by the supercritical fluids/melts.
Interpretation of the Results
The application of the Lorentzian distribution to the analytically determined tin and water concentrations in the Ehrenfriedersdorf deposit reveals a significant clustering of tin-rich zones. The location parameter “center” indicates the central area of the highest Sn concentration of 16300 ppm and corresponds with the solvus crest (C.P.) of the water-silicate system, which lies for Sn at 25.7 % H2O in the silicate melt. The low value for the C.P. of the solvus is beside the water content in the melt, the result of the sum of further compounds (Be, B, F, P, rare alkalis, and others) in the volatile-rich melt. The position of the critical point varies a little bit by the variation of the critical elements and compounds. For Be, BO3, PO4, Cl, Zn, As, Cs, Sn, Ta, and WO4, the result from 355 measurements for the critical point lies at 26.9 ± 1.30 % H2O in the silicate melt (see Table 2 and Thomas et al. 2022 [9], and Thomas and Rericha 2023) [12]. Besides H2O, B, rare alkalis (Rb, Cs), and P, fluorine likewise has a determining meaning for the position of the solvus crest as well as the maximum of the Gaussian and Lorentzian curves in the granite-pegmatite system in the Ehrenfriedersdorf district.
Table 2: Lorentzian fit of elements and compounds, determined in silicate melt inclusions from the pegmatite system of the Sauberg mine near Ehrenfriedersdorf. Each point (n) is the mean of 5 to 10 single measurements. For the calculation, we used the Origin 6.1 program. The units are in Table 1.
|
Element/Compound |
Area | Center | Width | Offset | Height |
n |
| Be |
131560 |
26.0 | 8.88 | 284 | 11810 |
14 |
| BO3 |
153500 |
25.5 | 7.67 | 0 | 12730 |
23 |
| PO4 |
1331000 |
28.5 | 7.49 | 13001 | 13100 |
29 |
| Cl |
147040 |
27.2 | 4.98 | 902 | 18782 |
63 |
| Zn |
208400 |
27.0 | 5.78 | 0 | 22950 |
9 |
| As |
46433 |
30.2 | 3.19 | 521 | 9266 |
20 |
| Cs |
266000 |
26.0 | 5.63 | 1300 | 30000 |
18 |
| Cs1) |
25082 |
26.0 | 5.31 | 1340 | 30060 |
119 |
| Sn |
59124 |
25.7 | 2.30 | 704 | 16414 |
35 |
| Ta |
50148 |
27.4 | 9.87 | 86 | 3236 |
18 |
| WO4 |
73258 |
26.8 | 7.41 | 303 | 6292 |
7 |
| Average |
26.9 ± 1.3 |
Sum 355 |
Cs in granite from Ehrenfriedersdorf; n – the sum of measurements.
In contrast, the scale parameter “width” (2.3 % water for Sn) provides information on the spread and extent of these high- concentration zones related to the C.P. and the influx of the supercritical fluid at this point. The “offset” is the shift in direction y (Sn-concentration) of the Lorentzian curve from the original position along the x-axis (water concentration). The value of the offset (644 ppm Sn) interprets we as the minimum enrichment of Sn against the value of tin in the surrounding Sn-poor granite system, which is, according to Hösel (1994) [13], ≤ 200 ppm Sn (as a result of redistribution and ore deposit formation. The “height” represents the solved maximal Sn concentration in the supercritical fluids (SCGF). Note that the SCGF also carries solid minerals like orthorhombic cassiterite, diamond, and graphite. The interpretation of the “area” is a bit difficult. The area under the Lorentzian curve represents, in our case, the total concentration of Sn, here 57799 ppm2 in the studied granite-pegmatite system. If we take the Clarke value of Sn for granites, which is three ppm (Rösler and Lange, 1975) [11], then we have an exceptional enrichment of tin in the considered granite-pegmatite system of nearby 20.000 fold. That is remarkably high. Alone, the Sn concentration comes directly with a supercritical fluid, which is about the 5500-fold amount of the Clarke number, is dramatically high. The regular presence of carbon (as C, CO2, CH4 ) in the SCGF shows plausibly that the Sn transport occurs as Sn2+, probably as hydroxocomplexes like ([Sn(OH)x]n-) or as Sn4+ in more complicated compounds as (Na, K)[Sn(OH, Cl, F)3CO3] (Kosals, 1976). Rb and Cs can take the place of Na and K (see Thomas and Rericha, 2023) [14]. Cs increase the number of the H2O molecules in the surrounding OH shell (Pietsch, 1938) [15] up to 13. It is necessary to stress that SCGFs show very different solvency caused by density- dependent solubility, enormously changed polarizability, strongly increased diffusion rates and reactivity, and extremely low viscosity.
One point is here also important: if, for example, one element is in two compounds with different anions present, then the formation of overlapping Lorentzian curves with different xc values is possible (see Figure 3 in Thomas and Rericha, 2024b) [16,17]: the distribution of Be in two distinct species, beryllonite versus hambergite with xc1 at 25.5 % H2O and xc2 at 31.0 % H2O. From the Lorentzian curve type for some elements, it follows clearly that their solubility is not directly related to the water concentration in the melt. The highest solubility is clearly associated with the H2O concentration, representing the critical point (C.P.). At this point, the melt inclusion-bearing quartz grows very fast and traps “samples” of the surrounding medium as melt inclusions. Through fast processes, the boundary layer composition changes steadily (fast diffusion in a low viscous SCGF). Therefore, the composition of the single melt inclusions changes too (see, e.g., Borisova et al., 2012 [18], Table 2 in them, representing two different melt inclusions lying together in one growth zone). Lorentzian distributions of elements are not only water-rich silicate melt-related. Another example is the relationship of Cs, Rb, and B in the Ehrenfriedersdorf granite. Figure 2 shows such a plot. As Table 3 shows, the concentration of the rare alkalis Rb and Cs is very high in granite from the Sauberg mine near Ehrenfriedersdorf.
Table 3 shows the data for this passable Lorentzian plot and demonstrates that B- Rb and Cs-rich melt fractions are generated and penetrate the present granite rock. An exact interpretation of this remarkable plot (Figure 2) is, at the moment, not possible. More analytical, microscopical, and Raman work is necessary.
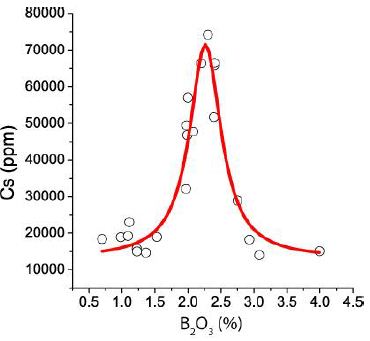
Figure 2: Lorentzian distribution of Cs versus boron obtained from melt inclusions in granite quartz from the Sauberg mine near Ehrenfriedersdorf.
Table 3: Cs and (Rb + Cs) distribution in melt inclusions in quartz from the granite- system (Sauberg mine near Ehrenfriedersdorf). The maximal Cs and Rb + Cs concentrations are 58477 and 65756 ppm (sum = 12.4%) at a boron concentration of 2.26%.
|
Measured |
Area | Center | Width | Offset | Height |
R2 |
|
A |
xc | w | yo |
Io |
||
| Cs-B |
53529 ppm2 |
2.26% B2O3 | 0.58% B2O3 | 13113 ppm Cs | 58477 ppm Cs | 0.928 |
|
Cs+Rb-B |
62463 ppm2 | 2.26% B2O3 | 0.60% B2O3 | 23854 ppm Rb + Cs | 65756 ppm Rb + Cs |
0.905 |
Rb gives no Lorentzian distribution with B2O3 – therefore, the low R2 value using the sum of Rb and Cs.
Alone from the small number of examples, we see that the geochemistry of the Variscan Sauberg mine is highly complex. The standard correlation of elements gives no satisfactory answers to the complex processes working at the formation of this tin deposit (see Author Collective, 1963) [19]. Regardless of the input of SCGF, the genetic origin of this tin deposit is not solvable. Primary the tin mineralization in Ehrenfriedersdorf is not uniformly distributed but instead concentrated in specific geological structures, here pegmatites or pegmatite-like bodies, influenced or generated by supercritical fluids or melts (in short, geofluids (SCGF)). The classic idea of the hydrothermal origin of cassiterite is now untenable. The sharp Lorentzian peak related to the critical point of the solvus curve is a strong hint of the impact of supercritical fluids coming from mantle deeps (with temperatures >1000°C). This idea is supported by orthorhombic polymorphs of cassiterite (e.g., the cotunnite-type cassiterite inclusions in cassiterite crystallized at a pressure of about 10 – 40 GPa (Thomas 2025) [20]. Note, however, that orthorhombic cassiterite is metastable at low pressures. The transition into tetragonal cassiterite is mostly irreversible by kinetic barriers. Such a barrier may be the “shock-like” transition from the supercritical to the under- critical state. The occurrence of orthorhombic cassiterite is supported by the occurrence of diamond, lonsdaleite, and graphite inclusions with extreme isotope composition: 13C-rich diamond and graphite versus 12C-rich ones. The SCGFs are excellent media for the potent and selective separation of isotopes (e.g., 12C/13C or H/D by diffusion effects and solubility differences (see Thomas 2024b [16,17], 2025 [20] and Thomas and Rericha 2024a) [10].
Implications for Mining and Exploration
Understanding the Lorentzian distribution of tin in the Sauberg deposit has practical implications for mining and exploration in the whole Variscan Erzgebirge/Krušnohořy region. By identifying the central and peripheral zones of tin concentration, mining operations are optimizable to target the most economically viable areas. That can lead to more efficient extraction processes and reduced operational costs. The highest Sn concentration is related to rock parties rich in pegmatites or pegmatite-like bodies (see Schröcke, 1954) [21]. Furthermore, the substantial input of Sn by SCGF changed the old ideas of the dominance of tin granites for the generation of workable deposits. The high level of tin in the granites in question is the result of the interaction between SCGF and the granites. The high water and Sn content at the critical point (C.P.) favor the formation of pegmatites and pegmatite-like structures with this element and others (see above). It is quite conceivable that under the famous Pb-Zn deposit of the Freiberg mining district (Rösler et al. 1968) [22] is a large tin deposit. Hints are REE-rich fluorite globules like that from Zinnwald (Thomas 2024c) [23] in yellow low-temperature fluorite from Halsbrücke near Freiberg and the reverse of very high concentration of Pb (1790 ppm) [as cotunnite], Zn (85120 ppm) [as (K, Pb, Cs)2 Zn(Cl, Br)4] and Ag (100 ppm) [as chlor-, brom- and iodargrite] in high-temperature fluid inclusions in quartz of the Sauberg mine (see Boriosova et al. 2012 [18] and Thomas et al., 2019 [8]). The Clarke values for Pb, Zn, and Ag are, according to Rösler and Lange (1975) [11], 20, 40, and 0.05 ppm, respectively [24].
That interpretation results from the Lorentzian distribution, which offers insights into the geological processes that led to the formation of the tin deposits. The distribution pattern may reflect the influence of SCGF, their way from the mantle into the crustal regions, which later formed fault structures and other geological factors that concentrated tin in specific areas over geological periods via hydrothermal re- deposition and crystallization as cassiterite. Tin is highly soluble in SCGFs, as we can see from their Lorentzian distribution. However, an essential part of tin comes from mantle depths (10 – 40 GPa) as solid phases like the cotunnite polymorph of cassiterite. It is well- known that the high-pressure and high-temperature polymorphs of cassiterite, e.g., orthorhombic phases, are formed at 10 – 40 GPa or higher. Typically, they transform back to tetragonal cassiterite upon decompression. As we see in many examples (Thomas, 2025 [25] and Thomas and Rericha, 2023 [12,14]), this process can be inhibited by fast cooling, particularly by the transition from the supercritical to the critical and under-critical state outwit.
Conclusion
The Sauberg tin deposit provides a robust framework for understanding the spatial variability and clustering of tin mineralization. The insights gained from this statistical approach can inform both current mining practices and future exploration efforts, ultimately contributing to the efficient and sustainable exploitation of this valuable resource (at the moment, this is an abandoned mining district). However, we can learn a lot from the two-dimensional element distribution (elements versus water concentration. The distribution of the trace elements in melt inclusions in granites and pegmatites in relationship with the water content of the same inclusions shows clearly Lorentzian curves with the maximum concentration at the critical point of the solvus and that of the Lorentzian curves. These results give robust hints for the origin of Sn and other elements via supercritical fluids (SCGF). A critical rethinking of the origin of this and other analog mineral deposits is necessary.
Acknowledgment
The Author thanks the members of the working group, which builds up for the first time a usable measuring chamber at DESY for the study of micrometer-large fluid and melt inclusions in a quartz matrix. Besides the Author, the following scientists belong to this group: Prof. A. Knöchel (DESY Hamburg), Dr. J. Walter, Prof. Althaus (both from Karlsruhe), Dr. M. Haller, Dr. M. Radtke (both from DESY Hamburg), Dr. W. Klemm, TU Bergakademie Freiberg. Thanks also go to Dr. D. Rhede (GFZ Potsdam) for the longstanding cooperation in the microprobe analysis of melt inclusions and to Dr. J.D. Webster (AMNH New York) for performing the SIMS analyses.
References
- Kosals Ja A (1976) Main features of geochemistry of rare metals in granitic melts and solutions. Nauka, Novosibirsk. 232 p. (in Russian).
- Liu Y, Li, J, Chou IM (2020) Cassiterite crystallization experiments in alkali carbonate aqueous solutions using a hydrothermal diamond-anvil cell. American Mineralogist. 105: 664-673.
- Breiter K (2014) 800 years of mining activity and 450 years of geological research in the Krušné Hory/Erzgebirge Mountains, Central Europe Bol Mus Para Emílio Goeldi Cienc Nat Belém. 9: 105-134.
- Thomas R, Haller M, Knöchel A, Radtke M (1995) First results of studies on melt inclusions in geological samples using SYXRF-microprobe. Hamburger Synchrotronstrahlungslabor am Deutschen Elektronen-Synchrotron (HASYLAB), Annual Report II: 961-962.
- London D, Evensen JM (2002) Beryllium in silicic magmas and the origin of beryl- bearing pegmatites. In: Beryllium – Mineralogy, Petrology, and Geochemistry. (ed): E.S. Grew. Chapter 11: 445-486.
- Thomas R (2000) Determination of water contents of granite melt inclusions by confocal laser Raman microprobe spectroscopy. American Mineralogist. 85: 868-872.
- Thomas R (2024a) Vom Schmelzeinschluss zum superkritischen Fluid – Ergebnisse und Folgen der Befahrung der Grube Sauberg bei Ehrenfriedersdorf. Veröffentlichungen Museum für Naturkunde Chemnitz. 47: 59-66.
- Thomas R, Davidson P, Appel K (2019) The enhanced element enrichment in the supercritical states of granite-pegmatite systems. Acta Geochim. 38: 335-349.
- Thomas R, Davidson P, Rericha A, Voznyak DK (2022) Water-rich melt inclusions as “frozen” samples of the supercritical state in granites and pegmatites reveal extreme element enrichment resulting under non-equilibrium Mineralogical Journal (Ukraine). 44: 3-15.
- Thomas R, Rericha A (2024a) Extreme element enrichment by the interaction of supercritical fluids from the mantle with crustal rocks. Minerals 33: 1-10.
- Rösler HJ, Lange (1975) Geochemische Tabellen. Leipzig. Pg: 675.
- Thomas R, Rericha A (2023) Extreme element enrichment by the interaction of supercritical fluids from the mantle with crustal rocks. Minerals 33: 1-10.
- Hösel G (1994) Das Zinnerz-Lagerstättengebiet Ehrenfriedersdorf/Erzgebirge (1994). Freiberg. Pg: 195.
- Thomas R, Rericha A (2023) Extreme enrichment of Cs during the crystallization of the Ehrenfriedersdorf pegmatite melt related to the Variscan tin Geol Earth Mar Sci 5: 1-4.
- Pietsch E (1938) Gmelins Handbuch der anorganischen Chemie. Edition 8. Verlag Chemie, GmbH Berlin. Pg: 104.
- Thomas R (2024b) 13C-rich diamond in a pegmatite from Ronne, Bornholm Island: Proofs for the interaction between mantle and crust. Geol Earth Mar Sci. 6: 1-3.
- Thomas R, Rericha A (2024b) Extreme element enrichment, according to the Lorentzian distribution at the transition of supercritical to critical and under-critical melt or Geol Earth Mar Sci 6: 1-6.
- Borisova AY, Thomas R, Salvi S, Candaudap F, Lanzanova A, Chemeleff J (2012) Tin and associated metal and metalloid geochemistry by femtosecond LA-ICP-QMS microanalysis of pegmatite-leucogranite melt and fluid inclusions: new evidence for melt-melt-fluid Mineralogical Magazine. 76: 91-113.
- Author Collective (1983) Isotopen- and elementgeochemische sowie radio- geochronolgische Untersuchungen an der Zinnlagerstätte Ehrenfriedersdorf. AdW of the GDR, ZFI-Mittelungen 76, 271 p.
- Thomas R (2025) Extremely 13C-rich diamond in orthorhombic cassiterites in the Variscan Erzgebirge, Saxony/Germany. Geol Earth Mar Sci 7: 1-5.
- Schröcke H (1954) Zur Paragenese erzgebirgischer Zinnlagerstätten. Neues Jahrbuch Mineralogie, Abhandlungen 87: 33-109.
- Rösler HJ, Baumann L, Jung W (1968) Postmagmatic mineral deposits of the northern edge of the Bohemian Massif (Erzgebirge-Harz). Guide to Excursion 22 AC, International Geological Congress XXIII Session Prague, ZGI Berlin. 3-57.
- Thomas R (2024c) REE-rich fluorite in granite from Zinnwald/East Erzgebirge/ Geol Earth Mar Sci 6: 1-5.
- Thomas R, Rericha A (2024) Meaning of supercritical fluids in pegmatite formation and critical-element Geol Earth Mar Sci 6: 1-5.