Abstract
Impact of climate change is felt across a wide range of events on earth surface, including the geospatial movements by insects. This research aims to measure the impact of rising temperature on the Bombus (Bumble bee) population. The study firstly divides an 11-year accumulation of Bombus spotting data from Oxfordshire, United Kingdom into four categories that reflect the respective stages in the Bombus life cycle. Using regression analysis, the study investigates how the temperature has influenced the bee population at each stage. Results from the regression analysis revealed that the rise in temperature is affecting the population size of the Bombus population in all stages of their life cycle, particularly at an early stage where queen bees and worker bees emerge. Spatial analysis using the mean centre and the deviational ellipse also revealed that the queen bees are migrating generally towards north-west, and are becoming increasingly dispersed, expanding continuously in the direction of north-west to south-east.
Keywords
Bombus, Temperature, Phenology, Migration, Regression analysis
Introduction
A French botanist Charles Morren first defined the term phenology as “the science of theses sort of things” in 1833 [1]. The term has since evolved and, in modern research, it is used as a reference to the seasonal natural phenomena such as the life cycles of plant, animal and insect species in relation to seasonal changes. A main indicator of seasonal change is the change in temperature. Like many countries in the world, the United Kingdom is currently experiencing rise in the temperature as an effect of global warming with an accelerated pace in the past decade, and it is likely that an over-forty degrees Celsius temperature in the summer would become a norm within this century [2]. It would mean that the summer in the UK would not be dissimilar from that of the current state of Sahara Desert [3], something we did not previously anticipate in the region north of the temperate zone [4]. This situation makes the phenological life cycles particularly volatile. Bombus bumblebees are part of the Apidae (bee) family, who are mostly known for their furry bodies and large wings. They are mostly found in the temperate climates with seventy-nine species found in Europe [5]. They play a crucial role in the pollination of crops, often filling in the gaps for those that honeybees cannot cover [6]. They live in colonies which are led by one female referred to as the ‘queen.’ The queen is the only survivor from the previous season’s colony, and she emerges out of hibernation in early spring in search of food to begin the production of her nest. The locations of these nests vary with settlings occurring under thick vegetation in areas of grassland (O’Conner et al. 2014) or rodent holes and abandoned birds’ nests in urban environments [7]. Once a habitat is established, she lays her first set of eggs which would become the first batch of worker bees. These worker bees are responsible for the maintenance and sustenance of the nest by foraging throughout the season as well as rearing the constant new broods that emerge. The timing of a worker bees’ emergence is known to be crucial as this will indicate the queen’s physiology for the rest of the season [8]. Once late summer to early autumn reaches, the queen begins to give birth to both the male and female offspring, respectively. When the males have sexually matured, they permanently exit from the nest to seek female bees from other colonies—each batch of male bees exiting a nest is referred to as ‘drones’ [9]. Shortly after the drones depart, the females begin to exit to begin mating. It is said that the mating rate is heavily influenced by the temperature with the optimum occurring at 23 degrees [9] —an indication that mating can only occur in the late season. Once the mating season is over, all but the inseminated females survive, and they go on to seek shelter to hibernate over the winter period.
To this end, the seasonal temperatures have a profound impact on the life cycle of the Bombus population from triggering their release from hibernation to egg production and mating. As temperature in the UK during the summer has shown a steady increase over the last sixty years, its impact on the wider insect phenology is of great concern. This study investigates the effect of the temperature rise on the Bombus population, as they have a key role within the pollination community and, thereby, have serious implications on the local fauna and flora [10]. In particular, this study aims to unravel how the increasing seasonal temperatures in the UK has affected the Bombus phenology by delving into the main stages of their life cycle and investigating how temperature influences the size of Bombus population. The study also investigates how the seasonal temperature changes may affect the sphere of activities of the Bombus population at each stage of their life cycle by analysing their geographical trend overtime and movement.
Literature Review
Discussion surrounding the change in bee populations has been pursued for some time. Trends in the reduction and distribution of bee populations have been documented since the 1960’s with longitudinal and long-term analysis beginning to occur in the 1980’s [11]. Some of the first indicators of climate changes were studied by investigating the spatial distribution of certain Bombus species, with some disappearing from their native lands and others migrating to different areas (Williams 1982). The potential reasons for local declines have been explored since then, and several studies have reported the loss of agricultural sites [12], reduction in the availability of preferred flora [13], parasite invasion [14], the increased presence of electromagnetic radiation [15] and, above all, rise in the temperature. The UK has seen rise in local temperatures with the summer season being affected particularly heavily. Climate models predict that, without the mitigation of greenhouse gases, the possibilities of extreme heat (beyond 40 degrees Celsius) will be common in the foreseeable future [2]. The consensus amongst the literature points towards increasing temperatures negatively impacting the Bombus population, namely due to the deficiency in flight performance and the lack of colony productivity [16-18] reported that, due to the rising temperature in the UK, the start date of summer has advanced by an average of three days per decade since 1954. As of 2007, the summer start date stood as the 7th of May: 18 days prior to that in 1954. This shift in the start date of summer implies that the exit from hibernation for Bombus species may have also advanced, as a queen’s emergence from dormancy is dictated by the temperature [19]. This assumption has been indeed recently proven by a group of researchers who studied the association between the temperature and the stages of the Bombus life cycle over a 35-year period in Central Europe [20]. They found that the rising temperatures are advancing the flight period by an average of 10-23 days. This piece of research had focused on four particular Bombus species and determined that, with an increase in temperature, both the emergence of queen bees and flight period had advanced. As mentioned earlier, the flight period begins when worker bees first exit the nest to begin foraging which continues throughout the entire summer. As the summer in the UK is advancing, this also indicates that the foraging period may not only be advancing but extending in length.
Kirbyshire and Bigg (2010) [18] also note a delay in the onset of autumn. The first frost date has generally been recorded later and later over a 50-year period, which suggests that winter is contracting on both ends. A more detailed study was also performed in the form of comparative analysis across 37 different climate models. The results showed that winter had contracted at an average rate of 2.1 days per year since 1952 and increased in temperature by 0.26 degrees every decade [21]. While findings by Guan and Yuping (2021) [21] is an aggregate across the entire northern hemisphere, it supports and develops on the study by Kirbyshire and Bigg (2010) [18]. As the Bombus mating period occurs between late summer and early autumn, the contraction of winter and the delay in the arrival of autumn may be also causing a delay in their mating period. Previous research on the association between the temperature and the Bombus lifecycle has reported varying findings. In many cases, they were studied under controlled temperatures where a set of bees were monitored over a period of time, and temperatures were artificially increased and decreased to study the optimum efficiency. These studies were aimed at identifying optimum temperatures to certain stages in a bee’s life cycle. For example, Kenna et al. (2021) [16] determined that the thermal performance of a bee is retained up to 27 degrees, suggesting that foraging activities during the summer months may be undermined if the temperature exceeds this limit. Another study showed that the queen exits hibernation between 5-9 degrees of temperature [19], suggesting that queens may emerge sooner if winter begins to become warmer. While research in the Bombus behaviour is rife, studies on the migration of or change in the spatial distribution of the Bombus population is limited. To date, most research papers have been in controlled environments, as it is difficult to monitor and assess the natural movement of bees. At the same time, there have been reports of a mass migration of bumble bees, mainly reported in the research domain of bird’s migration. The location of the new habitats of Bombus is unknown, but Fijen (2020) [22] suggests that they may be moving towards the north-east of their previous respective territories on the northern hemisphere. Research surrounding more local migrations has also been limited. One of the few exceptions was the study conducted by Williams (1982) [11] on the change of distribution in pre- and post-1960 Britain. They studied the distribution of all main British Bombus species and found that many species that were present pre-1960’s had either disappeared from the native area or had moved to neighbouring areas. They had also noted that the Bombus species have seen an overall reduction with those in more isolated areas becoming extinct. They concluded that this was due to the reduction in the favoured flora. However, in recent years, many of insect migration and related changes are being revisited and are considered to be triggered by the increase in temperature. Nevertheless, confirming the association between insect migration and temperature change is deemed quite complex, as it requires synthesis of knowledge from various domains such as meteorology, remote sensing and climatology [23]. This requirement for the combination of advanced knowledge from a variety of topics may be the reason why there is so little research studying the topic of temperature and insect migration, especially the correlation between bumble bee migration and temperature.
In a Bombus colony, the Queen bee is a lead figure and influences every stage of their life cycle. As mentioned earlier, her role as a Queen starts when she exits hibernation in spring. Makinson et al. (2019) [24] monitored the flight movement of Queen Bee’s in the county of Hertfordshire during a two-week period in 2015 to understand what dictates her flight and direction. They had inserted transponders into artificially hibernated Queens and tracked them using a harmonic radar system which recorded their GPS co-ordinates during their journey. Their results through random walk modelling (due to an expected unpredictability of queen’s flight movement) found that Queens spent more time resting than actively flying; on average, Queens fly 3 km to find their nesting site. They also note that there is no common pattern on their dispersal and, as Queens exit hibernation, they start moving at different angles randomly. The team also went on to analyse whether the Queens’ flight and distance were affected by wind direction, wind speed or solar hours; but concluded that none of them had any influence. This indicates that these climate features are not affecting the queen’s behaviour at exit, and that rise in the temperature may still be a key influencing factor.
Pawlikowski et al. (2020) [20] studied the influence of the temperature on Bombus sightings. They recorded the mean dates of the emergence of each bee type and period: first queen, first worker, first male and the beginning of the main flight period, end of main flight period, main flight and duration of main flight and performed 8 separate regression models for each respective type and period. They discovered that there was an advance in bumble bee foraging period over a 35-year period. They also discovered that the most significant change was in the Bombus’s flight period which occurs between June and July, and that this was the part of the life cycle that was affected the most by the change in temperature. The above review suggests that, while the association between temperature change and Bombus population, their lifecycle and their geographical movement have been investigated by some, it remains largely understudied, especially with respect to their spatial distribution. This study aims to analyse how the change in temperature is affecting the phenology and the spatial distribution of the Bombus Bumble bees. Specifically, we will explore the following questions: (1) which part of the Bombus cycle is affected the most by the increasing temperatures? and (2) how does the spatial distribution of the Bombus bees change? We will address them by means of exploratory data analysis and regression modelling.
Methodology
Datasets
The study area is the entire extent of the County of Oxfordshire, United Kingdom. It is located in Central England and provides a reasonable representation on the UK’s temperature change (i.e. no extreme changes of temperature anticipated). Historic data from the weather stations are also easily accessible. The data on the average maximum temperature was taken from the UK Meteorological (Met) Office archives between the years of 2011 and 2021 (Table 1). It shows a gradual increase in temperature over the 11-year period. The study period of 2011 to 2021 was determined by the quality of data available for the bumble bee sightings.
Table 1: Average Maximum Temperature in Oxfordshire County between 2011 and 2021
|
Jan |
Feb | Mar | Apr | May | Jun | Jul | Aug | Sep | Oct | Nov | Dec | |
|
2011 |
7 | 10.4 | 12.4 | 19.4 | 18.9 | 19.3 | 21.4 | 20.7 | 20.7 | 17.2 | 13.5 |
9.3 |
| 2012 |
9.8 |
7.3 | 14 | 12.6 | 17.7 | 18.9 | 20.5 | 21.8 | 18.4 | 13.4 | 10.1 | 8.6 |
|
2013 |
6.4 | 6.2 | 6.3 | 12.9 | 15.9 | 19.3 | 25.5 | 23.1 | 19 | 16.3 | 9.9 |
10 |
| 2014 |
9.3 |
9.7 | 12.8 | 15 | 17.1 | 21.5 | 24.9 | 20.8 | 21.1 | 16.8 | 11.5 | 8.7 |
|
2015 |
8.4 | 7.5 | 11.4 | 15.9 | 16.8 | 21.1 | 22.6 | 21.3 | 18.4 | 15.1 | 13.1 |
13.4 |
| 2016 |
9.4 |
9.1 | 10.2 | 12.9 | 18.4 | 20 | 23.3 | 23.5 | 20.9 | 15.1 | 9.4 | 9.6 |
|
2017 |
7.3 | 9.5 | 13.7 | 15.1 | 19 | 22.7 | 23.3 | 21.4 | 18.5 | 16.1 | 10.7 |
8.3 |
| 2018 |
8.9 |
6.4 | 9.1 | 14.2 | 19.9 | 22.8 | 27.4 | 23.4 | 20.4 | 15.6 | 11.7 | 10.2 |
|
2019 |
7.2 | 11.8 | 12.7 | 15.1 | 18 | 20.4 | 24.5 | 23.9 | 20.6 | 14.5 | 9.6 |
10.5 |
| 2020 |
11.4 |
10.5 | 11.4 | 17.8 | 20.4 | 21.6 | 22.5 | 23.5 | 20 | 14.2 | 11.9 | 8 |
|
2021 |
6.6 | 8.9 | 11.6 | 12.5 | 15.7 | 21.4 | 23.7 | 21 | 21.6 | 16.2 | 10.9 |
9.8 |
Bombus sightings in the Oxfordshire region between 2011 and 2021 (Table 2) was sourced from the National Biodiversity Network. It records the location where a variety of insects and animals were spotted. Data was retrieved between the years of 2011 and 2021, as data preceding 2011 was not sufficiently reliable to sustain robust analysis. While these records do not offer an exhaustive account of every spotting in the county, it provides a reasonable-sized sample of the population for analysis. It holds a total of 4130 sightings recorded throughout the 11-year period ranging across 24 different species. The data fails to categorize the individual bees, i.e. queen or worker. We note that data used for the bee spotting’s may have a degree of ‘chance sighting’ which can perhaps reduce the credibility of findings obtained through its analysis. Much of the literature studying phenology have mentioned the same issue; i.e. difficulty in finding data and hence one of the reasons this area has remained unexplored. However, bees are spotted throughout the entire county and across the year, thus implying that the entire county is being roamed for sightings. Sighting in each season is also very much in proportion with what we would expect from the bumble bees, i.e. less sighting in the winter and magnitudes more frequent in the peak of summer, then a decline in the late summer and early autumn. For this reason, we assume that the data is sufficient for investigating the relative difference in the frequency of sightings between different seasons.
Table 2: Bee Spottings in Oxfordshire County between 2011 and 2021
|
Jan |
Feb | Mar | Apr | May | Jun | Jul | Aug | Sep | Oct | Nov | Dec | Total | |
|
2011 |
8 | 20 | 17 | 46 | 40 | 5 | 1 |
137 |
|||||
| 2012 | 4 | 19 | 13 | 17 | 5 | 8 | 66 | ||||||
|
2013 |
1 | 2 | 30 | 40 | 75 | 76 | 81 | 17 | 6 | 2 | 1 |
331 |
|
| 2014 |
1 |
4 | 42 | 67 | 60 | 136 | 74 | 63 | 11 | 3 | 1 | 462 | |
|
2015 |
2 | 16 | 35 | 70 | 113 | 96 | 66 | 13 | 11 | 1 |
423 |
||
| 2016 |
2 |
14 | 56 | 34 | 114 | 101 | 52 | 28 | 4 | 1 | 406 | ||
|
2017 |
32 | 55 | 83 | 104 | 114 | 51 | 25 | 8 |
477 |
||||
| 2018 | 26 | 68 | 105 | 133 | 133 | 68 | 36 | 7 | 1 | 608 | |||
|
2019 |
14 | 26 | 46 | 39 | 92 | 92 | 156 | 40 | 16 | 1 |
579 |
||
| 2020 |
2 |
8 | 44 | 75 | 131 | 67 | 67 | 37 | 45 | 17 | 15 | 4 | 531 |
|
2021 |
11 | 9 | 20 | 10 | 11 | 11 | 11 | 10 | 5 | 10 | 1 | 1 |
110 |
| Total |
17 |
14 | 230 | 466 | 609 | 1011 | 821 | 594 | 229 | 82 | 21 | 8 |
4130 |
Models
This study uses OLS regression analysis to assess the influence of seasonal temperature (Table 1) on the number of bees (Table 2). The data are grouped into four categories for separate modelling, reflecting the four different stages in the Bombus life cycle as mentioned earlier. Here are the four models:
Model A (The Queen Model)
This model takes bee sightings between 1 January and 20 April, which is when Queen Bees are expected to exit hibernation to forage and seek nesting sites. While they mainly exit between late March and early April, some sightings were recorded in earlier months.
Model B (The Worker Model)
Existing studies refer to this period as ‘foraging’ or ‘flight’. This model takes on bee sightings between 15 May and 30 July, which is when worker bees are most prevalent.
Model C (Drone and Mating Model)
This model takes bee sightings between the dates 15 August and 15 September which is when worker bees have mostly deceased. The male bees survive on average 30 days to search for a mate.
Model D (New Reign Model)
This model takes on sightings between the dates 20 September and 10 December. During this phase, the inseminated females forage and seek hibernation sites to overcome the winter.
Due to lack of information on the classification of individual bees (e.g. queen or worker), we assume that the bee sightings during the respective period when a specific type of bee is most active (e.g. a queen bee in a period specified for Model A) are of that type of bee.
Once the regression models are executed, the most significant model will undergo spatial analysis. In order to investigate the extent and direction of any geographical change of the spotting data over the 11-year period, the spatial mean centre and the directional ellipses analyses are carried out. The mean centre will give an indication as to which direction, how quickly and how far the bees are migrating or spreading. The directional ellipses will give an indication of how they are geographically distributed during each period.
Analysis
Influence of Temperature on Bombus Sightings
The result of regression analysis shows a positive correlation between temperature and Bombus sightings in all models (Figure 1), which confirms the relationship of a higher temperature and a more frequent Bombus spotting. However, the influence of temperature on the Bombus spotting was statistically significant for Model A (The queen model) and Model B (The worker model) only, with p<0.05 of t-statistic for the regression coefficient (Table 3). On the other hand, the influence of temperature in Models C and D is statistically insignificant (with p>0.05), which means that there is little influence of temperature on bee sightings. The degree of goodness-of-fit of the regression model is in the order of Model A, Model B, Model C and Model D. This is shown in the R-squared values (Table 3).
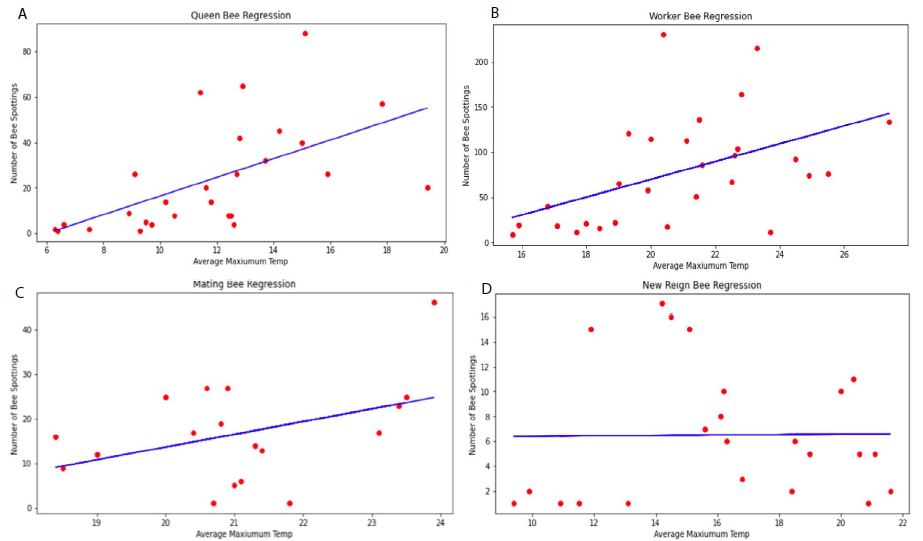
Figure 1: Results of the Regression Models: (a) Model A (The Queen model), (b) Model B (The worker model), (c) Model C (Drone & Mating Model), (d) Model D (New Reign Model).
Table 3: Key Statistics from the Regression Models
|
Coef (const) |
Coef (α) | t | P>|t| | R-squared | |
|
Model A |
-24.669 | 4.114 | 3.596 | 0.001 |
0.341 |
| Model B |
-127.306 |
9.848 | 2.824 | 0.009 | 0.235 |
|
Model C |
-43.480 | 2.858 | 1.823 | 0.087 |
0.172 |
| Model D |
6.267 |
0.016 | 0.052 | 0.959 |
0.000 |
The result generally confirms findings from past research in that it is difficult to understand how temperature affects the final stages of the Bombus cycle, as the influence the end of a season has on both fauna and flora is a lot more difficult to measure than that of early season [18]. Sparks and Smithers (2002) [25] also noted a similar challenge and asserted that phenological responses to temperature change is more prevalent in the early seasons and less so later [25]. Although climatologists have stated that the onset of autumn is seemingly delayed [21], it has not been transposed sufficiently enough in the Bombus population according to the two late season models, namely, mating and new reign; which makes it difficult to delve deeper into these two life stages. The queen model’ yielded the highest goodness-of-fit value and provides the regression model of y = 4.114x – 24.669. According to this equation, Queen Bees only exit hibernation once the temperature exceeds 6 degrees. This is supported by Alford (1969) [19] who reported that hibernation exit usually occurs once temperatures reach 6-9 degrees. This equation is only credible when the average maximum temperature is between 5-23 degrees; as the model was specified and performed within this range. Once the temperature exceeds 30 degrees, bee spottings are likely to decline as intense temperatures and humidity can have a negative impact on Bee morphology, impacting their flight performance [16]. Therefore, the assumption that the rising temperature brings forward the release of Queen Bees from hibernation can be considered to hold to a certain extent. Once this degree is reached, the rise in the temperature may result in the reduction of the number of Queen Bees present. However, this is yet to be seen until we see British winters reaching temperatures beyond 30 degrees. As such, this cannot be determined – only predicted. The analysis here found that an increase in seasonal temperature has a potential to increase the emergence of Queen Bees from hibernation and increase the number of worker bees. Although, the periods of mating and new reigns also show some form of positive correlation, their degree is significantly smaller than the periods of the earlier seasons (confirmed by a statistical insignificance of the regression coefficient and the model itself).
Bombus’s Migration
This section investigates the geographical movements of Bombus over time by drawing the Mean Centre and the Deviational Ellipse for different periods. The analysis focuses on the queen bees, as the regression analysis in the previous section found out that, among the four types of bees, Queen Bees are the most sensitive to the temperature change, and therefore can be regarded as a representative of Bombus on the reaction to temperature change.
Figure 2 maps the change in the mean centres and the deviational ellipses during the four periods of life cycles between 2011 and 2021. The figure firstly shows that the mean centre has consistently moved farther to the north-west as the years have progressed, which indicates that Queen bees—and hence their colonies—have also moved in this direction. The mean centre has moved each year covering a total distance of 16.24 km north-west during this period (Table 4). Although we do not see a direct proportionality between the temperature and the distance travelled, we note that, in the years between 2014-2016 and 2017-2019, there was a temperature reduction of 0.14 degrees, and the distance moved within this time was at its smallest at 3.7 km. The years between 2011-2013 and 2014-2016 showed a movement of 7.88 km with the temperature increased 0.89 degrees. The years between 2017-2019 and 2020-2021 showed a movement of 4.66 km, in response to the temperature increase of 0.45 degrees. The deviational ellipses show how the distribution of the Queen Bees have generally become more dispersed over the years, which is reflected in the size of the directional ellipse. If the size of the ellipse in the first time period was set at 1.0, that for the second, third and the fourth is 1.3, 2.5 and 1.1, respectively. The orientations of the ellipses are between 113° to 129.9° throughout the years, meaning that the orientation of the dispersion constantly expands north-west to south-east, which broadly consistent with their movement direction.
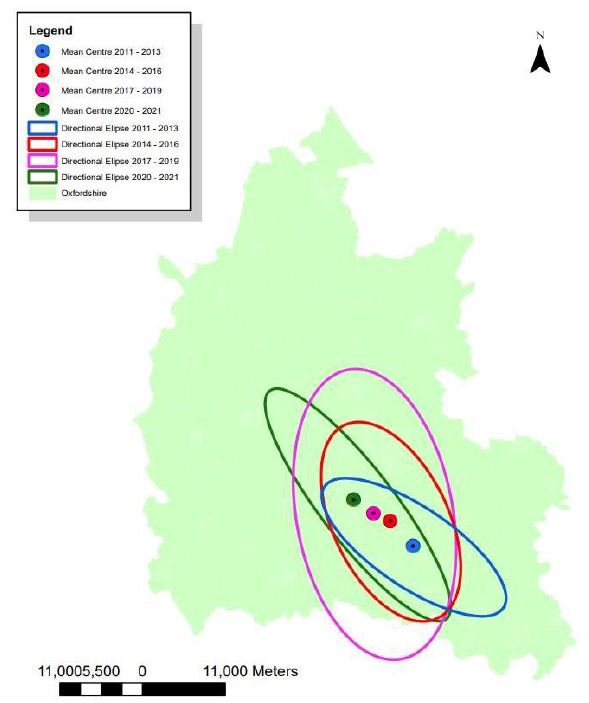
Figure 2: Change in the mean centre and the deviational ellipse (2011-2022)
Table 4: Mean Centre and Deviational Ellipses results
| Period |
Distance moved (km) |
Average Max Temp. (degrees) | Orientation of the ellipse (degrees) |
|
2011-2013 |
– | 8.87 |
113.01 |
| 2014-2016 |
7.88 |
9.76 | 129.59 |
|
2017-2019 |
3.7 | 9.62 |
148.64 |
| 2020-2021 |
4.66 |
10.07 |
129.86 |
Discussion
Findings from this study suggest that the increase in the temperature has clear influence on the Bombus phenology. Results from the regression analysis show that there is an impact of rising temperature on the emergence of Bombus in all stages of their life cycle, particularly the early two stages. The regression model performed most robustly for the Queen model, indicating that she is most vulnerable to the temperature changes. Therefore, it is logical to assume that as the UK climate warms and spring continues to advance, more and more queen bees will begin to emerge sooner. If her resources are abundant upon her release and she has the ability to forage off her desired flora, her colony may also emerge sooner. On the contrary, if her early emergence means her desired flora is not available, she will go on to produce a futile colony which will unlikely survive a season. Earlier emergence can also cause an imbalance of the rest of the cycle, meaning that the proceeding stages must not function at their optimum. This will cause the extinction and reduction of many Bombus species, which has already been recorded [26]. The result of the spatial analysis shows that bumble bees are gradually moving in the north-westerly direction, which coincides with findings in some of the literature [22]. In summary, the geographical patterns of the Queen bees are: (1) moving towards north-west, (2) becoming increasingly dispersed, and (3) their spread constantly expand in the directions of north-west to south-east. Overall, there seems to be some consistency in the movement of Queen’s suggesting that there is a common form of migration going on. Unlike Makinson et al. (2019) [24] who recorded that dispersion and flight of Queens are unpredictable; our study saw a consistent pattern with a clearly specified directionality. Oxfordshire has seen a general rise in its temperature during the winter to spring months over the past eleven years. Of course, temperature increases are not demonstrated as a definitive cause behind the bee migration, but this study shows that it could be a contributing factor to a Queen’s re-location. Increasing temperatures can also assist a Queen’s metabolic process and, therefore, she would be capable of flying farther afield to nest (Kenna et al. 2021) [16], the earlier she emerges from hibernation, the more time she is afforded to search for and building a nest, leading to a further distance being flown; whilst warmer winters are tampering with a queen’s thermal limits, possibly leading to flight confusion [27]. The theories for the Queen bee’s dispersal patterns are almost endless and perhaps open up other research areas.
While these findings are implied and may fall short of proving the causation for this shift to be the change in temperature, it is worth noting that much of the literature points toward warming climates as the reason for the general insect migrations. Past research has shown butterflies have chosen to move south and grasshoppers have migrated to neighbouring regions to accommodate their climate needs [28]. If Bombus continuously begin to move northbound, it may eventually create reduction in the Bombus population in the southern region; which in turn may have an adverse impact on the wildlife biodiversity due to pollination reduction. There is also an associated risk to the migration of the Bombus population, if they continue to migrate north. As bumble bees can only survive in temperate zones, their migratory locations are limited and, therefore, they may be forced into areas which cannot accommodate their needs, thus heading towards the death of a colony. On the other hand, Roff and Fairbairn (2007) [29] note that insects which migrate into areas that are inhospitable to their liking, could trigger a genetic variation to increase their chances of living in what may have been perhaps perceived as an extreme climate in the past. If another dataset with more details on Bombus sightings was to be identified, it would be interesting to see how other climate attributes may be potentially driving this migration such as rainfall and humidity. The result of the analysis would be also more accurate, if it contained classifications of the type of Bombus bee spotted; i.e. a queen or a worker, similar to that observed by Palowkowski et al. (2020). This would have enabled us to build a more clearly defined models based on the type of bees; as opposed to dividing the regression models using seasonal dates and assuming we assign the most likely bees in that respective period; and this forms another future aspiration. Further analysis on the Queen’s emergence from hibernation can be extended by repeating this project in other countries where Bombus bees are native, as this will give insights into whether the tendencies found in this study are a global phenomenon or a more localised tendency.
Data Source
Bombus Sightings between 2011 and 2021. Source: National Biodiversity Network. Available at: National Biodiversity Network (nbn.org.uk).
Oxfordshire Temperature between 2011 and 2021. Source: Met Office. Available at: National Meteorological Archive – Met Office.
References
- Damarre G, Rutishasher T (2009) Origins of the Word “Phenology”. Eos, Transactions, American Geophysical Union 90.
- Christidis N, McCarthy M, Stott PA (2020) The increasing likelihood of temperatures above 30 to 40°C in the United Kingdom. Nature Communications 11.
- Cook K, Vizy E (2015) Detection and Analysis of an Amplified Warming of the Sahara Desert. Journal of Climate 28: 6560-6580.
- Lauenroth WK, Epstein HE, Paruelo JM, Burke IC, Aguiar MR, et al. (2004) Potential effects of climate change on the temperate zones of North and South America. Revista Chilena de Historia Natural 77: 439-453.
- Rasmot P, Guillaume G, Terzo M (2021) Bumblebees of Europe and neighbouring regions, NAP Editions.
- Wahengbam J, Raut AM, Pal S, Banu N (2019) Role of Bumble Bee in Pollination. Annals of Biology 35: 290-295.
- McFrederick QS, LeBuhn G (2006) Are urban parks refuges for bumble bees Bombus spp. (Hymenoptera: Apidae)? Biological Conservation 129: 372-382.
- Sarro E, Sun P, Mauck K, Rodriguez-Arellano D, Yamanaka N, et al. (2021) An organizing feature of bumble bee life history: worker emergence promotes queen reproduction and survival in young nests. Conservation Physiology 9. [crossref]
- Belsky JE, Camp AA, Lehmann DM (2020) The Importance of Males to Bumble Bee (Bombus Species) Nest Development and Colony Viability. Insects 11. [crossref]
- Baur A, Strange JP, Koch JB (2019) Foraging Economics of the Hunt Bumble Bee, a Viable Pollinator for Commercial Agriculture. Environmental Entomology 48: 799-806.
- Williams P (1982) The Districution and Decline of British Bumble Bees. Journal of Agricultural Research 21: 236-245.
- Carvell C, Roy DB, Smart SM, Pywell RF, Preston C, Goulson D (2006) Declines in forage availability for bumblebees at a national scale. Biological Conservation 132: 481-489.
- Bommarco R, Lundin O, Smith HG, Rundlöf M (2012) Drastic historic shifts in bumble-bee community composition in Sweden. Proceedings: Biological Sciences 279: 309-315.
- Meeus I, Brown MJ, De Graaf DC, Smagghe G (2011) Effects of invasive parasites on bumble bee declines. Conservation Biology 25: 662-671. [crossref]
- Lazaro A, Chroni A, Tscheulin T, Devalez J, Matsoukas C, et al. (2016) Electromagnetic radiation of mobile telecommunication antennas affects the abundance and composition of wild pollinators. Journal of Insect Conservation 20: 1-10.
- Kenna D, Pawar S, Gill RJ (2021) Thermal flight performance reveals impact of warming on bumblebee foraging potential. Functional Ecology 35: 2508-2522.
- Guirad M, Cariou B, Henrion M, Baird E, Gérard M (2021) Higher developmental temperature increases queen production and decreases worker body size in the bumblebee Bombus terrestris. Journal of Hymenptera Research 88: 39-49.
- Kirbyshire AL, Bigg GR (2010) Is the onset of the English summer advancing? Climatic Change 100: 419-431.
- Alford DV (1969) A Study of the Hibernation of Bumblebees (Hymenoptera:Bombidae) in Southern England. Journal of Animal Ecology 38: 149-170.
- Pawlikowski T, Sparks TH, Olszewski P, Pawlikowski K, Rutkowski L, et al. (2020) Rising temperatures advance the main flight period of Bombus bumblebees in agricultural landscapes of the Central European Plain. Apidologie 51: 652-663.
- Wang J, Guan Y, Wu L, Guan X, Cai W, et al. (2021) Changing lengths of the four seasons by global warming. Geophysical Research Letters 48.
- Fijen TPM (2020) Mass-migrating bumblebees: An overlooked phenomenon with potential far-reaching implications for bumblebee conservation. Journal of Applied Ecology 58: 274-280.
- Sujayanand GK, Karuppaiah V (2016) Aftermath of climate change on insect migration: A review. Agricultural Reviews 37: 221-227.
- Makinson JC, Woodgate JL, Reynolds A, Capaldi EA, Perry CJ, et al. (2019) Harmonic radar tracking reveals random dispersal pattern of bumblebee (Bombus terrestris) queens after hibernation. Scientific Reports 9.
- Sparks TH, Smithers RJ (2002) Is Spring getting earlier? Weather 57: 157-166.
- Lopez O, Koch J, Morales M, Navarette D (2021) Reduction in the potential distribution of bumble bees (Apidae: Bombus) in Mesoamerica under different climate change scentarios: Conservation implications. Global Change Biology 27: 1772-1787. [crossref]
- Oyen KJ, Giri S, Dillon ME (2016) Altitudinal variation in bumble bee (Bombus) critical thermal limits. Journal of thermal biology 59: 52-57. [crossref]
- George M (2022) Migration of butterflies. Kerala Forest Research Institute 17: 844-847.
- Roff D, Fairbairn DJ (2007) The Evolution and Genetics of Migration in Insects. BioScience 57: 155-164.