Abstract
Female respondents each evaluated sets of 48 unique vignettes, comprising messages about new regimens for ‘beauty from within’. The messages were sales and information messages that might likely appear in an advertisement. Respondents rated believability in the messages presented by the vignette, and from a set of different prices selected the price they would pay for the product described by each vignette. Deconstructing the rating assigned to a vignette into the contribution of the messages revealed three strong minds when the criterion was ‘believability; MSB1 – Make your inner self come alive and real; MSB2 – Appeal to authority and tradition; MSB3 – Reinforce the power for beauty within by hypnosis. Deconstructing the price rating revealed two strong mind-sets; MSP1 – Appeal to secret ‘formula’; MSP2 – Ease and convenience; and one weak mind-set. All six mind-sets show similar patterns of price would pay versus belief, even though each mind-set differed in the patterns of what it believed, or in the patterns of what it would pay. The approach, using Mind Genomics, shows how topics of everyday experience can become inputs for a science of ordinary human behavior.
Introduction
The pursuit of beauty is and has been a long-term affair in the history of humankind. Beauty, however defined, is always sought after. What makes the topic so interesting is that the search for beauty seems to be almost universal. People want to look good for themselves and to others. The exact methods by which this goal is accomplished depend on the historical eras, the available technology, the particular conception of what is beauty, and finally the ‘zeitgeist,’ and the ever-changing technology of the time.
One can scarcely open any media and successfully elude the barrage of stories and advertisements, all talking in an increasing babble about one or another aspect of ‘beauty.’ What was a simple world a century ago after World War I have morphed into a cacophony. Beauty is no longer ‘skin deep’ but has migrated to all parts of the body and the brain. One need only look at the stories in the paid advertisements to realize that beauty has migrated to the world of Estee Lauder three quarters of a century ago to the world of good living, meditation, hypnotism, and so forth. All are things, behaviors, ways of thinking to which beauty is attached, and which can enhance beauty.
In the 1980’s and 1990’s the author wrote two books on cosmetics and personal products [1,2]. The research in those books was based upon the emergent science of psychophysics, the study of the relation between physical stimulus and subjective responses. During the formative years of the author’s scientific career, 1969-1985, a great deal of the work with done with product developers, interested in the laboratory-level improvement of cosmetics, toiletries, and fragrances. Colleagues and clients such as Morton Pader would encourage this effort
During the later years of the 1980’s, the author began to work with the marketing departments of companies, with the focus on how to communicate the benefits of beauty. The intense competition among the major cosmetic companies, as well as those large companies marketing the world of products known as ‘personal care’ drove interest into studying the mind of the consumer. The focus moved from how to formulate to achieve optimal acceptance and support of a positioning through just what to say. It became increasingly clear that there were no real databases about the mind of the consumer, despite the seemingly massive amounts of corporate data residing in the corporate files. The information available was one-off, focused, often being the ‘verbatims’ reported from focus groups and depth interviews, but almost no quantitative data. Even companies like Procter & Gamble, Inc., in Cincinnati, bastion of standardized methods, could not or would not produce books about messaging, although they were able to produce books about standard research methods.
It was in the early to mid-1990’s that the approach used here, Mind Genomics, would emerge to create the necessary structured database about the mind. Mind Genomics is a science which studies through experiments the perception of the person’s everyday world [3,4]. It is the application of Mind Genomics to the new world of ‘beauty from within’ which will be the subject of this paper.
Method
Through a disciplined approach using statistical experimental design, Mind Genomics combines elements describing daily experience (messages), creating vignettes. The vignettes comprise simple combinations of these elements, one element atop the other in an easy-to-read format, viz., without connectives. The respondent scans the vignette, viz., this combination of elements, and assigns a rating on the scale(s) provided. The analysis deconstructs the response to the combinations, revealing the part-worth contribution of each element.
This seeming ‘round-about’ way to understand the strength of each element has several built-in positives.
Ecological Validity
In our normal lives we don’t evaluate one stimulus at a time in splendid isolation, even though that approach is taught as the epitome of good science. People experience the stimuli in combinations, ideas fighting each other for attention. Mind Genomics attempts to reproduce a world of ‘bustling confusion.,’ and within that world suffused with noise estimate how each element performs.
Reduction of Bias
Often respondents attempt to ‘guess’ what the researcher wants, and assign the desired answer, rather than the answer which truly reflects the way the individual respondent feels. All one has to do is ask people to describe their food shopping behaviors and their food pantries to end up with a description of what seems to be a healthy diet filled with the foods that are highly recommended. Closer inspection of the houses of such individuals often reveals a lot of junk food. Similarly, people who vote and then participate in an exit poll or a qualitative interview often do not give an honest answer when asked for whom they voted. The effort to appear politically correct may undercount some candidates who held publicly unpopular yet meaningful and attractive points of view about social situation. Former President Donald Trump provides an example. Votes for Trump were undercounted because the participants in the poll were often subtly positive but felt that the interviewer would feel negatively about them were they to state their positive feeling.
Ability at the Level of Each Individual to Understand How the Elements ‘Drive’ the Ratings
The Mind Genomics method works by creating experimental designs (combinations of elements into vignettes), and with the property that each individual respondent evaluates the precisely correct combination of elements in the 48 vignettes so that one can use statistical methods such as OLS (ordinary eat-squares) regression to relate the presence/absence of the 36 elements to the rating, or to a specified transformation of the rating [5]. In behavioral science the ability to do all of the analyses at the level of the individual (within-subjects design) means that the respondent ends up providing all of the relevant information. There is no immediate need to work with data beyond one person to understand the pattern of results generated by that one person.
Evaluation of More of the Design Space
Every respondent evaluates a unique set of combinations, allowing the research to explore a great deal of the so-called design space, the space of possible combinations. This set of individual sets of combinations means that in our study of 100 respondents, each of whom evaluated 48 different combinations, the study actually covered 4800 different combinations. The benefit of covering a lot of the design space is that the research becomes an exploration, a cartography of new to the world topic, rather than requiring the researcher to evaluate the most likely test combinations to prove or disprove a hypothesis. Mind Genomics becomes an exploratory tool for new knowledge, a tool which helps one understand the topic at a macro level. [6]
Explicating the Process with the Study on Hypnosis and Inner Beauty
With the foregoing in mind, we now proceed to the study of a new way of thinking about beauty, beauty from within. The actual study came from a discussion with Wendy Packer of Westchester, New York, around 2013. The issue was whether Mind Genomics could provide a way to quantify what was believable in some of the topics and claims, and for what was something for which respondent would pay. The author immediately offered to ‘try out’ the different messages, in a simple exploratory study, to see what would emerge. The paper is the result of that effort. What is important to keep in mind is that the templated version of Mind Genomics allows the researcher to setup the study, get the respondents, run the study, and receive the data almost automatically in an hour or two [7]
Step 1: Create the Raw Materials, Comprising Questions (Aspects) and Answers (Elements, Test Messages)
This first section is the hardest. Once the study is named, a step requiring the researcher to summarize the study in a word or two, the task becomes harder. The researcher has to develop a ‘story,’ within that story ask six questions which flow in reasonable order, and then for each question provide six answers. Table 1 shows the final set of six questions, and each question having six answers.
Table 1: ‘The final set of six questions and six answers (elements) for each question
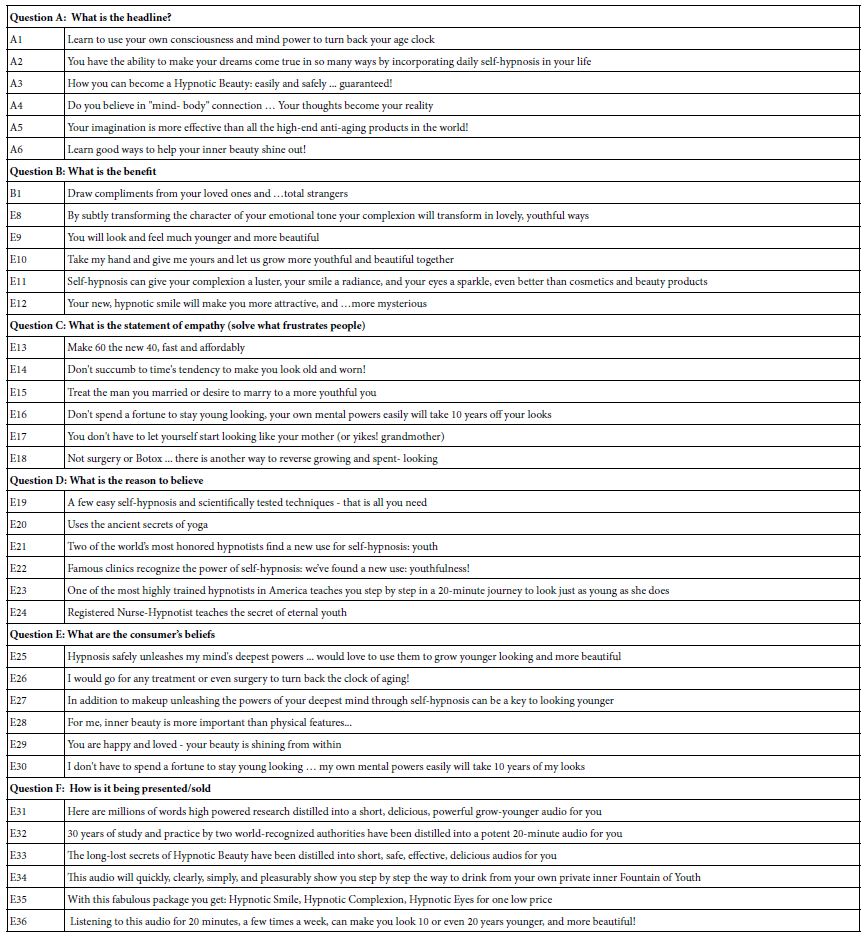
This initial exercise may seem easy to the reader, but the task is often daunting, mostly for beginning researchers, but occasionally for experienced researchers as well. The researcher must create a set of questions or topic statements which tell a story. The story need not have a plot. Rather the story will end up being a set of questions which seem plausible when stated. In turn each question requires six answers.
The above-mentioned task often drives the researcher to abort the study as it is being developed. Our education system is reasonably strong in teaching us how to answer questions. It is critical thinking necessary to formulate the questions in a way which becomes hard. We are accustomed to one at a time questions, the questions not being part of a story. Making the researcher produce a story can be frustrating for the researcher.
The act of developing the ‘proper’ questions and the array of possible answers (elements) for these questions often becomes the most important part of the learning process. One might think that the experiment itself with real respondents does most of the teaching. Three decades of working with Mind Genomics and its antecedent, IdeaMap® have continued to show them that much of the learning occurs in the up-front preparation, and that in effect the benefits of IdeaMap end up being the co-creation of insight by the research during the up-front set-up along with information gleaned from the respondent in the actual experiment.
Step 2: Create the Instructions and the Rating Questions
In this earlier version of Mind Genomics, the study ended up focusing on two aspects of the topic, believability, and value, respectively. The practical aspects of the topic led naturally to study these two issues as the core of what was needed for the practitioner to discover. The first issue was ‘would anyone believe this statement,’ which answer would emerge after the deconstruction of the rating of believability assigned to a vignette into the part-worth estimates of believability of the component elements. To the practitioner, having a statement which is believable is of paramount importance.
The second topic aspect was the expected price that the element could command. From the practitioner’s viewpoint it is always important to offer something which respondents are willing to purchase, rather than offering something for which they are not willing to open their pocketbook, expecting it to be free.
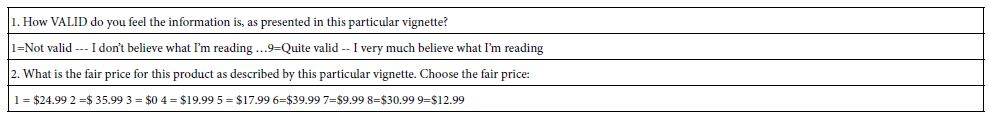
Table 2 shows the orientation scale, and the two rating questions. Each rating question was transformed into a format mor easily used by the computer in regression analysis. For the first rating question, believability, ratings 8-9 were transformed into the top part of a two-part scale, believable. For the same first rating scale, the ratings of 1-7 were transformed into the bottom of the two-part scale, not believableFor price; the selected price became the rating of value.
Table 2 also presents a set of self-profiling questions, completed by the respondent. The self-profiling questions enable the researcher to understand more about WHO the respondent is, what the respondent DOES, and what the respondent BELIEVES. This information can come only from the respondent or from a deep analysis of data available for sales, data that has to be combed through to create a partial profile of the respondent. It is far easier to ask the respondent to profile herself.
Table 2: Belief scale, price scale
Step 3: Execute the Mind Genomics Experiment on the Internet
The standard approach is to recruit respondents who are pre-qualified, usually individuals who are members of an online panel. It is tempting to save money by recruiting individuals who one knows, and who can be persuaded to ‘volunteer.’ Although the use of unpaid respondents may seem to be a cost saving, rarely does it ever turn out to be so. The study may take at least 20-50 times longer to complete, as the researcher hunts for willing, qualified respondents. In light of this, the Mind Genomics system works with panel providers, companies which specialize in providing qualified respondents, doing so in a matter of hours, not weeks.
The respondents were recruited with the panel provider. Today’s studies are done with Luc.id Inc., a panel provider with the ability to source respondents from around the world. The study was done in 2012, a decade ago with an entirely different company. The study was completed in a matter of our hours, from launch to completion. The Mind Genomics system sends out the test elements and constructs them on the site. The respondent reads the introduction, is presented with each screen (48 screens altogether, each with 3-4 elements, according to the vignette), rates the vignette on the two questions, and then immediately proceeds to the next vignette
Step 4: Acquire the Data Format the Data for Analysis
Each respondent generates 48 rows, one row for each of 48 different vignettes that a respondent evaluates. The database comprises three sets of columns. The first set of columns defines the respondent, and the information provided by the respondent about herself from the self-profiling questionnaire. This first set of columns remains the same for all 48 rows, since it refers to the respondent, and not the vignette. The second set of columns contains one column showing the test order (1-48), and then 36 succeeding columns, one column assigned to each of the 36 elements in the design. For a specific column (the element) and a specific row (the vignette), the cell will either have a ‘0’ when the element is absent from that vignette, or a ‘1’ when the element is present in that vignette. This is called ‘dummy variable coding’ because the variable has almost no information except absent or present. The third set of columns shows the rating assigned to the vignette, the dollar value selected, and then two additional columns which are transformed values. The second to the final column is 100 when the rating was 9 or 8, denoting extremely or very believable, and 0 when the rating was 7 or lower, denoting modestly believable, or degrees of unbelief. The final column shows the actual dollar and cents value corresponding to the rating selected for the second question.
As preparation for the additional analysis, a vanishing small umber (<10-5) was added to every transformer rating for both belief (R98) or price. The vanishingly small number ensures that no matter what rating the respondent chooses, there is always variability associated with the rating, a requirement for regression analysis.
Step 5: Create a ‘Sneak Preview’ of the Data to Get a Sense of ‘How Well’ the Vignettes Performed
Even before we look at the strength of the individual elements, we can quickly assess how well we did. Figure 1 shows the distribution of ratings of believability (left panel) and the distribution of selected prices (right panel).
By itself, Figure 1 tells us little about the mind of the respondent. We could look more deeply into the data by a variety of different analyses, simply on the responses to the vignettes alone. Another analysis might be to look at the ratings at the beginning of the evaluation versus at the end of the analysis (viz., ratings assigned for test orders 1-3 vs ratings assigned for test orders 46-48). Do they differ, and if so, then how do they differ? Figure 2 shows this comparison. Figure 2 suggests a slight decrease in belief in the validity of what the vignette communicates, as well as a slight decrease in the price one would pay. What Figures 1 and 2 fail to do, however, is exploit the cognitive richness of the vignette embedded in the meaning of the elements, and then draw conclusions about the effect of order.
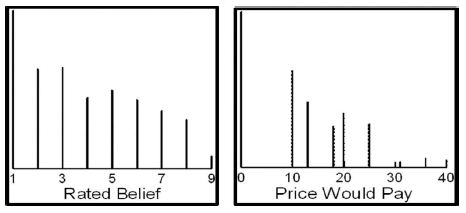
Figure 1: Distribution of the ratings of believability and price for the full set of vignettes
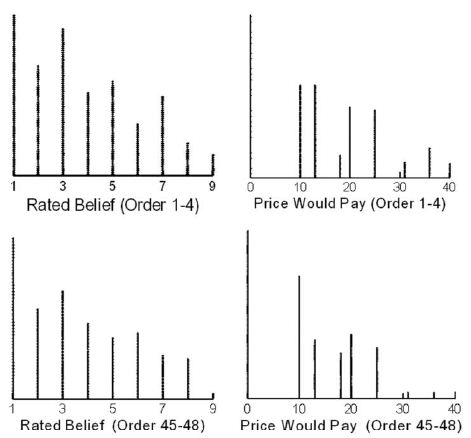
Figure 2: Distribution of the ratings of believability and price for the first four vignettes (order 1-4) versus the final four vignettes (order 45-48).
Step 6: Create an Equation Relating the Presence/Absence of the 36 Elements to the Transformed Rating
The equation is estimated by standard statistical techniques. The equation shows how each of the 36 elements ‘drives’ the transformed rating. The equation is developed for each respondent, respectively, as well as for groups. This ability to fit the equation, even at the level of the individual respondent, occurs because of the previously discussed process known as experimental design. The experimental design that we use in Mind Genomics is set up so that each individual respondent evaluates the precisely correct vignettes for a regression model.
The equation is expressed as: DV (dependent variable+ = k1A1 + k2A2…k36F6
The dependent variable is either the variable R98 denoting believable, or Price (the actual price chosen by the respondent).
We create this pair of equations for every subgroup of interest. The computer program (Systat, 2013) allows the researcher to input the variables (dependent, independents), to then select or not select the additive constant (we do not select), after which in less than 1-2 seconds, the statistical program has estimated and stored the parameters of the equation.
The key benefit of the analysis by OLS regression is that we now understand the data more deeply. Rather than treating each of our ratings as simply a ‘point’ and focusing on the general pattern created by those set of points, we can understand the ‘meaning’ of each point from knowing the text of each element. With that type of information, our questions about the data become more pointed, more realistic, and ultimately far more informative.
Table 3 shows the coefficients for the 36 elements. The left pairs of data columns show the elements sorted in descending order of believability, with the believability coefficient on the left, and the price coefficient to its right. The right pairs of data columns show the same elements, this time sorted by price, with price coefficient on the left, and the believability coefficient to its right.
Table 3: Self profiling questions and number of respondents choosing each answer
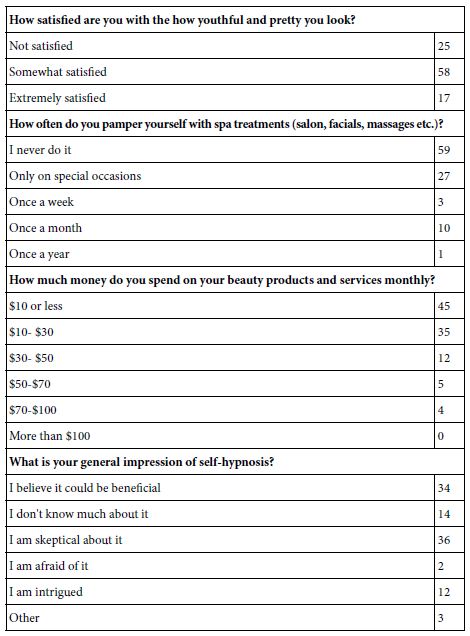
Table 3 presents a great deal of data. To enable the pattern to emerge we show all elements of coefficient of 6 or higher for R98 or price would pay (for the element) of $5.00 or higher. Noteworthy in Table 3 is the low coefficients for R98 (viz., low belief in the validity of the messages), and the low price that would be paid. Figure 3 shows the approximately linear relation between the degree of believability and the price that would be paid, both coefficients from the regression models presented in Table 3. We conclude from Figure 3 that respondents feel willing to pay more for elements whose validity they believe, although the relation is ‘noisy.’ Despite the noisiness, the linear relation gives one confidence that the data are internally consistent.
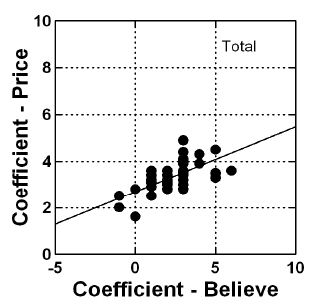
Figure 3: Scatterplot showing the relation between the coefficient for believability (abscissa) and the coefficient for dollars would pay (ordinate).
Step 7: Uncover Mind-sets Based Upon Coefficients for Believe, and Again Mid-sets Based on Coefficients for Price
A hallmark of Mind Genomics is the search for groups of like-minded respondents, the term ‘like-minded’ applied to similar patterns of responses to a granular topic. The world of consumer research is awash with different ways of dividing people, the most common being differences in who the people ARE [8], how the people THINK [9], and how the people BEHAVE [10]. The effort to create these different groups is significant so that the division of people into these groups, the process called segmentation, is reserved for the most important topics in the area, and becomes a seminal work generally not repeated because of effort and expense. The result is the macro-level segmentation of big topics and the efforts needed in turn to apply this macro-level segmentation to the world of the everyday, where it is most needed, and where ‘real life’ occurs.
The Mind Genomics approach works at the level of the granular, looking at simple-to-understand patterns of differences in responses to messages about a specific topic. Rather than working at the macro-level and trying to apply the general rules to the particular instance, Mind Genomics uses the pattern of responses to the specific topic to create the different groups, the segments, or in the language of Mind Genomics, the so-called ‘mind-sets.’
The segmentation into mind-set for our study proceeds in a simple manner [11].
- Create 101 individual-level models or equation, of the same form that we created above. Do this creation twice, once for the equation relating the element to R98 (believable), and then for the equation relating the elements to price.
- Beginning with the 101 individual level equations for believable, compute the ‘distance’ between each pair of the 101 respondents, using the formula Distance = (1-Pearson R). This distance will be 0 when the Pearson R (correlation) is 1.00, viz., the case where two respondents are perfectly aligned in their pattern of 36 coefficients. In contrast, this distance will be 2.0 when the Pearson correlation is -1, viz., when the two respondents are perfectly aligned in opposite directions.
- Cluster the respondents into two, and then three groups, such that the distances between the people in a cluster are small, whereas the distances between pairs of centroids of different clusters are large. This strategy ends up assigning people to clusters or mind-sets in a purely quantitative fashion. There is no conscious effort for the clusters to make sense.
- Invoke two rules, parsimony (fewer clusters are better than more clusters), and interpretability (the strong performing elements within a cluster should tell a coherent story).
- For this project three clusters made more sense than two clusters, even though the two-cluster solution was more parsimonious.
Table 4 shows the three mind-sets emerging from clustering on the basis of belief in the validity of the information. Table 5 shows a different group of three mind-sets, emerging from the clustering the basis of price.
Table 4: Coefficients of the 36 elements for the Total Panel, across the two dependent variables (believable via R98; price would pay in actual dollars).
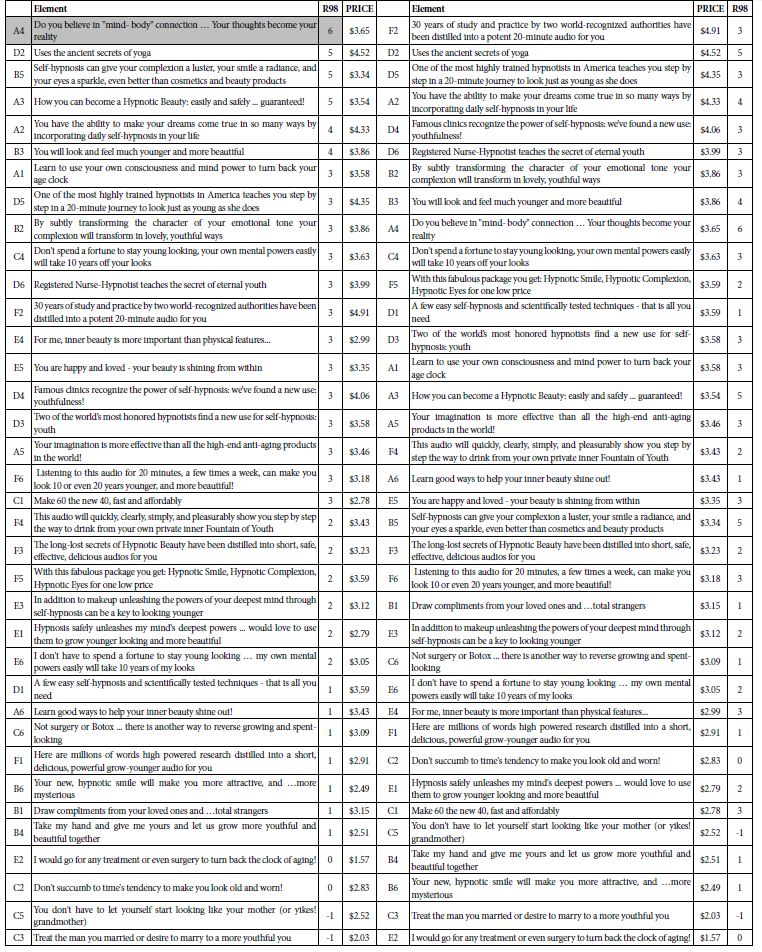
Table 5: Coefficients for Mind-Sets based upon belief in validity (DV = 98). Only positive coefficients 4 or higher are shown.
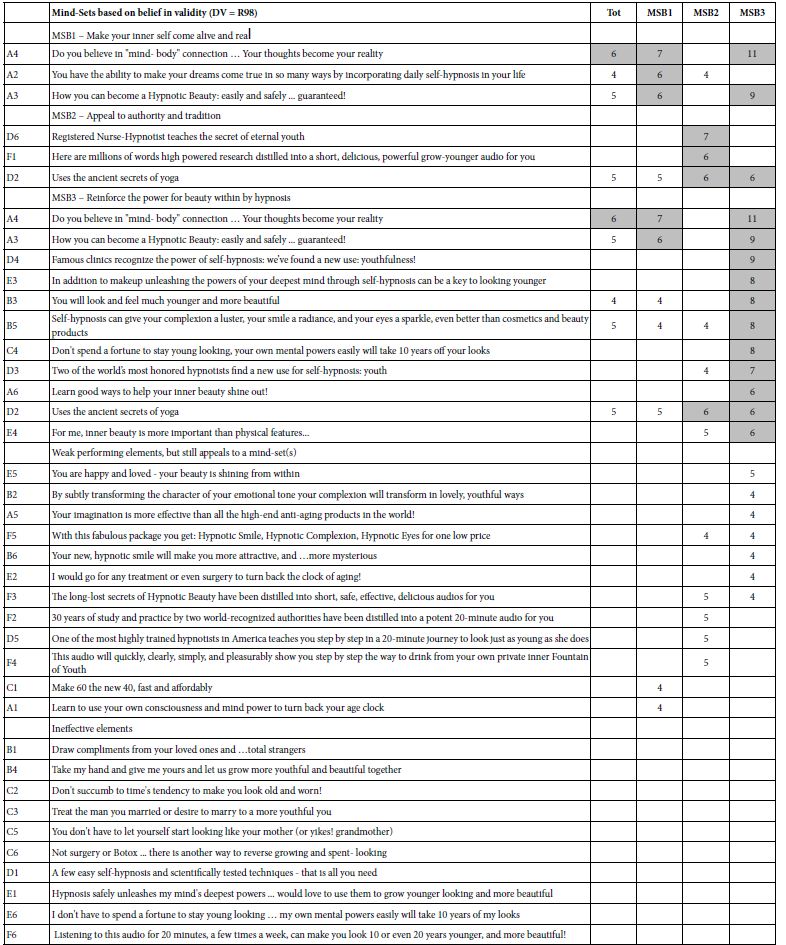
The segments are different. When we extract three mind-sets for each dependent variable, we find that the mind-sets emerging from the emotion reaction (R98; believe in validity) seem to the author be authentic and compelling. In contrast, the mind-sets based upon price seem to be more conventional. Furthermore, although we pull out three mind-sets for price, the reality is that there are probably two mind-sets, not three. The third mind-set (self-fulfillment) really only has one strong performing element.
Mind-Sets Based Upon Believe in Validity (R98)
MSB1 – Make your inner self come alive and real (N=47)
MSB2 – Appeal to authority and tradition (N=34)
MSB3 – Reinforce the power for beauty within by hypnosis (N=20)
Mind-Sets Based Upon Price
MSP1 – Appeal to secret ‘formula’ (N = 40)
MSP2 – Ease and convenience (N = 26)
MSP3 – Self Fulfillment (N=35)
Figure 3 shows a linear relation between coefficient of price (ordinate) and coefficient of believability (abscissa). Figure 4 shows the same plot, this time for the three mind-sets created by clustering coefficients for believability (MSB1, MSB2, MSB3), and for the three mind-sets created by clustering coefficients for price (MSP1, MSP2, MSP3). Surprisingly, the lines fit to the scatterplots are parallel to each other.
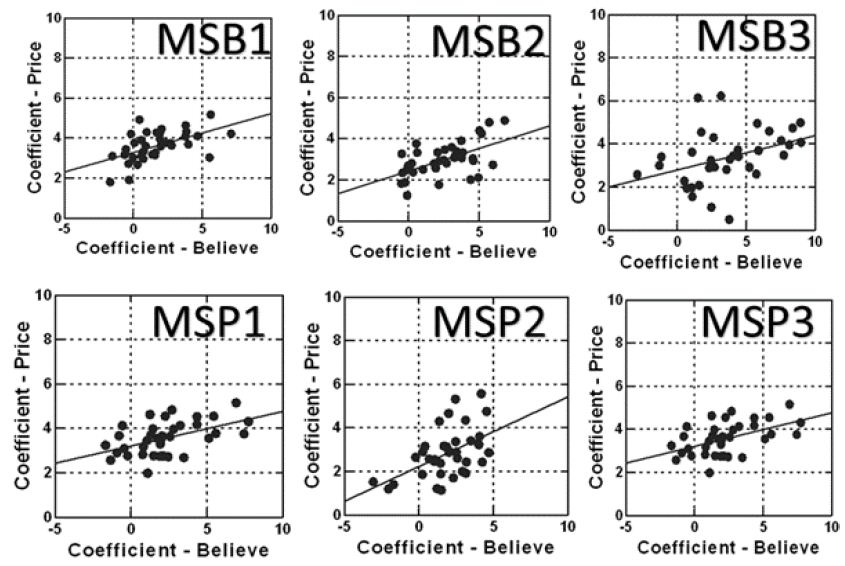
Figure 4: Scatterplot for the six mind-sets extracted from the data. MSB1-MSB3 were extracted from the coefficients for believability. MSP1-MSP3 were extracted from the coefficients for price.
Discussion and Conclusions
The study presented in this paper was done around 2012, a decade ago, and resurrected after a discussion about alternative forms of beauty that are available. During the course of the conversation the author recalled the study, returned to it, looked at the topics, and ‘worked up’ the data for publication. The realization then once again dawned. Here was a way to do science, motivated by a simple problem (quest for beauty), a world view (holistic), and a set of techniques (hypnotism and auto-suggestion).
A search through the scientific literature using Google Scholar® revealed little published information about hypnosis combined with beauty, and virtually nothing dealing with the appropriate messaging about the topic. There were papers and books dealing with the general benefits of hypnosis for better living, including enhanced beauty [12]. It is as if the idea of hypnosis and beauty was left to the popular press, and not invited to be studied by serious researchers.
At this point, almost 11 years after the study was done, remains the realization of the value of the process. On the one hand, it was easy to do in 2011-2012. One simply needed to collaborate with a person involved in beauty and with another person working in the world of hypnosis and psychodynamics (e.g., psychotherapy). The was no need for expertise, but simply a set of questions, and then answers each question, as well as two additional scales (believe, price, respectively) The rest proceeded virtually automatically, creating what might be called a ‘database of the mind’ in this exceptionally circumscribed topic of beauty emerging from hypnosis. The other key observation is the value of data about messaging in a specific, circumscribed topic, value which lasts decade, and no doubt longer.
References
- Moskowitz HR (1984) Cosmetic Product Testing: A Modern Psychophysical Approach. Marcel Dekker.
- Moskowitz HR (1995) Consumer Testing and Evaluation of Personal Care Products. Marcel Dekker.
- Moskowitz HR, Gofman A, Beckley J, Ashman H (2006) Founding a new science: Mind Genomics. Journal of Sensory Studies 21: 266-307.
- Moskowitz HR, Gofman A (2007) Selling Blue Elephants: How to Make Great Products that People Want Before They Even Know They Want Them. Pearson Education.
- Hardy MA (1993) Regression with Dummy Variables. Sage.93
- Gofman A, Moskowitz H (2010) Isomorphic permuted experimental designs and their application in conjoint analysis. Journal of Sensory Studies 25: 127-145.
- Moskowitz H, Itty B (2003) Jumpstarting product development: Competitive analysis and conjoint measurement in the cosmetic industry. Journal of Advertising Research 43: 62-77.
- Rangan VK, Chu M, Petkoski D (2011) Segmenting the base of the pyramid. Harvard business review 89:113-117.
- Wells WD (1975) Psychographics: A critical review. Journal of Marketing Research 12: 196-213.
- Kameniduou IC, Mamalis SA, Pavlidis S, Bara EZ (2019) Segmenting Generation Z cohort university students based on sustainable food consumption behavior: A preliminary study. Sustainability 11: 837.
- Likas A, Vlassis N, Verbeek JJ (2003) The global k-means clustering algorithm. Pattern Recognition. 36: 451-461.
- Blair F (2007) Self-hypnosis Revolution: The Amazingly Simple Way to Use Self-hypnosis to Change Your Life. Sourcebooks, Inc.