Abstract
The demand and investigation of groundwater are occasionally increased by the ever-increasing population and abrupt climatic changes. Groundwater is currently the most important source of fresh water, and many researchers are attempting to cover all aspects of this resource in order to achieve sustainable development. This scientific and academic research and studies are attempting to present a multi-range of techniques and methods focusing on groundwater pollution, potentials, assessment, and prediction. To delineate groundwater potential (GWP) zones in the Lower Omo-Gibe Watershed, Omo-Gibe Basin, Ethiopia, an integrated strategy of remote sensing (RS), geographic information systems (GIS), and multi-criteria decision analysis (MCDA) using analytical hierarchical process (AHP) was used. For this purpose, seven GWP influencing thematic layers comprising lineament density, slope, soil, drainage density, landuse landcover, geology, elevation and rainfall map were used. Scale values for the classes and thematic layers within them were determined using Satty’s AHP and based on expert and literary judgment. The thematic layers have been integrated via their rates using weighted overlay spatial function tool of ArcGIS to provide GWP map. The distribution and extents of different potential groundwater zone are 158.05 km2 (21.59%), 35.92 km2 (4.91%), 214.77 km2 (29.34%), 220.59 km2 (30.13%), and 102.72 km2 (14.03%) for very good, good, moderate and fair zone respectively. The study’s conclusions can be used to develop a groundwater action plan that will effectively protect the study area’s considerable groundwater resources. With regard to the long-term availability of groundwater, this research will be very beneficial to water management.
Keywords
Lower Omo-Gibe watershed, Omo-Gibe Basin, AHP, GIS, GWP, MCDA
Introduction
Groundwater is a valuable natural resource, and finding the best locations for groundwater recharge, monitoring wells, water supplies, and groundwater quality depends on exploration and wise management of this resource [1]. Given the constantly rising demand for freshwater, groundwater is a crucial freshwater resource for maintaining daily life in urban and suburban areas [2]. The importance of studying groundwater potential zones is based on the quantity, quality, and contamination of groundwater. The main causes of the consistent rise in freshwater demand are population expansion, the need for irrigation in agriculture, and climate change [3]. Groundwater as a substitute supply of fresh water has received serious attention due to the dangers of surface water pollution, rapid climate change, and the likelihood of droughts [4]. In order to keep the ecological balance of the earth system, groundwater is an essential part of the hydrological cycle. By providing freshwater for drinking, agriculture, and industry, it maintains life [5]. Because it is less polluted than surface water sources, which are easily contaminated by human activities like industrial and agricultural operations, groundwater becomes a significant alternative supply of freshwater in areas with a semi-arid temperature and environment [6]. Groundwater potential maps are available in many nations of the world, assisting planners and decision-makers in the development, distribution, and management of groundwater resources [1]. Groundwater accounts for one-third of all freshwater abstractions globally [7]. In many regions of the world where water supplies are limited, groundwater is a crucial natural resource for any economic and social growth [8]. Groundwater supplies are a necessity for all economic activity, both internally and outside. However, a study that combines remote sensing and GIS data can offer a good platform for the converging analysis of massive amounts of data using very advanced cognitive process techniques for groundwater exploration. Nations like Ethiopia are seeing a rise in groundwater demand as a result of the nation’s fast urbanization, population growth, and economic development. In the area under examination, groundwater is the most often used resource for agriculture, animal husbandry, and the provision of drinking water. The Lower Omo-Gibe watershed groundwater potential zone mapping will have a significant impact on the sub-basin. Since the Lower Omo-Gibe watershed is the main source of the Omo River, mapping the underground water would improve the nation’s groundwater resources’ sustainable management. Because of this, the current study is interested in delineating the groundwater potential zones within the study area using remote sensing and GIS technology. Seven determining elements were taken into consideration for the study: slope, landuse landcover, Lineament density, Geology, Elevation, Soil texture, and Drainage density. In order to ensure sustainable management and growth of the resource, groundwater exploration has recently seen a rise in the usage of remote sensing and geographic information systems (GIS). With the development of technology, more scientists are employing remote sensing (RS) and geographic information systems (GIS) to evaluate a basin’s groundwater supplies [5]. Geophysical technology-based groundwater exploration methods are expensive and time-consuming [9]. Due of these problems, humans have been forced to use a variety of technologies that can help them research vast areas in a brief amount of time while using few resources. These techniques, which include remote sensing and GIS, have been applied to find groundwater potential zones. Exploring the groundwater potential zone in varied geological settings is made simple and rapid with this method [10-13] Several scholars have employed the RS and GIS procedures to designate groundwater potential zones all over the world [14-17]. Utilizing RS and GIS, groundwater resources can be found and explored. Geology, geomorphology, slope, soil type, rainfall, land use/land cover, lineament structures, and drainage criteria are all important factors [18,19]. Geospatial technologies offer quick and affordable ways to evaluate spatial data across a range of geoscience disciplines [20]. For long-term resource management, it is essential to be able to locate the groundwater potential zone. It aids policymakers, decision-makers, and planners in making sure the groundwater resource is safeguarded from influences on both quantity and quality. The analytical hierarchy process (AHP) is one of the approaches to multi-criteria decision-making that is most frequently used [11]. AHP can be used to demarcate groundwater potential zones since it is an easy, quick, dependable, and efficient procedure [12]. When it comes to creating sustainable groundwater policies in this district, planners and policymakers will find this research to be a useful resource.
Materials and Methods
Study Area
The Lower Omo-Gibe River Watershed is about 2345.5 km² in area and is situated in the Omo-Gibe Basin, south Ethiopia. Lower Omo-Gibe Watershed (Figure 1) mainly covers South nation and nationality region and south-west Ethiopia region. Mirab Omo, South Omo and Basketo Zones are included in this watershed. Woredas such as Maji, Salamago, South Ari, Jinka town, Boko Dawula, Hamera, Nyngatom, North Ari and Mele koza. It has a southern boundary that is formed by the contained river basin that empties into Kenya’s Lake Turkana. The Lower Omo-Gibe watershed plain is distinguished by the fact that, although being rather flat, it has various beach ridges and depressions. It was formed very recently by the subsequent movements of Lake Turkana. The Omo delta, in the south of the Basin and at the northern end of Lake Turkana has aggraded to such an extent in recent years only some 25 km2 of the lake is in Ethiopia.
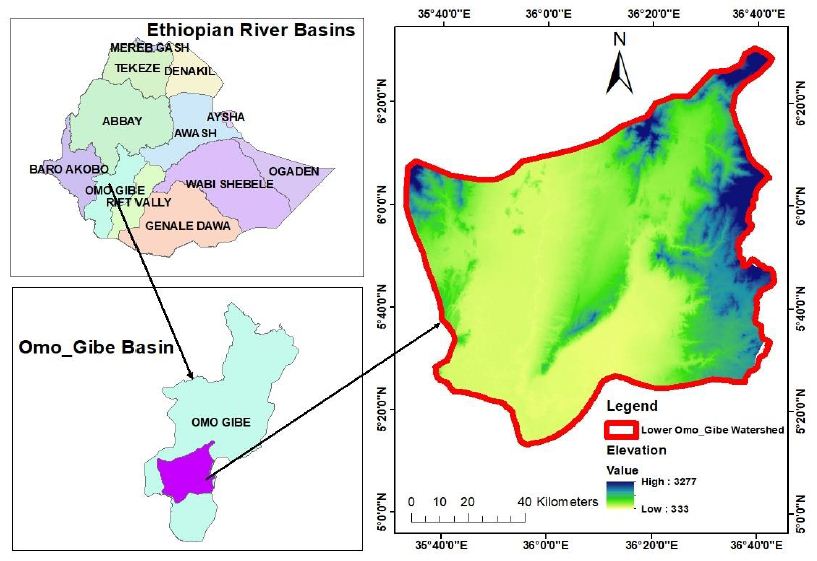
Figure 1: Location map of the study area
Methods and Data Analysis
The groundwater potential in this study was assessed using seven criteria including soil, lineament density, landuse landcover, slope, drainage density, rainfall, geology, For each criteria, thematic maps were created and utilized to assess the groundwater potential of the study area. In this study, the relationship between the variables that were utilized to forecast groundwater potential during weight calculation and the actual groundwater potential was analyzed.
Slope
In mapping groundwater potential, slope is a key factor [21]. It determines surface runoff and vertical percolation of water; hence, it affects groundwater recharge processes [22]. Slope was inversely related to infiltration [23]. Shuttle Radar Topography Missions (SRTM) 30 m resolution digital elevation model (DEM) was used to generate slope map. The slope map was classified into five classes (Figure 2) based on FAO classification standard (Sheng, 1990).
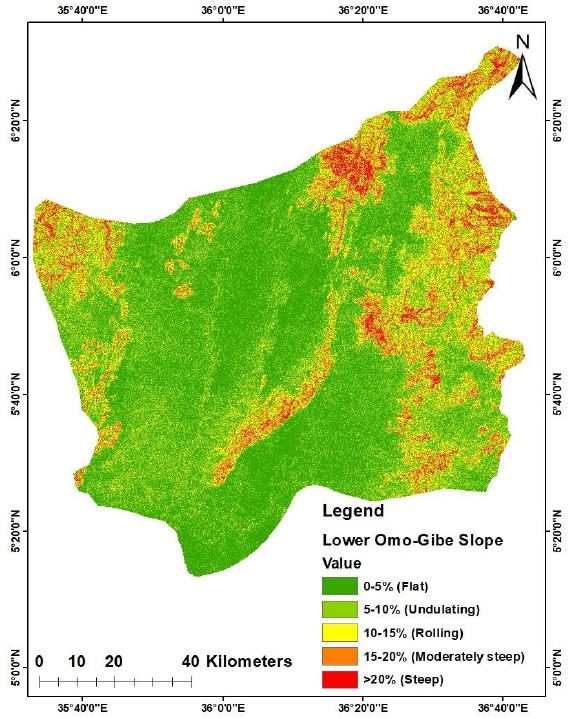
Figure 2: Slope map
Drainage Density
Drainage density has an impact on both the availability and pollution of groundwater. Lithology has an impact on the drainage system, which is a crucial gauge of infiltration rate. Drainage density has an inverse relationship with permeability [3]. As a result, it is a crucial component in determining the groundwater potential zone obtained from DEM data. Finding the length of the stream and dividing on to the total area of the basin as shown in the equation of Drainage Density DD=L (length/A (area) and using Archydro program [24]. The drainage-density map (Figure 3) was created by dividing themed river maps produced from a basin-wide flow accumulation (Fac) and stream definition operation [25].
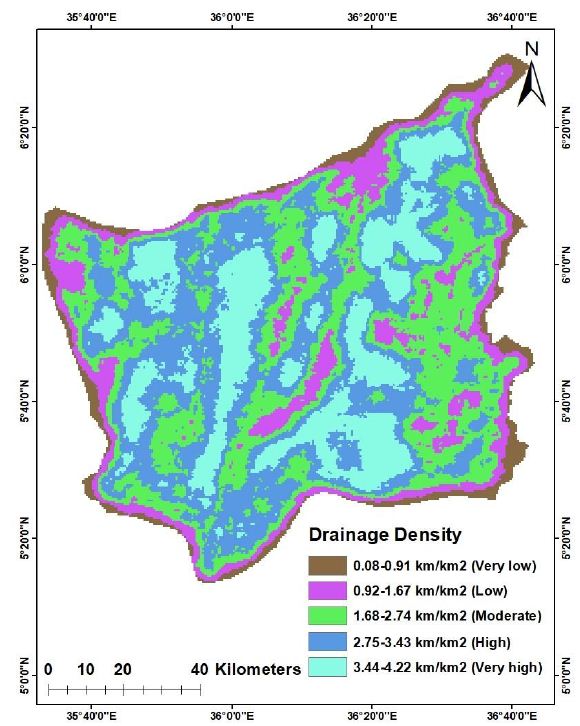
Figure 3: Drainage density map
Geology
The geologic environment has a significant influence on the existence and distribution of groundwater in any terrain [26]. One of the most crucial factors in evaluating groundwater potential zones is geomorphology, which relates to an area’s landform and terrain. It gives information on how different landform traits are distributed as well as information on numerous processes, including temperature changes, geochemical reactions, water flow, freezing and thawing, and more [27]. Geologic and Geomorphological maps created by translating length and measurement into kilometers (km), digitizing with the Arc GIS spatial analyzer application, and then saving the data as shape files. The geological structures were modified to raster file format with the corresponding presentation, and the region’s geological state was assessed. The following formula was used to compute the lineament (fault) density (LL) [28]. The geology of Lower-Omo Gibe watershed (Figure 4) characterized by tertiary extrusive and intrusive rock, tertiary, quaternary and Permian-Carboniferous.
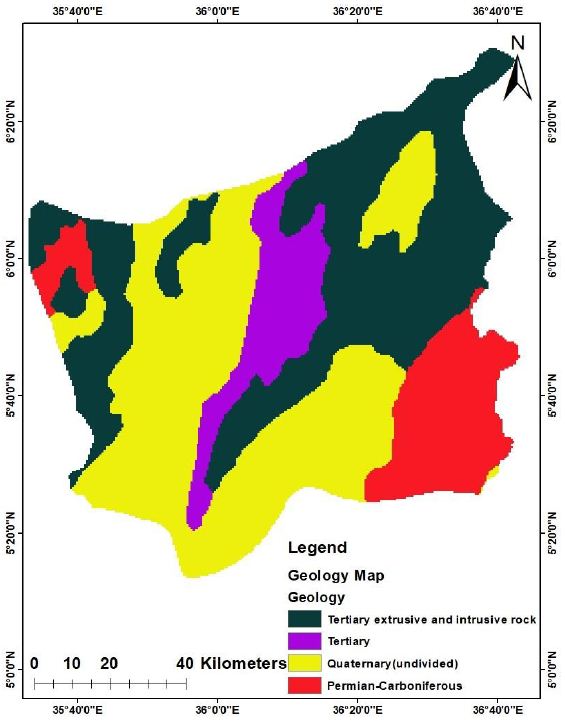
Figure 4: Geology map
Elevation
Elevation of the catchment ranges from 333 to 3277 m above sea level (Figure 5). High elevation was found in west and north edge of the study area and decrease toward east and south of the study area except topographically irregular and hilly areas. A higher weight is given for lower elevated zones and lower weight was assigned for highly elevated areas.
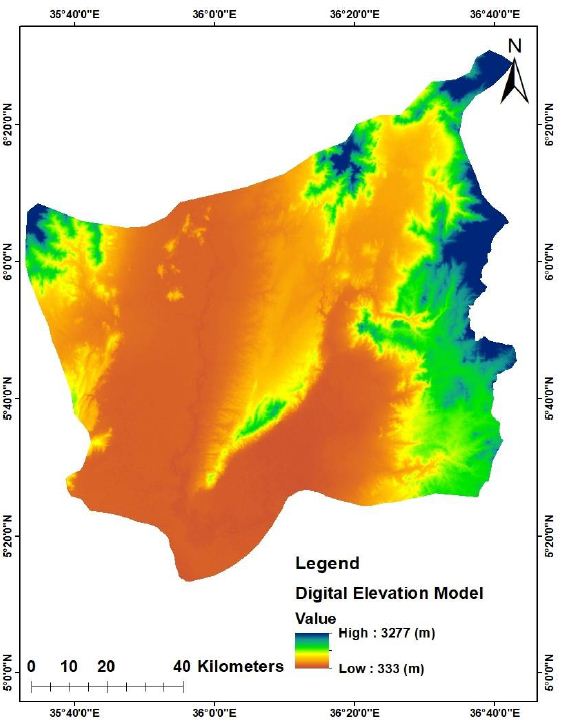
Figure 5: Elevation map
Landuse Landcover
One of the key determining criteria to pinpoint areas with potential for groundwater recharge is the landuse and landcover map [29]. Landuse and landcover have an impact on hydrological processes such evapotranspiration, surface runoff, and infiltration. Areas with vegetation cover have high groundwater potential than built-up areas that inhibits the infiltration of water into the subsurface [30]. From land use classes, built-up area has the lowest weight compared to other classes and crop land has the highest weight [31]. Landuse landcover offers essential details on infiltration, moisture, groundwater, and surface water in addition to suggestions on groundwater requirements. The primary coverings of the land surface by human activity or vegetation are referred to as landuse and landcover, respectively (natural or planted). The land-use type in the study area in accordance with the order of infiltration includes barren land, built up land, crop land, grass land, lichen mosses, open water, shrubs cover area, tress cover area and vegetation aquatic (Figure 6). The landuse landcover layer was obtained from the Ethiopia Sentinel2 LULC 2022. The boundaries in the layer were then visually evaluated using Landsat8 satellite images. Next, the land-use classes changed to the USGS standard classifications. Finally, the layer was entered into the GIS model after the necessary edits.
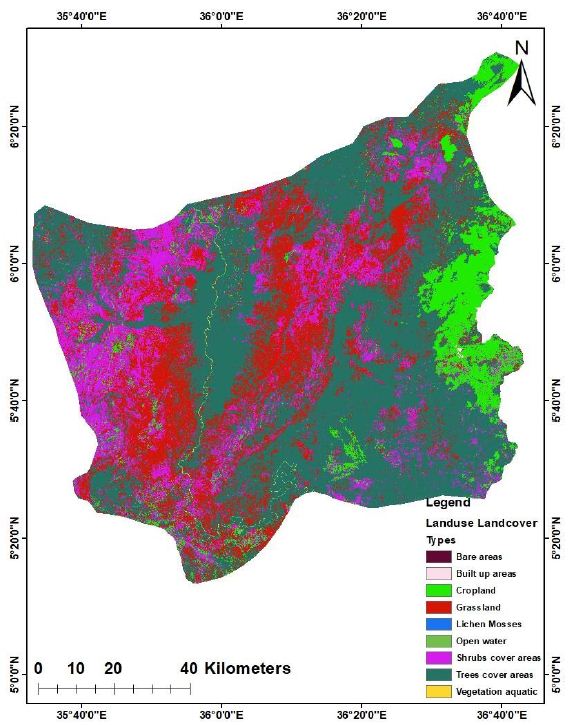
Figure 6: Landuse landcover
Lineament Density
Lineaments are tectonic-derived linear, rectilinear, and curvilinear features that are visible in satellite photography. These lineaments typically display linearity and curvilinerities in vegetation, drainage, drainage patterns, soil tonality, relief, and tonality in soil in satellite data [32]. In particular, in the lineaments that are not filled by soil, the lineaments may operate as a channel for water to seep into the earth and migrate through the aquifer system due to linear features including fault, fractures, and geological connections between various lithologies. Since it is assumed that the rate of water infiltration increases with increasing lineament density, the lineament density (Figure 7) of a region might indirectly indicate the groundwater potential [33]. These lineaments are mapped with the help of satellite data and can be correlated with faults, fractures, joints, bedding planes and geological contacts which are useful for the groundwater potential study [34].
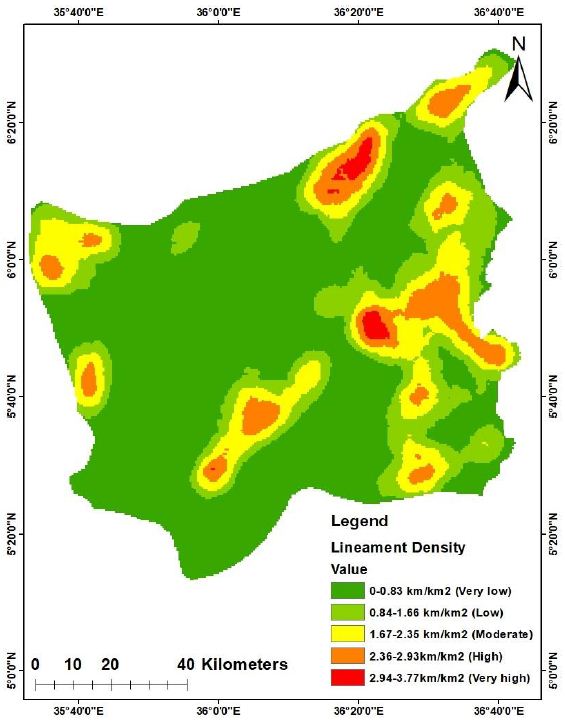
Figure 7: Lineament density map
Soil
The type of soil texture present in an area has a great impact on the availability of groundwater. Highly porous soils allow easy percolation and infiltration of surface water into the subsurface, and this is ideal for a favourable groundwater potential. Soil properties influence the relationship between runoff and infiltration rates, which in turn control the degree of permeability [35]. Soil texture raster data of the Lower Omo-Gibe Watershed was obtained by HWSD (harmonized world soil database) Version 1.2 at 900 m resolution. Lower Omo-Gibe Watershed consists of five major soil textural groups (Figure 8), such as Eutric Nitosols, Eutric Cambisols, Calcaric Fluvisols, Chromic Vertisols and Haplic Yermosols. Due to their difference in infiltration and porosity, weight of soil texture is assigned on the basis of their infiltration rate.
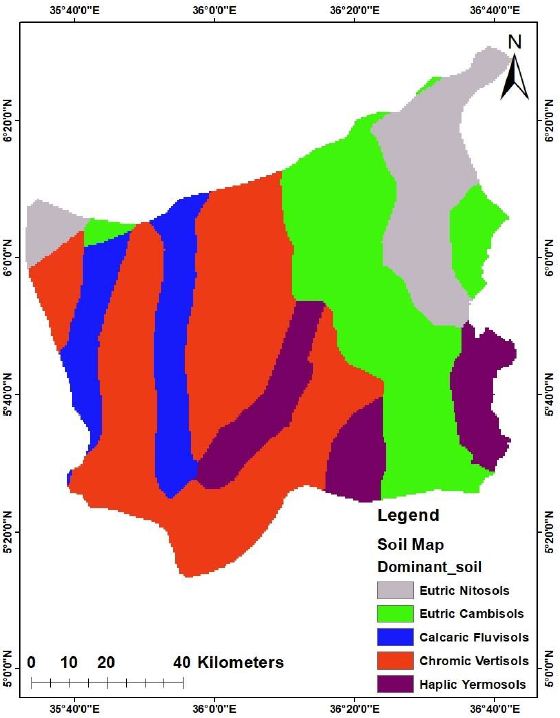
Figure 8: Soil map
Rainfall
The slope gradient and rainfall distribution have a direct impact on the infiltration rate and the potential for groundwater potential zones [22]. As indicated in Figure 9, the annual rainfall was categorized into five classes: very high (1410-1520 mm), high (1300-1400 mm), moderate (1180-1290 mm), low (1070-1170 mm), very low (946-1060 mm) and extremely very low (831-945 mm). Rainfall generally decreases from east to west and similar to elevation, with annual rainfall varying between 831 mm and 1520 mm.
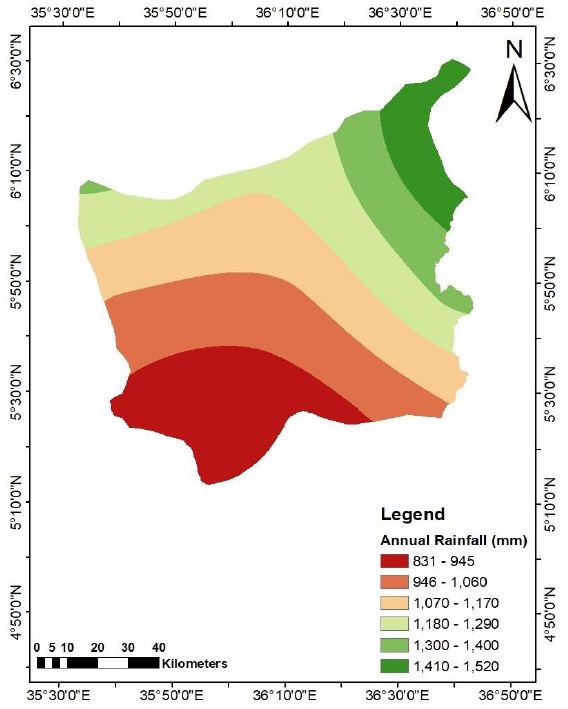
Figure 9: Annual rainfall map
GIS Based AHP Method
GIS Geographic Information System
A software and hardware combination is a created instrument that has been extensively employed in groundwater potential zones and assessment. A method for limiting the number of target regions for hydrogeo-physical study is provided by the combined RS and GIS analysis [36]. Following site appraisal and selection for sustainable groundwater management, site-specific ground geophysical methods like vertical electrical sounding (VES) and very low frequency electromagnetic (VLF-EM) profiling may be used. In the GIS and RS spatial analysis and modeling, thematic layers for soil, lineament density, drainage density, geomorphology, slope, and LULC are integrated. In terms of groundwater prospect, weights ranging from 1 to 4 were allocated to the classes in order of increasing.
AHP Analytical Hierarchy Process
Developing an Analytical Hierarchy Process (AHP) Model
Making a decision hierarchy is the first step in an AHP analysis. AHP divides the issue into a hierarchy. As adopted by [37] first level of the hierarchy is the goal of groundwater potential zone identification. The second level in the hierarchy indicates the parameters that used to decide the potential zone and the third level is about an alternative to select groundwater potential zone as very good, good, moderate and fair. The benefit of AHP is that it simplifies issue solving by better understanding how to break down challenges. To make sure that all requirements and potential alternatives were followed, it is also feasible to request the participation of specialists [37,38].
It’s one of the techniques employed the most in MCDA approaches, as was indicated in the introduction, this concept has been developed by [39]. The AHP evaluates a collection of evaluation criteria as well as a set of alternate options before selecting the best one with the most weight [40]. It is a strategy for assessing the relative weights of the criteria, different optimization strategies for each parameter, and generating an average rating of the variations that were generated using the predetermined criteria (selection criteria identification) at a certain stage [2]. The AHP is frequently used to establish priorities utilizing expert recommendations and evaluations, reduce issue confusion and complexity, and facilitate decision-making. There should be at least two criteria and two substitutes in every study that has been examined by AHP in order to determine each factor’s weight [41]. Since these criteria were given varying degrees of importance, education and expertise are particularly important for thorough evaluation and analysis. It’s possible to employ both qualitative and quantitative criteria [42]. After using AHP within the MCDA, a decision matrix was produced in each study that was reviewed. Field experiences and literature reviews were used to weigh several parameters on a flexible scale from 1 to 5. Then using a few formulae to get the system’s normalized weight and consistency ratio (CR) (Figure 10) [38].
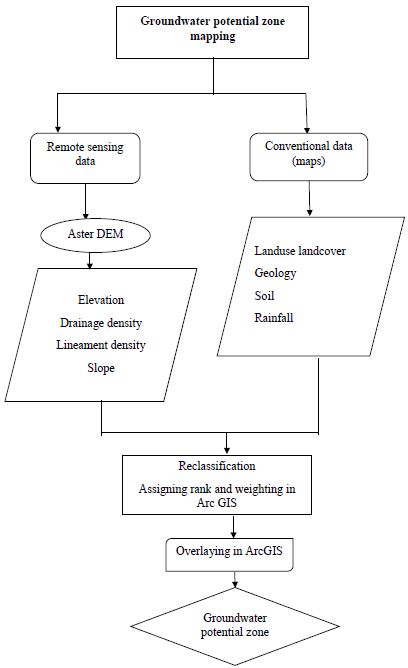
Figure 10: Methodology flow chart for the present study
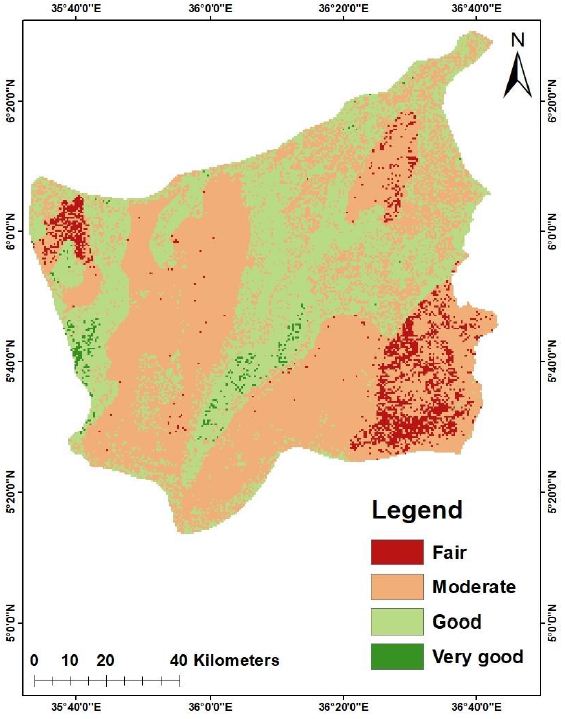
Figure 11: Groundwater potential map
Result and Discussion
Landuse Landcover
Land use map of the study area (Figure 6) consists of several classes, viz., Bare area 112 km2, Built up area 143 km2, Cropland 435 km2, Grassland 268.5 km2, Lichen mosses 112 km2, Open water 97 km2, Shrubs cover areas 289 km2, Tree cover areas 667 km2 and Vegetation aquatic 222 km2 as shown in Figure 6 and Table 1. Land use is one of the important criteria for identifying groundwater potential zones. Suitable weights were given to each class and their areal extents were calculated using “Zonal Statistics” in GIS (Table 1).
Table 1: Area covered under different range of parameter of Landuse landcover
|
Land use class |
Categories |
Area (km2) |
Area (%) |
| Bare area | Poor |
112 |
4.78 |
| Built up area | Very poor |
143 |
6.10 |
| Cropland | Moderate |
435 |
18.55 |
| Grassland | Good |
268.5 |
11.45 |
| Lichen mosses | Good |
112 |
4.78 |
| Open water | Very good |
97 |
4.14 |
| Shrubs cover areas | Poor |
289 |
12.32 |
| Tree cover areas | Very good |
667 |
28.44 |
| Vegetation aquatic | Very good |
222 |
9.46 |
Geology
Geology is also one of the input parameter factors in delineating the groundwater potential zones. Four different lithologies have been observed in the study area (Figure 4). Their areal extent has been determined using “Zonal Statistics” in geographic information system domain (Table 2). Geology of Lower Omo-Gibe watershed is dominated by tertiary extrusive and intrusive rock 758 (32.32%), tertiary (397 km2, 16.93%), quaternary (845 km2, 36.03%) and Permian-Carboniferous (345.5 km2, 14.73%).
Table 2: Area covered under different range of parameter of Geology
|
Geology class |
Categories |
Area km2 |
Area% |
| Tertiary extrusive and intrusive rock | Very good |
758 |
32.32 |
| Tertiary | Good |
397 |
16.93 |
| Quaternary | Moderate |
845 |
36.03 |
| Permian-Carboniferous | Poor |
345.5 |
14.73 |
Slope
The slope of the study area has been estimated from Digital Elevation Model (DEM) data as shown in Figure 2 and Table 3. Flat or gentle slope is suitable for increasing the infiltration amount from rainfall. Otherwise, in steep slope area where the infiltration capacity is very minimum whereas runoff is maximum. From the analysis, slope ranges from 0-5 percent rise covers high area coverage which is 31.29% (734 km2), 5-10 slope categories covers 17.67% (414.5 km2), 10-15 slope categories covers 13.69% (321 km2), 15-20 slope categories covers 9.46% (222 km2) and >20 slope categories covers 27.88% (654 km2).
Table 3: Area covered under different range of parameter of Slope
|
Slope categories |
Categories |
Area (km2) |
Area (%) |
|
0-5 |
Very good |
734 |
31.29 |
|
5-10 |
Good |
414.5 |
17.67 |
|
10-15 |
Moderate |
321 |
13.69 |
|
15-20 |
Poor |
222 |
9.46 |
|
>20 |
Very poor |
654 |
27.88 |
Soil Type
Soil type is also one of the most determinant factors in estimating the groundwater. Ten different soil types have been observed in the study area (Figure 8). Their areal extent has been determined using “Zonal Statistics” in geographic information system domain (Table 4). Soil type of Bahir dar zuria is dominated by vertisoil with an aerial extent of 1045.19 km2 (67.78%), followed by luvisoil (284.31 km2, 18.08%), and other units together cover in the study area as indicated in Figure 8 and Table 4. Based on the hydraulic properties of the soil, the soil classes were accordingly ranked using AHP.
Table 4: Area covered under different range of parameter of soil type
|
Soil class |
Categories |
Area km2 |
Area% |
| Eutric Nitosols | Moderate |
450 |
19.19 |
| Eutric cambisols | Good |
498 |
21.23 |
| Calcaric fluvisols | Very good |
356 |
15.18 |
| Chromic vertisols | Very poor |
782 |
33.34 |
| Hapric hermosols | Poor |
259.5 |
11.06 |
Lineament Density
Lineaments are the natural linear feature like faults, joints and fractures, which can visualize and interpreted directly from remotely sensed data. As shown in the Table 5, lineament density class ranked as very low, low, medium, high and very high with the areal extent of 0-0.83 Km/km2, 0.84-1.66 Km/km2, 1.67-2.35 Km/km2, 2.36-2.93 Km/km2 and 2.94-3.77 Km/km2 respectively. The total area falling in different range of lineament density is given in Figure 7 and Table 5 which show that most part of the study area have very low lineament density. So very low lineament density indicates very low infiltration rate, whereas the high lineament density areas indicate high infiltration (Table 5) thus a potential zone for groundwater development.
Table 5: Area covered under different range of parameter of Lineament
|
Lineament density class |
Categories |
Area (km2) |
Area (%) |
|
0-0.83 |
Very low |
1411 |
60.16 |
|
0.84-1.66 |
Low |
322 |
13.73 |
|
1.67-2.35 |
Moderate |
198 |
8.44 |
|
2.36-2.93 |
High |
201.5 |
8.59 |
|
2.94-3.77 |
Very high |
213 |
9.08 |
Drainage Density
Drainage density is a significant parameter for evaluating the groundwater potential zones. The areas having high drainage density have less potential for groundwater recharge, and the areas with low drainage density have a high potential for groundwater recharge. Hence, the areas having low drainage density are favorable for high groundwater potentiality. So, higher weights were assigned to the areas having low drainage density. The drainage density was classified into five categories viz. very low (0.08-091 km/km2), low (0.92-1.67 km/km2), moderate (1.68-2.74 km/km2), high (2.75-3.43 km/km2) and very high (3.44-4.22 km/km2). The highest area was under low density with 225.5 km2, followed by very low with 388 km2, moderate 510 km2, high 589 km2, and very high 633 km2 as shown in Figure 3 and Table 6.
Table 6: Area covered under different range of parameter of Slope
|
Drainage density class |
Categories |
Area (km2) |
Area (%) |
|
0.08-0.91 |
Very low |
225.5 |
9.61 |
|
0.92-1.67 |
Low |
388 |
16.54 |
|
1.68-2.74 |
Moderate |
510 |
21.74 |
|
2.75-3.43 |
High |
589 |
25.11 |
|
3.44-4.22 |
Very high |
633 |
26.99 |
Rainfall
Rainfall is one of the most important sources of groundwater recharge through percolation in the groundwater system. The average annual rainfall in the study area is grouped into six classes namely extremely very low (831-945 mm), very low (946-1060 mm), low (1070-1170 mm), moderate (1180-1290 mm), high (1300-1400 mm) and very high (1410-1520 mm), covering the area of about 410 km2 (17.48%), 370 km2 (15.77%), 366 km2 (15.60%), 433 km2 (18.46%), 376.5 km2 (16.05%) and 390 km2 (16.63%), respectively as shown in Figure 9 and Table 7. Rainfall distribution along with the slope gradient directly affects the infiltration rate of runoff water hence, increases the possibility of groundwater potential zones.
Table 7: Area covered under different range of parameter of Rainfall
|
Rainfall class |
Categories |
Area (km2) |
Area (%) |
|
831-945 |
Extremely very low |
410 |
17.48 |
|
946-1060 |
Very low |
370 |
15.77 |
|
1070-1170 |
Low |
366 |
15.60 |
|
1180-1290 |
Moderate |
433 |
18.46 |
|
1300-1400 |
High |
376.5 |
16.05 |
|
1410-1520 |
Very high |
390 |
16.63 |
Derived Priorities (Weights) for the Parameters
The AHP method was applied in the current work to determine the weight for each data layer. One of the most widely used techniques for determining the weights of criterion in the Multi-Criteria Decision Making is AHP (MCDM) [38]. To identify the purpose, criteria, and relationship between them, the hierarchical structure of the subject being studied is created as the first stage in the AHP approach. Initially, the AHP approach involved conducting a pairwise comparison of the alternatives using specially created questions that followed the format of the standard AHP questionnaires. In this study, opinions from a range of experts were gathered regarding the potential for groundwater, including hydrologists, hydrogeologists, environmentalists, and GIS experts. The overall method is as described in the following Figure 9. The result of AHP shows that geology has the highest weight (38.39%) followed by slope, which accounts for 23.27%, drainage density 14.54%, landuse landcover 11.40%, lineament density 7.04% and soil 5.35% of the weight given to each parameter (Tables 1 and 2). When the judgements matrix is consistent and the computed weight has been normalized by multiplying the derived weight of all parameters by 100%, it is then possible to rank the features of each parameter for the purpose of a weighted overlay. Features of each thematic layer were ranked on the basis of influence of groundwater potential within each parameter (Table 8) [38,43].
Table 8: Comparison matrix and significance weightage value of the influential factors
|
Factors |
Geology |
Lineament density |
Slope |
Rainfall |
Soil |
LULC |
Drainage density |
Weight |
| Geology |
7 |
6 |
5 |
4 |
3 |
2 |
1 |
38% |
| Lineament density |
7/2 |
6/2 |
5/2 |
4/2 |
3/2 |
2/2 |
1/2 |
19% |
| Slope |
7/3 |
6/3 |
5/3 |
4/3 |
3/3 |
2/3 |
1/3 |
12% |
| Rainfall |
7/4 |
6/4 |
5/4 |
4/4 |
3/4 |
2/4 |
1/4 |
10% |
| Soil |
7/5 |
6/5 |
5/5 |
4/5 |
3/5 |
2/5 |
1/5 |
8% |
| LULC |
7/6 |
6/6 |
5/6 |
4/6 |
3/6 |
2/6 |
1/6 |
6.6% |
| Drainage density |
7/7 |
6/7 | 5/7 |
4/7 |
3/7 |
2/7 |
1/7 |
6.4% |
Groundwater Potential Zone of the Watershed
To choose the best location for future groundwater development and management, it is crucial to integrate several groundwater regulating variables for discovering possible potential groundwater resources. Using the WLC of the GIS spatial analysis tool, all created thematic maps were integrated based on their weights and rates. The calculations of all the layers went into creating the GWP map. A prospective groundwater zone map was created by weighing the various theme layers and their specific features see Figure 10. The potential groundwater zone of the study area revealed five distinct zones, namely very good, good, moderate and fair. The distribution and extents of different potential groundwater zone are 158.05 km2 (21.59%), 35.92 km2 (4.91%), 214.77 km2 (29.34%), 220.59 km2 (30.13%), and 102.72 km2 (14.03%) for very good, good, moderate and fair zone respectively see Table 3. Study area have very high to high potential zone in southern, south west and central portion, while the west and eastern portion exhibits medium to low groundwater potentials. The distribution is more or less a reflection of drainage density, lineament, slope, and soil patterns in addition to geomorphic and geological elements, according to analysis of the groundwater potential map (Table 9).
Table 9: Groundwater potential zone
|
Groundwater Potential Zone Class |
Area (sq. km) |
Area in percent |
| Fair |
432.9 |
18.45 |
| Moderate |
634.8 |
27.06 |
| Good |
954.3 |
40.68 |
| Very good |
323.5 |
13.79 |
| Total |
2345.5 |
100 |
The region appears to have a great potential for irrigation because there are large expanses of irrigable land with fertile soil available. The watershed lower areas get volcanic sediments that are moved from the watershed upper portions due to its geographic location. The area is seen as one where food security is a worry, despite having a lot of potential for irrigation agriculture due to its good soil, irrigable acreage, and high capacity for groundwater. I consequently suggest that concerted activities by the district and regional governments are required to improve the living conditions of persons who reside in the catchment. I have found in my study that the watershed may be abundant in water resources, particularly groundwater. Groundwater was found to have a high potential in nearly half of the basin. Despite the aforementioned limitation, I am confident that the results can be used to identify solutions for utilizing the local water resources and resolving the issue that the residents have been experiencing. I advise that a thorough investigation be done to determine the quantity and quality of water that is available in order to determine whether it can be used for the intended purpose. Due to the availability of substantial tracts of irrigable land with fertile soil, the area appears to have a high potential for irrigation. Due to its geographical location, the watershed lower portions receive volcanic sediments that are transferred from the watershed top portions. Despite having a lot of potential for irrigation agriculture due to its good soil, irrigable land, and high capacity for groundwater, the region is considered one of the locations where food security is a concern. In order to better the living conditions of those living in the watershed, I therefore propose that coordinated actions by the district and regional governments are needed.
Conclusion
In this study, groundwater potential zone evaluation using remote sensing, GIS, and MCDM methodologies has been successfully used and proven. The generation of thematic layers, the application of AHP to get the weights, and overlay analysis to determine the groundwater potential zone are the three steps of the process. Thematic layers were created by digitizing existing maps using a GIS and remotely sensed satellite image data. Utilizing the AHP, utility weights for the substitutes were provided. The identification of the groundwater potential zone uses an overlay analysis of multiple thematic maps and weighting. Based on remote sensing, GIS, and MCDA methodologies, four categories of groundwater potential zones have been identified in this study region. This particular study deals with the assessment of groundwater potential zones (GWPZs) using geographical information systems and remote sensing techniques in the Lower Omo-Gibe watershed, Omo-Gibe Basin, Ethiopia. The thematic layers influencing GWPZs such as geology, landuse landcover, slope, lineament density, drainage density, soil properties (soil texture, soil type), and elevation maps were getting prepared with the available data, i.e., conventional data, satellite image, and assigned individual weights along with their subclass divisions depending on literature and expertise decision. The distribution and extents of different potential groundwater zone are 158.05 km2 (21.59%), 35.92 km2 (4.91%), 214.77 km2 (29.34%), 220.59 km2 (30.13%), and 102.72 km2 (14.03%) for very good, good, moderate and fair zone respectively.
Data Availability
Data used in this research are available upon request.
Conflicts of Interest
The author declares that they have no conflicts of interest or personal relationships that could have influenced the work reported in this paper.
Acknowledgments
The authors acknowledge the Ethiopian Ministry of Water, Irrigation and Energy, and the National Metrological Agency for providing the necessary data which is helpful to accomplish this research work.
References
- Verma N, Pate RK (2021) Delineation of groundwater potential zones in lower Rihand River Basin, India using geospatial techniques and AHP, Egypt J Remote Sens Sp Sci 24: 559-570.
- Sulaiman WH, Karimi H, Mustafa YT (2021) A GIS-based AHP Method for Groundwater Potential Zone Assessment : A Review. 2: 86-92.
- Mahato R, Bushi D, Nimasow G, Nimasow OD, Joshi RC (2022) AHP and GIS-based Delineation of Groundwater Potential of Papum Pare District of Arunachal Pradesh, India. J Geol Soc India 98: 102-112.
- Shabani M, Masoumi Z, Rezaei A (2022) Assessment of groundwater potential using multi-criteria decision analysis and geoelectrical surveying. Geo-Spatial Inf Sci.
- Barua S, Mukhopadhyay BP, Bera A (2021) Integrated assessment of groundwater potential zone under agricultural dominated areas in the western part of Dakshin Dinajpur district, West Bengal, India. Arab J Geosci 14.
- Ifediegwu SL (2022) Assessment of groundwater potential zones using GIS and AHP techniques: a case study of the Lafia district, Nasarawa State, Nigeria. Appl Water Sci 12: 1-17.
- Abirami C, Annadurai (2016) Identification of Groundwater Potential Zones on GIS based Multi-Criteria Technique – A Case Study Erode District. Int J Eng Res Technol 4: 1-6.
- Said S, Anees M (2020) Remote sensing and gis based assessment of groundwater potential zones in amu campus using ahp approach. Ecol Environ Conserv 26: S6-S11.
- Arefayne Shishaye H, Abdi S (2015) Groundwater Exploration for Water Well Site Locations Using Geophysical Survey Methods. J Waste Water Treat Anal 07.
- Mengistu TD, Chang SW, Kim IH, Kim MG, Chung IM (2022) Determination of Potential Aquifer Recharge Zones Using Geospatial Techniques for Proxy Data of Gilgel Gibe Catchment, Ethiopia. Water (Switzerland) 14.
- Legesse Kura A, Abrar H, Esayas Dube E, Likisa Beyene D (2021) AHP based analysis of groundwater potential in the western escarpment of the Ethiopian rift valley. Geol Ecol Landscapes.
- Sajil Kumar PJ, Elango L, Schneider M (2022) GIS and AHP Based Groundwater Potential Zones Delineation in Chennai River Basin (CRB), India. Sustain14.
- Hussein AA, Govindu V, Nigusse AGM (2017) Evaluation of groundwater potential using geospatial techniques. Appl Water Sci 7: 2447-2461.
- Ouchar Mahamat Hijazi AD, MorabitiK, Rahimi A, Amellah O, Fadil O (2021) Delineating of groundwater potential zones based on remote sensing, GIS and analytical hierarchical process: a case of Waddai, eastern Chad. GeoJournal 86.
- Doke A (2019) Delineation of the Groundwater Potential Using Remote Sensing and GIS: A Case Study of Ulhas Basin, Maharashtra, India. Arch Photogramm Cartogr Remote Sens 31: 49-64.
- Arulbalaji P, Padmalal D, Sreelash K (2019) GIS and AHP Techniques Based Delineation of Groundwater Potential Zones: a case study from Southern Western Ghats, India. Sci Rep 9: 1-17.
- Castillo JLU, Cruz DAM, Leal JAR, Vargas JT, Tapia SAR, et al. (2022) Delineation of Groundwater Potential Zones (GWPZs) in a Semi-Arid Basin through Remote Sensing, GIS, and AHP Approaches. Water (Switzerland) 14.
- Kaewdum N, Chotpantarat S (2021) Mapping Potential Zones for Groundwater Recharge Using a GIS Technique in the Lower Khwae Hanuman Sub-Basin Area, Prachin Buri Province, Thailand. Front Earth Sci 9: 1-16.
- Jothimani M, Abebe A, Duraisamy R (2021) Groundwater potential zones identification in Arba Minch town, Rift Valley, Ethiopia, using geospatial and AHP tools. IOP Conf Ser Earth Environ Sci 822.
- Biswas S, Mukhopadhyay BP, Bera A (2020) Delineating groundwater potential zones of agriculture dominated landscapes using GIS based AHP techniques: a case study from Uttar Dinajpur district, West Bengal. Environ Earth Sci 79.
- Biswas A, et al. (2012) Hydrogeochemical contrast between brown and grey sand aquifers in shallow depth of Bengal Basin: Consequences for sustainable drinking water supply. Sci Total Environ 431: 402-412.
- Kumar T, Gautam AK, Kumar T (2014) Appraising the accuracy of GIS-based Multi-criteria decision making technique for delineation of Groundwater potential zones. Water Resour Manag 28: 4449-4466.
- Rahmati O, Nazari Samani A, Mahdavi M, Pourghasemi HR, Zeinivand H (2015) Groundwater potential mapping at Kurdistan region of Iran using analytic hierarchy process and GIS. Arab J Geosci 8: 7059-7071.
- Yihunie D, Halefom A (2020) Investigation of groundwater potential zone using Geospatial Technology in Bahir Dar Zuria District, Amhara, Ethiopia. An Int Sci J 146: 274-289.
- Çelik R (2019) Evaluation of Groundwater Potential by GIS-Based Multicriteria Decision Making as a Spatial Prediction Tool: Case Study in the Tigris River Batman-Hasankeyf Sub-Basin, Turkey. Water 11.
- Yeh HF, Cheng YS, Lin HL, Lee CH (2016) Mapping groundwater recharge potential zone using a GIS approach in Hualian River, Taiwan. Sustain Environ Res 26: 33-43.
- Thapa R, Gupta S, Guin S, Kaur H (2017) Assessment of groundwater potential zones using multi-influencing factor (MIF) and GIS: a case study from Birbhum district, West Bengal. Appl Water Sci 7: 4117-4131.
- Mandal U, et al. (2016) Delineation of Groundwater Potential Zones of Coastal Groundwater Basin Using Multi-Criteria Decision Making Technique. Water Resour Manag 30: 4293-4310.
- Gadrani L, Lominadze G, Tsitsagi M (2018) F assessment of landuse/landcover (LULC) change of Tbilisi and surrounding area using remote sensing (RS) and GIS. Ann Agrar Sci 16: 163-169.
- Adewumi AJ, Anifowose YB (2017) Hydrogeologic characterization of Owo and its environs using remote sensing and GIS. Appl Water Sci 7: 2987-3000.
- Dahiphale P, Kasal y, Madane D (2020) European Journal of Molecular & Clinical Medicine Groundwater Potential Zones Identification Using Geographical Information System. 07.
- Selvam S, Magesh NS, Sivasubramanian P, Soundranayagam JP, Manimaran G, et al. (2014) Deciphering of groundwater potential zones in Tuticorin, Tamil Nadu, using remote sensing and GIS techniques. J Geol Soc India 84: 597-608.
- Magesh NS, Chandrasekar N, Soundranayagam JP (2012) Delineation of groundwater potential zones in Theni district, Tamil Nadu, using remote sensing, GIS and MIF techniques. Geosci Front 3: 189-196.
- Jhariya DC, Kumar T, Gobinath M, Diwan P, Kishore N (2016) Assessment of groundwater potential zone using remote sensing, GIS and multi criteria decision analysis techniques. J Geol Soc India 88: 481-492.
- Kudamnya E, Andongma W (2017) Predictive Mapping for Groundwater within Sokoto Basin, North Western Nigeria. J Geogr Environ Earth Sci Int 10: 1-14.
- Ndatuwong LG, Yadav GS (2014) Integration of Hydrogeological Factors for Identification of Groundwater Potential Zones Using Remote Sensing and GIS Techniques. J Geosci Geomatics 2: 11-16.
- Mu E, Pereyra-Rojas M (2017) Group Decision-Making in AHP.
- Patidar N, Mohseni U, Pathan AI, Agnihotri PG (2022) Groundwater Potential Zone Mapping Using an Integrated Approach of GIS-Based AHP-TOPSIS in Ujjain District, Madhya Pradesh, India. Water Conserv Sci Eng 7: 267-282.
- Saaty TL (1984) 285 R. Avenhaus et al. (eds.), pg: 285-286.
- Leake C, Malczewski J (2000) GIS and Multicriteria Decision Analysis. J Oper Res Soc 51.
- Greene R, Devillers R, Luther JE, Eddy BG (2011) GIS-Based Multiple-Criteria Decision Analysis. 6: 412-432.
- Triantaphyllou E, Sánchez A (1997) A Sensitivity Analysis Approach for Some Deterministic Multi‐Criteria Decision‐Making Methods. Decis Sci 28: 151-194.
- Doke AB, Zolekar RB, Patel H, Das S (2021) Geospatial mapping of groundwater potential zones using multi-criteria decision-making AHP approach in a hardrock basaltic terrain in India. Ecol Indic 127.