Abstract
This research explored the social frames through which young people form their “selves.” Young respondents (age 17-21) from either Alabama or New York each evaluated unique sets of vignettes, combinations of metaphors, descriptions of people or actions with which they could either identify or not identify. The vignettes were created using experimental design, with each of the 127 respondents evaluating a unique set of 24 such vignettes. Deconstruction of the vignettes into the contribution of the different elements revealed how each element drove the responses of either identification (‘like me/like others’) or differentiation (like me/not like others; not like me/like others). Clustering the respondents revealed three clear mind-sets, but only when the metric was ‘differentiation’. These young respondents fell into three clear groups based upon how they saw themselves as different from others. The three groups (mind-sets) are: (MS1=Feelings about people surrounding me; MS2=Feelings about gender; MS3=Feelings about my country).
Introduction
It appears to anyone viewing the news that United States is fracturing, fault lines appear everywhere, whether political, social, educational, religious, and so forth. An ancient Chinese curse is appropriate for this world: ‘may you live in interesting times.’ We are living in the interesting times. The issue is how we can understand the mind of people within these times when people are so conscious of the world around them through the public media, the internet, and the veritable flood of information threatening to drown us every day with its biases and hysterics.
Faced with the opportunity to study people in ‘interesting times’ the authors used the emerging science of Mind Genomics to explore the mind of young people ages 17-21, living in either New York or Alabama, two states deemed to be dramatically different from each other when one reads the tomes of statistics which attempt to quantify today’s life.
Mind Genomics is an emerging science which explores and systematizes the way people make decisions about ordinary daily issues, topics one might explore but usually does not because of the absolutely quotidian nature. For example, in previous Mind Genomics studies the topics explored ranged from what the third-grade mathematics class might be in ten years to what one should say about food to make it interesting. Studied or not, these are the kinds of everyday themes which shape lives, their ordinariness ensuring somehow that they escape the eye of science, although certainly they rarely escape the mouth of opinion [1,2].
Our science, Mind Genomics, particularly suited to study the mind of today, emerged from three interrelated strands of science and research.
a. Experimental Psychology, More Specifically the Discipline of Psychophysics
Psychophysics attempts to link together psychological magnitude of perception (viz., the sweetness of a beverage) with physical stimuli (viz., the concentration of sweetener in the beverage). The underlying notion is the measurement of a percept. The traditional approach has been to have respondent evaluate stimuli of different physical magnitudes such solutions of sucrose (cane sugar) of different concentrations, or the perceived seriousness of crimes (REF), and the traditional effort of linking the magnitude of that percept to the measured magnitude of a physical stimulus associated with the stimuli. For the first, sugar in water, the physical stimulus is the concentration of the solution. For the second, seriousness of crimes, the physical stimulus is the punishment imposed by the court. This effort is what S.S. Stevens, late Professor of Psychophysics at Harvard, called ‘outer psychophysics’ [3]. Mind Genomics attempts to create what Stevens called the ‘inner psychophysics,’ measuring the strength of ideas.
b. Statistics, Specifically the Discipline of Experimental Design
Experimental design enables the researcher to mix independent variables (elements or phrases about the topic) into combinations called vignettes, present these vignettes to people, elicit and record ratings of these vignettes, and then deconstruct the ratings of vignettes into the part-worth contribution of each of element. Experimental design ensures the proper set of combinations, created with the prospect of submitting the array of vignettes and responses to statistical analysis (regression modeling). Rather than working with single elements, rated one at a time, Mind Genomics works with combinations of verbal messages, the combination made according to an underlying system. Those mixtures simulate the compound and complex nature of our reality. Although one might think that simply asking a person to rate each idea one at a time would do just as well, the reality is that this ‘one at a time’ approach enables the respondent to adjust the criterion of judgment for each idea. When some ideas are emotion-laden the researcher might use a different judgment criterion than those cases were the ideas to be taken from a less emotional topic. Presenting the respondent with combinations of ideas, vignettes in the language of Mind Genomics, forestalls this tendency to subconsciously shift the criterion of judgment to be more appropriate for the nature of the phase or topic being rated. Creating combinations when it might be easier to evaluate single elements seems to be a great deal of effort, but the reality is that the evaluation of vignettes ends up producing more solid data, resulting from making it impossible for the respondent to ‘game’ the system (Craven & Islam, 2011; Easterling, 2015) [4,5].
c. Consumer Science
The third source for Mind Genomics is the discipline of consumer science, the study of what consumers want, what they do and why they do it [6,7]. Consumer science is best exemplified by the nature of the work they do, which is to study the mind of the consumer, as that mind interacts with needs, information, and opportunities. Rather than working with artificial situations set up to demonstrate some principle, as is the practice of many psychology researchers, consumer science ends up working with what exists, or with a meaningful variation of what currently exists. It is the very focus on the quotidian, the daily, the ordinary, which has become the north star of Mind Genomics
Mind Genomics studies follow a template approach, the objective of which is to create an easy-to-implement experiment, along with an easy-to-understand set of results that anyone can use and build-upon. The goal is to democratize research, making it inexpensive, easy, fast, and iterative, with the ability to scale the study from a small sample of say 20-30 respondents in a local area to a world-wide study with dozens or more countries, each with hundreds of respondents. Rather than re-inventing the research process again and again, making the process specific for a topic, the development of Mind Genomics was done with the vision of creating a DIY, do-it-yourself knowledge-&-insight acquisition system. The approach is the ultimate in the much maligned, misunderstood, and overlook ‘cookie cutter approach.’ The vision underlying Mind Genomics was the industrial-scale creation of deep knowledge through systematized data structures.
Our focus in this paper is on what young people think about themselves in terms of descriptions. The description is not psychology nor behavior, but rather what types of general ‘metaphors’ best describe them. General metaphors encapsulate a great deal of descriptive information into a phrase. The result is that we can learn about the ‘hooks of identity’ for young people.
We proceed now with the exploratory study. As the data will reveal, one study can lead to dozens, each just as easily implemented as this, exploring a new world efficiently, and with the excitement to spark and maintain the interest of students as well as professionals.
Method
The Mind Genomics program is embodied in a website, www.BimiLeap.com, openly available, with the only charges being the processing costs (including recruitment of respondents, if desire). All screen shots come from that website.
Step 1: Give the Study a Name (Figure 1, Left Panel)
This step may seem vacuous, but it is not. Naming a study forces the researcher to think about the issues. The name of this study reflects that thinking. The effort to name the study ended up producing a simple, non-descriptive name, Study 1, because the author struggled without success to create a shortened name. It is worth noting that the more fundamental studies of Mind Genomics end up being hard to name, and that experienced difficulty in naming a study is itself something to explore. Either one does not know the topic, has not thought deeply about the topic, or perhaps the topic is going into very new areas which are terra incognita and cannot really be encapsulated by a name (Figure 1).
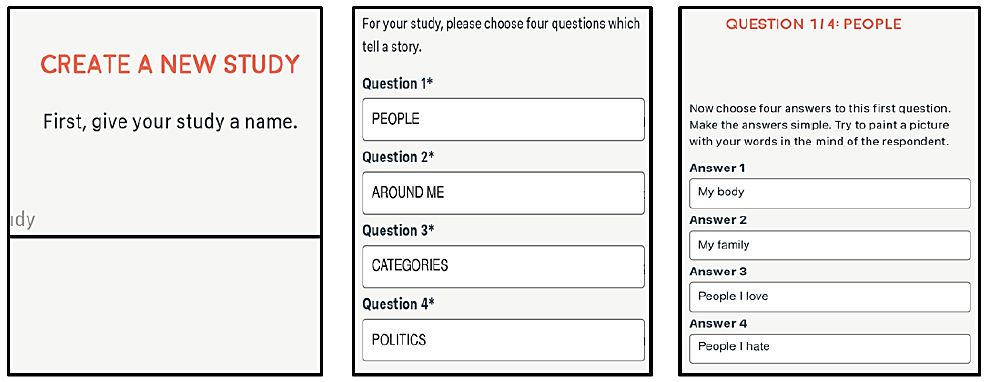
Figure 1: Set up for a Mind Genomics study. Left panel = assign the study a name. Middle panel = provide four questions which tell a story. Right panel = provide four answers to each question.
Step 2: Create four questions or topics which are logically connected, or which tell a story (Figure 1, middle panel)
The questions explore different aspects of the topic. The respondent never sees the questions. Rather, the questions are developed by the research (and as of 2023, with the aid of AI), to create the framework of answers The four questions can be considered both a way to guide the researcher, and the abovementioned bookkeeping device, which ensure that two or more answers of the same type (viz., from the same question) never appear in the same vignette. This bookkeeping action will be important when the Mind Genomics process creates vignettes, combinations of answers.
Step 3: For Each Question Provide Four Different Answers (Figure 1, Right Panel)
The answers must address the question. They may be mutually contradictory answers because they will never appear together. Ideally, the answers should consist of phrases rather than single words. The phrases should paint a word picture, if possible. Once the questions are selected the answers are straightforward to create, unless the topic requires technical knowledge. In most cases, however, by the time the researcher has created the four questions, the four sets of answers are easy to develop. The hard thinking has been done already in the act of constructing the questions.
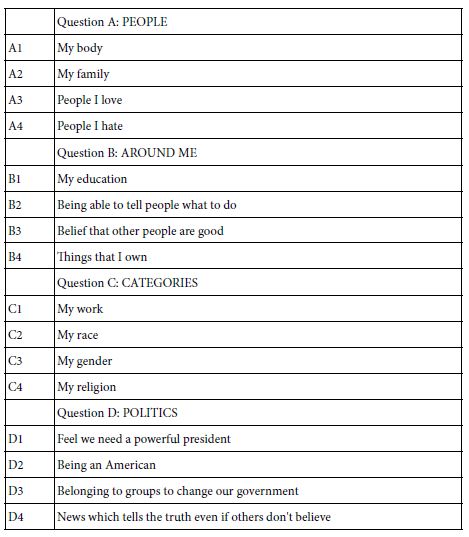
Table 1 presents the questions and the answers. As noted above, the questions are abbreviated phrases rather than full questions. Since the questions are not shown to the respondent the abbreviated format of the questions makes little practical difference to the study itself. The answers are simple phrases which create a word picture, but one of a very general nature. The answers could be refined and particularized should the researcher wish to do so. In this study it was sufficient to put in a general phrase.
Table 1: The four questions (topics), and the four answers (elements) for each question
Step 4: Create Test Vignettes according to an Underlying Experimental Design
Mind Genomics ‘works’ by creating combinations of elements (messages, answers), testing these combinations (called vignettes) among respondents, and using the combination of experimental design and ratings to create a model or equation showing how each element ‘drives’ a response. Step 4 prescribes the composition of the vignettes. Each respondent ends up testing exactly 24 different vignettes. The experimental design ensures that of elements, so that each vignette comprises a minimum of two elements, a maximum of four elements, and that each question contributes at most one element or answer to a specific vignette. In the end, for each respondent, every element appears exactly five times in 24 elements. Thus, a question contributes 4 (elements) x 5 (appearances per element), viz., contributes to 20 out of 24 vignettes, and does not contribute to four out of 24 vignettes. The 16 elements appear in a statistically independent fashion. Finally, each respondent evaluates a unique set of vignettes, created by permuting the combinations, but keeping the mathematical structure the same. This is called a permuted design [8]. Figure 2 shows a set of vignettes, along with the rating assigned by the respondent, and the response time, defined as the time (in seconds) elapsing between the presentation of the vignette to the respondent and the time that the respondent assigns the rating. Figure 2 comes from a database, created after the study. The actual screen shot of the vignette presented in the study appears Figure 4 (right panel).
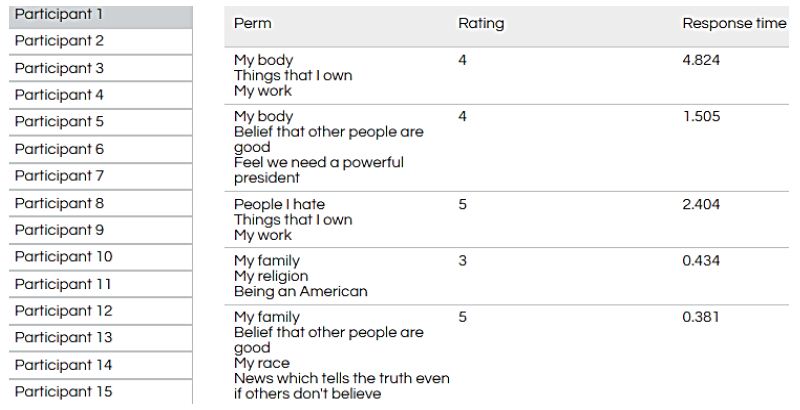
Figure 2: Example of vignettes presented to the respondent, based upon the permuted experimental design.
Step 5: Create a Self-profiling Questionnaire (Figure 3, Left Panel)
Social researchers often want to learn more about the people who participate in their studies. To do so, they create what is known as a self-profiling questionnaire, which instructs the respondent to answer certain questions about WHO she/is, what she/he THINKS, what she/he DOES, and so forth. Often this material is used to divide the respondent population into new subgroups, each subgroup studied separately, and the results compared, hopefully revealing relevant group to group differences which knowledge adds to the contribution of the study.
The Mind Genomics program, BimiLeap, is programmed to obtain the gender and age of the respondent in every study, doing so automatically. The researcher can ask an additional 1-8 questions, each question allowing 2-8 answers. The self-profiling questionnaire is completed at the start of the study, before the respondent has read/rated the vignettes. As the third self-profiling questionnaire, BimiLeap instructed the respondent to provide a sense of the respondent’s mental horizon.
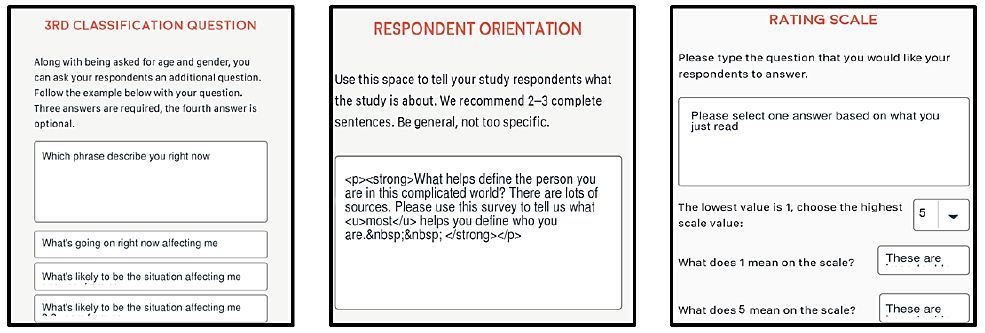
Figure 3: Screen shot of the self-profiling classification question (left panel), the respondent orientation (middle panel), and the rating scale (right panel).
Step 6: Create the Orientation Page
Most respondents coming into a Mind Genomics study do not know what is expected of them. The the act of reading paragraphs of information is well known, but not the somewhat artificial situation of reading lists of messages, 2-4 messages in each list, with no effort to link together the messages into to a coherent whole. The respondent must be introduced to what to do and how to evaluate through an explanation, the ‘orientation.’ Figure 3 (middle panel) shows the orientation for this study.
Step 7: Create the Rating Scale (Figure 3, Right Panel)
The scale is a 5-point scale.
The original aim was to have five different scale points as shown below.
R1=These are NOT important to define both me and NOT to define other people
R2=These are not important to define me but important to define other people
R3=Can’t answer about these
R4=These are important to define only me but not to define other people
R5=These are important to define both me and to define other people
By accident, the word ‘NOT’ was omitted from R1, so that R1 and R5 are the same. Thus, in the analysis we will refer to the two scales as R51, and will merge their data, leaving us with a 4-point scale.
R2=These are not important to define me but important to define other people
R3=Can’t answer about these
R4=These are important to define only me but not to define other people
R5 & R1 (R51)=These are important to define both me and to define other people
Step 8: Record Final Thoughts about the Project (Figure 4, Left Panel)
This section in the Mind Genomics study is reserved for the research as an ‘aide memoire’ for the study. Quite often studies are run, but the researcher may or may not recall some of the issues involved, or the subtleties recognize at the start of the experiment. The final thoughts serve as a written record of the study.
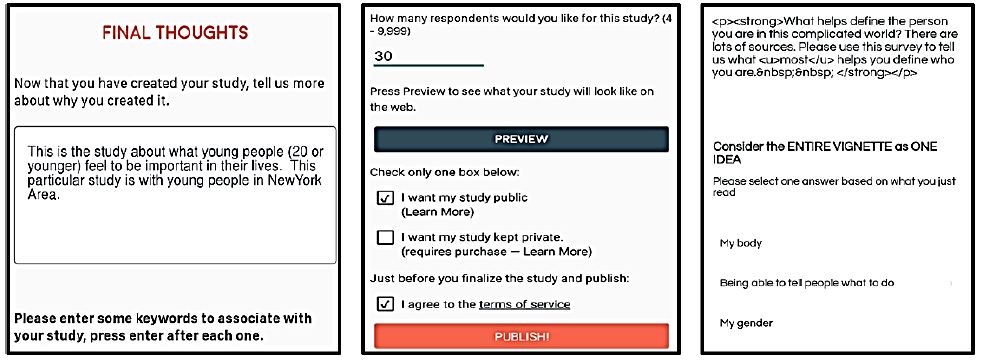
Figure 4: Screen shots showing the requirement for the researcher to describe the study for archival purposes (left panel), the number of respondents to be select, and the request for privatization if desired (middle panel), and an example of how the program is instructed to present a vignette to the respondent (right panel).
Step 9: Select the Number of Respondents, How the Respondents Will Be Chosen, and Whether or Not the Study Results Will Be Made Private (Figure 4, Middle Panel)
The study called for 30 respondents from New York, and 30 respondents from Alabama, ages 16-21. The ingoing hypothesis was that there might emerge big differences in geography, based upon the common belief that the ‘coasts’ generate different ways of thinking from the ‘heartland’ of America, including the less developed south. Alabama was chosen as the state to represent the south, a hypothesized opposite world from New York.
Step 10: Invite the Respondents to Participate, have Them Go Through the Self-profiling Classification, Read the Orientation and then Evaluate 24 Vignettes
Figure 4 (right panel) shows an example of a vignette as the respondent might see it on the screen of a smartphone. The screen shot shows the text with the information that the BimiLeap program uses to adjust the font. In the actual experiment the instructions at the top are shown in simple text format without the formatting instructions used by BimiLeap.
The respondents are invited to participate by a local field service or provided by the researcher. Experience of over 40 years suggests that it is best to work with specialists who can recruit respondents to participate. Rather than saving money by depending upon the good will of a person to participate, it almost always proves more beneficial to incentivize the respondent, and to work with a the specialty company which delivers respondents eager to participate. The study presented here took about 45 minutes to complete, after launching, with the respondents recruited by Luc.id Inc., the specialty company. Lucid contracts with field services worldwide to direct panelists to a study, efficiency far greater than realized any other way. Furthermore, Luc.id itself is only one of a growing number of companies specializing in providing respondents for the on-line studies.
Step 11: Create a Database for the Study, Similar in Form to an Excel File
Each respondent generates 24 rows of data, one row for each of the 24 vignettes.
a. Column 1=study name
b. Column 2=panelist identification number (later recoded, when multiple studies are combined into a single database
c. Column 3 and 4 – gender and age of the respondent
d. Column 5 and 6 – state where the respondent lives and answers how the respondent feels.
e. Column 7 Test order of vignette (01-24).
f. Column 8 – 23 Reserved for the structure of the vignette. Each column of the 16 columns is reserved for one of the 16 elements. A ‘1’ in the cell means that the element is present in that vignette. A ‘0’ in the cell means that the element is absent from that vignette.
g. Column 24 – The rating assigned to the vignette on the 5-point scale.
h. Column 25 – The response time for the specific vignette.
i. Note that Columns 1-6 are repeated 24 times, once for each of the 24 vignettes evaluated by the respondent. The information does not change.
Afterwards, create five new variables, which are binary transformations based upon the rating to the vignette assigned by the respondent:
a. R2=100 when the rating is 2, otherwise R2=0 (when the rating is not 2).
b. R3=100 when the rating is 3, otherwise R3=0.
c. R4=100 when the rating is 4, otherwise R4=0.
d. R51=100 when the rating is either 1 or 5, otherwise R51=0. This transformation codes those responses where the respondent feels that she/he is the same as others.
e. R42=100 when the rating is either 4 or 2, otherwise R42=0. This transformation codes those responses where the respondent feels that she/he differs from others.
f. To each of the newly created binary transformed variables add a vanishingly small random number (<10-5), to ensure that there will be some minimum level of variation in the binary transformed variable. That minimum level of variation ensures that the binary transformed variable will allow the regression analysis. Regression analysis fails when the dependent variable has no variation (when are the ratings are the same, e.g., R51 is all 0’s or all 100’s).
Step 12: Create Models (Equations) Which Relate the Presence/Absence of Elements to Ratings
By creating the vignettes according to a permuted design, the researcher makes it possible to use statistical methods to deconstruct the rating into the contributions of the 16 elements. The most common method is OLS (ordinary least-squares) regression. The equation is expressed as: DV (Dependent variable, viz. The binary transformed rating)=k1(A1) + k2(A2) … k16(A16). The equation is estimated without an additive constant. Estimating the equation with an additive constant will generate a high correlated set of 16 coefficient, but the coefficients estimated without the additive constant will be systematically higher than the same coefficients estimated with an additive constant. It becomes easier to understand the ‘meaning’ of the coefficients without using an additive constant. The equation can be created either at the level of the Total Panel (all respondents), at the level of a self-defined subgroup (e.g., age, gender, response to the self-profiling classification), or at the level of the individual respondent.
Step 13: Retain Strong Performing Element by Key Self-defined Subgroup, Based on R51 (Like Me)
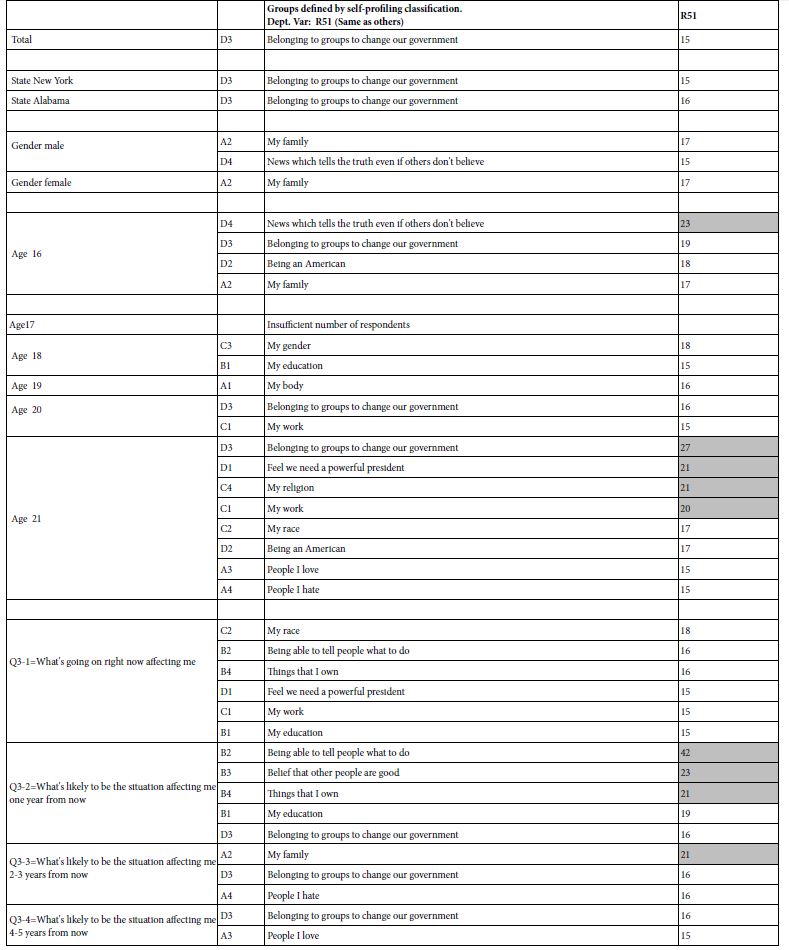
Mind Genomics studies comprising coefficients for 16 elements by many groups returns a great deal of data from even the simplest analysis. All too often the plethora of coefficients obscures important patterns which exist in the data, but simply fail to be detected, the signal masked by the noise. It is often best to eliminate the weaker performing elements, suppressing the noise, to let the signal through. For this analysis and for the subsequent analyses, we eliminate all coefficients 14 or lower. These elements may be relevant, but with enough of these weaker scoring elements retained in the data, the pattern fails to emerge. Table 2 shows the strong elements for each group. Even with the effort to prune out weaker performing elements it becomes clear from Table 2 that no strong patterns are to be discerned.
Table 2: Strong performing elements describing WHO I AM (R51 as the dependent variable). The respondents are self-defined by who they ARE, and by what occupies their mind when THINKING ABOUT THE FUTURE. Very strong performing elements (coefficients of 20 or higher) are shown in shaded cells.
Step 14: Identify New to the World Mind-sets by Creating Individual-level Models & Clustering
The permuted design used by Mind Genomics ensures that each respondent evaluates a different set of 24 vignettes, but with each respondent evaluating the exact right set of vignettes to generate an equation for that respondent. The individual-level model thus enables the researcher to create a database of coefficients for the different respondents, and use the patterns generated by the coefficients to create or discover a limited number of patterns that can be interpreted.
We will use two dependent variables, R51 (same as me), and R42 (different from me). We can create these equations because we set up the 24 vignettes for each respondent by experiment design, and because we added a vanishingly small number to the value of R51 and another vanishingly small number of the value of R42. We create these two groups of coefficients because we do not know whether we will be success. We don’t know how young people think. Do they think in terms of ‘like me,’ or in terms of ‘different from me.’
The data processing is the same for each group, the first group with R51 as the dependent variable, the second group with R42 as the dependent variable. Clustering is a well-accepted procedure in exploratory statistics to identify groups [9]. The computation is done without considering the ‘meaning’ of the clusters, but rather simply use the clustering procedure in an ‘automatic’ fashion, and only later try to name the clusters. The emergent clusters may be considered to be different, interpretable regions of what really ends up being a ‘cloud.’ That is, the emergent clusters may not really exist as hard and fast, totally separable groups. This is some ‘wiggle room’ at the borders of the clusters. Nonetheless, clustering is a good way to get a sense of the nature of the dependent variable by identifying a small number of different levels/examples of the dependent variables.
Step 15: Discover Mind-based Upon Strong Performing Elements
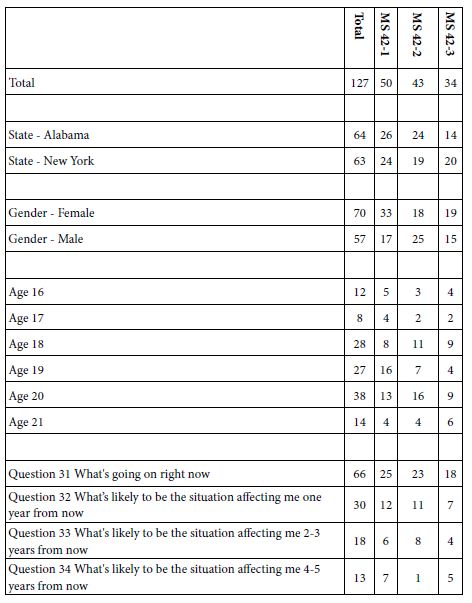
Table 3A shows the emergence of two seemingly hard-to-interpret clusters (mind-sets) based upon clustering using R51 (Like Me). Table 3B shows the emergence of three easier-to-interpret clusters based upon clustering using R42 (Not Like Me). Table 4 shows the base sizes of the mind-sets based upon Total Panel as well as the mind-set emerging from using R54 (Different From Me) as the dependent variable.
Table 3: Very Strong performing elements emerging when the respondents are segmented based on R51 (Same as Me) versus segmented based on R42 (Different From Me).
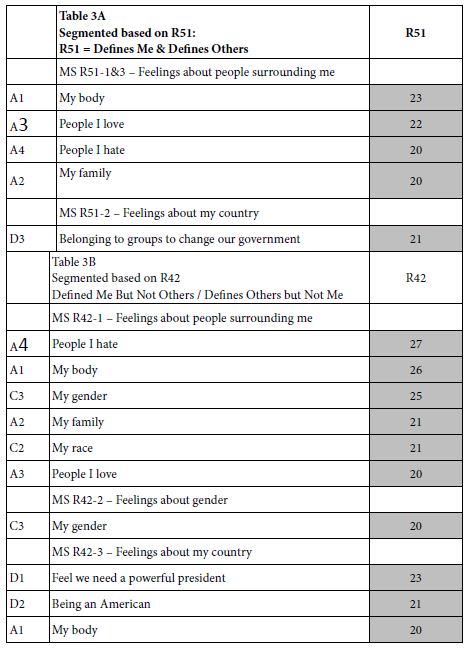
Table 4: Base size of respondents for Total Panel and the three mind-sets emerging from using R42 (Different From Me) as the dependent variable in the individual-level regression modeling.
Discussion and Conclusions
The study presented here breaks new ground in the application of Mind Genomics to the development of the person. Traditionally, Mind Genomics has been used to understand how people respond to external stimuli, such as products, or more recently student expectations of what 3rd grade mathematics will be like in the years to come (Mendoza et. al., 2023). Mind Genomics has explored people in society, and the mind of the juror evaluating facts of a case [10-12].
With this paper Mind Genomics is moving into a new area, the study of how young people think about themselves. Rather than asking the respondent to introspect or rather than having an expert assess the individual based upon the expert’s experience and training, Mind Genomics approach works with the person evaluating her or his reaction to an ambiguous statement, a metaphor. Rather than asking the respondent to describe how she or he defines himself, the ‘production’ approach of psychology, we present the respondent with combinations of metaphors, such as family, work, etc. All we require the respondent to do is assign the combination to one of four groups, the four answers. It is impossible for the respondent to ‘game the system’, or to ‘freeze up’. Tables 3B shows that despite this seemingly to-respondent meaningful to these sets of 24 different combinations, the results appear to make sense, and give insight into the nature of the way the respondent thinks.
If we were to the future for new directions, perhaps the best result from this study is the infusion of a new way of experimenting with the already well-trod field of metaphors as tools to understand psychological processes. Just a few references should suffice to show the scope of what has been done, both in understanding the young person’s trip into maturity [13,14], as well as understand a person’s mind through a new lens [15-17]. Add to that the power of experimentation through Mind Genomics and we may be at the threshold of a new direction for psychology, coupling a deep study of the mind and experimentation using metaphors.
References
- Mendoza C, Mendoza C, Deitel Y, Rappaport SD, Moskowitz HR (2023) Empowering young researchers through Mind Genomics: What will third grade mathematics look like in 10 years? Psychology Journal, Research Open 5: 1-15.
- Porretta S, Gere A, Radványi D, Moskowitz H (2019) Mind Genomics (Conjoint Analysis): The new concept research in the analysis of consumer behaviour and choice. Trends in Food Science & Technology 84: 29-33.
- Stevens SS (1975) Psychophysics: Introduction to Its Perceptual, Neural and Social Prospects. John Wiley & Sons.
- Craven BD, Islam SM (2011) Ordinary least-squares regression. The SAGE Dictionary of Quantitative Management Research 224-228.
- Easterling RG (2015) Fundamentals of Statistical Experimental Design and Analysis. John Wiley & Sons.
- Moskowitz HR, Gofman A, Beckley J, Ashman H (2006) Founding a new science: Mind genomics. Journal of Sensory Studies 21: 266-307.
- Moskowitz HR, Gofman A, Lieberman LE, Ray I, Onufrey SR (2011) Sequencing the genome of the customer mind by RDE and intervention testing. Journal of Academic and Business Ethics 3: 4-14.
- Gofman A, Moskowitz H (2010) Isomorphic permuted experimental designs and their application in conjoint analysis. Journal of Sensory Studies 25: 127-145.
- Likas A, Vlassis N, Verbeek JJ (2003) The global k-means clustering algorithm. Pattern Recognition 36: 451-461.
- Green PE, Srinivasan V (1990) Conjoint analysis in marketing: new developments with implications for research and practice. Journal of Marketing 54: 3-19.
- Moskowitz H, Kover A, Papajorgji P. eds., (2022) Applying Mind Genomics to Social Sciences. IGI Global.
- Moskowitz HR, Wren J, Papajorgji P (2020) Mind Genomics and the Law. LAP LAMBERT Academic Publishing.
- Evans K, Furlong A (2019) Metaphors of youth transitions: niches, pathways, trajectories, or navigations. In Youth, Citizenship and Social Change in a European Context. Routledge 17-41.
- Wyn J, Lantz S, Harris A (2012) Beyond the ‘transitions’ metaphor: Family relations and young people in late modernity. Journal of Sociology 48: 3-22.
- Barker P (1992) Using metaphors in psychotherapy. Psychology Press.
- Kopp RR (1995) Metaphor Therapy: Using Client-Generated Metaphors in Psychotherapy. Psychology Press.
- Tay D (2017) Exploring the metaphor-body-psychotherapy relationship. Metaphor and Symbol 32: 178-191.