DOI: 10.31038/PEP.2020121
Abstract
Introduction: Fruit and vegetable prescription programs at farmers markets have shown some statistically significant changes in health markers. To date, little is known about whether these programs also improve Quality of Life (QoL). The current study examined if QoL improvements occurred after participation in a fruit and vegetable prescription program.
Methods: Our team of volunteer clinicians enrolled a cohort of 101 low-income adult participants over three years. Participants self-identified as food insecure and had previously been diagnosed with a diet-related disease. Each received a “prescription” to purchase fruits and vegetables from the local farmers market. Participants attended monthly clinic visits and attended plant-based cooking classes. Demographic, baseline and post-program outcome data (SF-36; Medical Outcomes Survey Short Form) were collected.
Results: All SF-36 subscales and composite scales showed statistical significance indicating subjectively improved quality of life/health among program graduates. SF-36 Role-Physical, Bodily Pain, Energy-Vitality and Role-Emotional subscales also demonstrated Reliable Changes (RCIs) indicating clinically significant outcomes across these domains of function. Individually, 32% and 27% of graduates exceeded the RCI for the Physical Composite Scale and Mental Composite Scales, respectfully.
Conclusion: This is the first study to apply the SF-36 RCI measure to assess generic quality of life outcomes of a fruit and vegetable prescription program based at a farmers market. It uniquely adds to the growing evidence supporting the benefits of improved access to healthy food through collaborative community interventions. Study participants reported both statistically significant and clinically meaningful improvements in functional health and QoL.
Keywords
Vegetable prescription, Clinical significance, Quality of life, Dietary behavior, Farmers market, Reliable change index
Introduction
Fruit and vegetable prescription programs such as the FVRx® have emerged as health interventions at farmers markets throughout the United States [1]. Such programs are premised on research showing a favorable link between increased fruit and vegetable consumption and markers of health [2-4]. Fruit and vegetable prescription programs also rely on emerging community food system studies examining public health collaborations designed to improve fresh produce accessibility and consumption [5,6].
The produce prescription model has been studied as a medical intervention for diet-related chronic diseases [7], as a measure of the psychosocial benefits of farmers markets [8,9], a catalyst for nutrition education [10], a vehicle for healthy food access in low-income/low-access neighborhoods [11,12] and a learning milieu for healthcare professionals [13]. Researchers have collected quantitative biological data as well as qualitative self-reported data [14,15]. Studies have also reported outcomes of improved health perception among participants [16].
Previously reported data from year-end program evaluations of the five FVRx programs in Georgia (of which our cohort was a part) conducted by Wholesome Wave Georgia showed both socioeconomic and health benefits. In 2017, this statewide data showed that, from baseline to the end of the six-month program, the percentage of program participants reporting that “food often didn’t last” and there “wasn’t money to buy more food” decreased by 79% (22% to 4%) across all sites. Further, the overall percentage of program participants reporting that they had often gone hungry “due to lack of money for food” decreased by 89% (44% to 11%) over the course of the program [17]. The 2018 program evaluation of this statewide data found that over the relatively short six-month program timeframe, Body Mass Index decreased 1.4% and waist circumference decreased 3.3% [18].
As fruit and vegetable prescription programs grow in number and design, studies must also seek to discover the clinical significance [19] resulting from community food-healthcare partnerships. In other words, do participants self-report evidence of improved quality of life upon completing these community-based programs?
This three-year study examined whether low-income/low- access adult graduates of an FVRx program experienced favorable improvement in their subjective Quality Of Life (QoL) and function. To our knowledge, this is the first study to assess subjective change in QoL and function in fruit and vegetable prescription programs based at a farmers market using the Medical Outcomes Survey – Short Form 36 (SF-36), a standard in generic quality of life outcome metrics.
Methods & Materials
Participants
On average, 34 adults enrolled in the program annually, for three years in sum total, at no personal cost. The majority of participants came from areas with low access to healthy food options, self- identified as food-insecure and had been previously diagnosed with a diet-related disease such as obesity, hypertension, diabetes, and/or heart disease.
FVRx Program Description
The program targeted change in dietary behavior among participants and included three required components: (a) monthly clinic visits, (b) weekly farmers market attendance, (c) and plant-based cooking classes. The program was a six-month per year intervention conducted over three years (2017-2019).
Outcome Measurement
We selected the SF-36 as the outcome measure. The SF-36 is widely considered a gold standard in generic quality of life metrics, quantifying disease burden, and measuring patients self-report of functional health. It has been utilized in 4000+ peer reviewed scientific publications – of which more than 400 were randomized controlled clinical trials – and judged to be a useful tool in evaluating benefits of treatment interventions [20]. It is suitable for age ≥ 14 and requires 5-10 minutes to complete. The data is summarized in two higher order factors, termed Physical Health and Mental Health Composites which are equated to patients’ attitudes regarding overall physical and mental health status. Eight subscales are generated, reflecting physical functioning, role-physical, bodily pain, general health, vitality, social functioning, role-emotional, and mental health. Each subscale attempts to quantify a patient’s attitude in specific physical or health domains. For example; the Role-physical scale measures how much a patient believes that their daily activity is limited by physical dysfunction whereas the energy-vitality scale ranges from feeling “tired and worn out” to “full of energy and pep”.
Procedures
Prior to enrollment, we outlined the program’s attendance expectations and incentive component before participants signed informed consent forms. Volunteer healthcare providers (i.e., physicians, nurses, registered dietitians), accompanied by first-year medical students, collected baseline program-related information to include demographics, SF-36 surveys, and other data not reported herein during the initial visit. Self-reporting surveys were issued with literacy support when needed. Clinicians provided healthy eating and lifestyle education and then wrote a “prescription” for each participant to redeem for only fruits and vegetables at the farmers market. The prescription had a no-cash value of $7/person/week for four weeks each month, based on family size. For example, an adult participant with a family of four received redeemable market tokens equivalent to
$28/week ($112/month).
Participants returned to the clinic monthly where volunteer clinicians offered encouragement, provided general health and nutrition education, and renewed prescriptions. Participants attended a weekly farmers market to redeem their prescriptions for fruits and vegetables, sold by local farmers, and attended a minimum of four required plant-based cooking classes at no cost. Health educators at the farmers market provided nutrition information and cooking demos for the general public, of which participants were a part. Farmers also provided recipes and preparation tips to help demystify lesser-known seasonal fruits and vegetables.
When absent from the program, participants reported schedule conflicts, illness and lack of transportation as the most common reasons for not attending. If absent from the farmers market three weeks in a row, and/or if non-compliant with clinic or cooking class attendance, participants were listed as non-completers and unenrolled. An average 26% of participants were recorded as non-completers. Participants who completed the above-mentioned requirements and the post-SF-36 on (or within one month of) the sixth clinic visit were considered program “graduates”/completers.
Statistical Analysis
Descriptive statistics of demographic and SF-36 outcome data at baseline and at six-month follow-up were calculated. Per Protocol (PP) and Intent to Treat (ITT) analyses using SPSS 26.0 statistical package were employed to investigate change in SF-36 scores occurred after participation in the FVRx six-month program. Within subject paired sample t-tests were used to examine if statistical differences existed in each of the eight subscales or either of the two composite scales on the SF-36 after six months of FVRx program participation relative to baseline. Given the exploratory nature of this study, a conventional p-value of ≤0.05 was selected to denote statistical significance. Adjunctively, RCI also were calculated for each participant’s SF-36 subscales and composite summary scales to appreciate where clinically significant change may have also occurred. RCI calculations have been validated using normative data for general populations and several disease states [21].
Results
Of the 101 participants enrolled, 75 completed the program and had a full data set. There were no significant differences between completers and non-completers in any measured demographic, health, or socioeconomic variable. Our average participant was a female (82%) African American (76%) who earned less than $2000/month (74%) and lived in a low access area. A majority were uninsured or covered by a federal insurance program (68%) and received supplemental benefits (64%) (Table 1).
|
Table 1: Demographics. |
|
|
Demographics |
% of Sample |
|
Age 18-29 |
7.90% |
|
30-39 |
11.9% |
|
40-49 |
19.8% |
|
50-59 |
34.70% |
|
60+ |
25.7% |
|
Sex Male Female |
17.80% |
|
82.2% |
|
|
Race Hispanic, |
6.9% |
|
Asian, Asian American |
1% |
|
American Indian, Alaskan Native |
3% |
|
Black, AA, or Carib. American |
76.20% |
|
Hawaiian, Pacific Islander |
13.90% |
|
Other |
5.90% |
|
Educational background |
10.90% |
|
< High school diploma |
19.80% |
|
High school or GED certificate |
36.60% |
|
Some college or tech school |
15.80% |
|
2 year college or tech degree |
12.90% |
|
4 year college or tech degree |
4% |
|
>4 college degree |
|
|
Employment status |
|
|
Student |
2% |
|
Working part-time |
10.90% |
|
Working full-time |
25.70% |
|
Not employed, or homemaker |
15.80% |
|
On disability |
27.70% |
|
Retired |
12.90% |
|
“Other” |
5% |
|
Health Insurance |
|
|
Uninsured |
23.80% |
|
Medicated or Medicare |
44.60% |
|
Insured through employer |
21.80% |
|
Insured, private insurance |
4% |
|
Other |
5% |
|
Income level |
|
|
<$1000/month |
38.60% |
|
$1001 – $1300/month |
19.80% |
|
$1301 – $1700/month |
4% |
|
$1701 – $2000/month |
11.90% |
|
$2001 – $2400/month |
6.90% |
|
$2401 – $2700/month |
5.90% |
|
$2701 – $3000/month |
5% |
|
$3001 – $3400/month |
5% |
|
> $3401 |
3% |
|
Supplemental benefits |
|
|
No |
35.60% |
|
Received |
64.40% |
|
Average (SD) # of people aged 0-17 Living in home: 1.5 (1.6), ranging from 0 to 9. |
|
Note 1: Final sample size was N = 101, reflecting 35 participants from year 2017, 39 from year 2018, and 27 from year 2019.
All eight of the SF36 individual subscales and both of the composite scales showed statistical significance in a favorable direction implicating improved self-reported quality of life/health direction after program participation. This was true in both the PP (all P-values ≤0.002) and ITT (all p-values ≤0.028) analyses (Table 2 and Figure 1).
|
Table 2: Descriptive Statistics and Over-Time Comparisons for SF-36. |
|||||
|
Baseline |
Follow-up |
Paired Sample |
Paired Sample |
RCI |
|
|
t-test |
t-test |
||||
|
N = 101 |
N = 75 |
with case-wise |
with missing |
||
|
SF-36 Variable |
AVG (SD)/Min-Max |
AVG (SD)/Min-Max |
deletiona |
values replacedb |
+ |
|
Physical Functioning |
60.8 (28.5)/0-100 |
66.1 (26.1)/10-100 |
-3.16 (p = .002) |
-2.23 (p = .028) |
|
|
Role-Physical |
47.5 (43.1)/0-100 |
66.7 (39.1)/0-100 |
-3.99 (p < .001) |
-4.96 (p < .001) |
Yes |
|
Bodily Pain |
47.6 (25.8)/0-100 |
57.6 (25.0)/0-100 |
-3.68 (p < .001) |
-4.44 (p < .001) |
Yes |
|
General Health |
51.8 (20.1)/5-100 |
61.5 (19.0)/20-97 |
-5.36 (p < .001) |
-6.00 (p < .001) |
|
|
Energy-Vitality |
45.6 (20.6)/0-90 |
57.1 (19.7)/10-100 |
-5.29 (p < .001) |
-6.01 (p < .001) |
Yes |
|
Social Functioning |
64.5 (25.2)/0-100 |
77.2 (22.3)/13-100 |
-5.10 (p < .001) |
-5.28 (p < .001) |
|
|
Role-Emotional |
58.8 (42.2)/0-100 |
80.4 (36.0)/0-100 |
-4.10 (p < .001) |
-5.40 (p < .001) |
Yes |
|
Mental Health |
71.6 (18.3)/28-100 |
77.1 (14.7)/40-100 |
-3.41 (p = .001) |
-3.53 (p = .001) |
|
|
PCS Composite |
37.4 (11.7)/13-65 |
41.1 (10.8)/12-66 |
-4.78 (p < .001) |
-4.28 (p < .001) |
|
|
MCS Composite |
47.3 (10.5)/28-68 |
52.5 (9.4)/25-68 |
-4.98 (p < .001) |
-5.58 (p < .001) |
|
aPer protocol analysis, in that IF data was missing at time 2, THEN entire case was deleted. Total of 26 cases had missing data at time 2 resulting in a final sample of N = 75.
bIntention to treat analysis, in that all 101 participants data was included with missing data at time 2 imputed by using the average of the group. N = 101.
Note 2: N = total sample size. AVG = computed average. SD = Standard Deviation. Min = Minimum Value. Max = Maximum Value. RCI + = Reliable Change Index (Jacobson &Truax, 1991) was exceeded, indicating that as a group a reliable change in overall obtained scores at follow-up relative to baseline had occurred.
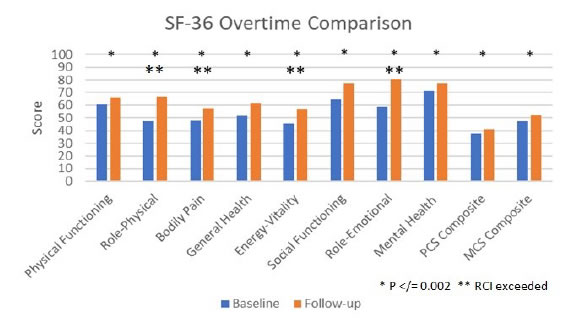
Figure 1. SF-36 Overtime Comparison.
As a cohort, the Role-Physical, Bodily Pain, Energy-Vitality and Role-Emotional scales all exceeded established SF-36 RCI for clinically meaningful change. Individually, 32% and 27% of graduates were judged to have demonstrated reliable change on the SF-36 Physical Composite Scale (PCS) and Mental Composite Scale (MCS), respectively (Figure 2).
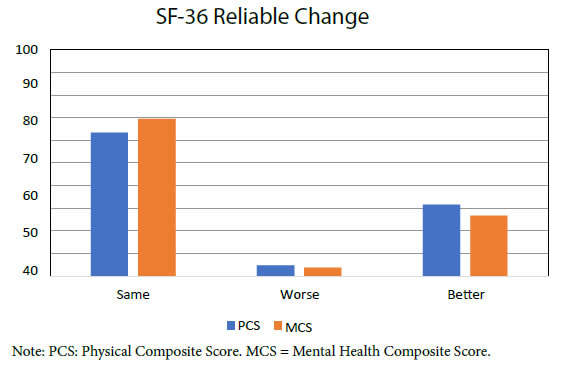
Figure 2. SF-36 Reliable Change.
Discussion
Fruit and vegetable prescription programs rely on emerging studies of community food systems. Farmers markets may provide uniquely collaborative spaces in which community health improvements can occur. Fruit and vegetable prescription programs at farmers markets are also premised on research showing a favorable link between increased fresh produce consumption and markers of health. However, little research has been published to date that has investigated the impact of participation in such programs on self- reported quality of life and function.
The present study highlights several important findings. First, the majority (75%) of participants were able to complete a six-month FVRx program requiring monthly clinic in-person check-ins and attendance in several cooking classes. The relatively low attrition rate supports the contention that this kind of programming is both viable and well regarded by study participants who have low access to healthy food options, are food insecure, and are challenged by medical morbidities including obesity, hypertension, diabetes, and/or heart disease. Second, these results highlight that after completion of the program, study participants self-reported experiencing improved physical functioning, bodily pain, general health, level of energy/pep, social functioning, and mental health while also experiencing less impact on their ability to perform expected roles because of emotions or physical challenges (all results were statistically significant). Third, over and above the aforementioned statistically significant differences, appreciation of RCIs also would highlight that clinically meaningful change in a favorable direction occurred in the areas of bodily pain experienced, level of energy/pep, and ability to perform expected roles.
Several study limitations are evident. First, as a cohort study, this endeavor was limited by lack of a control or comparison group as well as some variations in the year-to-year program requirements and implementation. We also recognize that while the socioeconomic mix of program cohorts, educators and farmers is not specifically addressed in this study, it likely represents a significant influence on its outcomes and would be a valuable area for future study. Future studies should also include a control or comparison group and be powered/ designed to estimate quality adjusted life years and cost effectiveness.
In summation, our study adds to the growing body of literature supporting fruit and vegetable prescription programs and expands knowledge of the benefits of increasing access to healthy food and wellness education within the milieu of farmers markets. The convergence of partners involved in providing these community- based collaborative health programs represents a behavioral health treatment approach with a wide variety of players and motivations. We believe increasing access to these types of programs should be a national priority.
Acknowledgements
Dozens of community members gave voluntary time as program participants; we appreciate their commitments. We also thank Augusta Locally Grown for program coordination; Wholesome Wave Georgia for program funding & design; Augusta District Dietetic Association for volunteer clinicians; Medical College of Georgia & Augusta University for volunteer students; Harrisburg Family Healthcare for hosting; St Luke United Methodist for transportation; EAT Local CSRA & Icebox Ministries for cooking education; Women in Philanthropy, Community Foundation of the CSRA, Good Neighbor Ministries, Women’s Health of Augusta and Reid Memorial Presbyterian for education program funding. Finally, we thank all the farmers of the Veggie Park Farmers Market.
References
- Schwartz H (2018) Produce Rx programs for diet-based chronic disease prevention. AMA J Ethics 20: E960-973.
- Appel LJ, Moore TJ, Obarzanek E, Vollmer WM, Svetkey LP, et al. (1997) A clinical trial of the effects of dietary patterns on blood pressure. N Engl J Med 336: 1117-1124. [crossref]
- Nguyen B, Ding D, Mihrshahi S (2017) Fruit and vegetable consumption and psychological distress: cross- sectional and longitudinal analyses based on a large Australian sample. BMJ Open 7: e014201.
- Liu X, Yan Y, Li F, Zhang D (2016) Fruit and vegetable consumption and the risk of depression: a meta-analysis. Nutrition 32: 296-302. [crossref]
- Oberholtzer L, Dimitri C, Schumacher G (2012) Linking farmers, healthy foods, and underserved consumers: exploring the impact of nutrition incentive programs on farmers and farmers’ markets. J Agriculture, Food Systems, Comm Dev 2: 63-77.
- Farmer JR, Babb A, Minard S, Veldman M (2019) Accessing local foods: households using SNAP Double Bucks and financial incentives at a midwestern farmers market. J Agriculture, Food Systems, Comm Dev 8: 153-178.
- Bryce R, Guajardo C, Ilarraza D, Milgrom N, Pike D, et al. (2017) Participation in a farmers’ market fruit and vegetable prescription program at a federally qualified health center improves hemoglobin A1C in low income uncontrolled diabetics. Prev Med Rep 7: 176-179. [crossref]
- George D, Manglani M, Minnehan K, Chacon A, et al. (2016) Examining feasibility of mentoring families at a farmers’ market and community garden. Amer J of Health Ed 47: 94-98.
- Ridberg RA, Bell JF, Merritt KE, Harris DM, et al. (2019) Effect of a fruit and vegetable prescription program on children’s fruit and vegetable consumption. Prev Chronic Dis 16: 180555.
- Buyuktuncer Z, Kearney M, Ryan CL, Thurston M, et al. (2014) Fruit and vegetables on prescription: a brief intervention in primary care. J Hum Nutr Diet 27: 186-193.
- Marcinkevage J, Auvinen A, Nambuthiri S (2019) Washington State’s fruit and vegetable prescription program: improving affordability of healthy foods for low- income patients. Prev Chronic Dis 16: 180617.
- Saxe-Custack A, LaChance J, Hanna-Attisha M, Ceja T (2019) Fruit and vegetable prescriptions for pediatric patients living in Flint, Michigan: a cross-sectional study of food security and dietary patterns at baseline. Nutrients 11: 1423. [crossref]
- Forbes JM, Forbes CR, Lehman E, George DR (2019) “Prevention produce”: integrating medical student mentorship into a fruit and vegetable prescription program for at-risk patients. Perm J 23: 18-238. [crossref]
- Cavanagh M, Jurkowski J, Bozlak C, Hastings J, Klein A (2017) Veggie Rx: an outcome evaluation of a healthy food incentive programme. Public Health Nutr 20: 2636-2641. [crossref]
- Schlosser AV, Smith S, Joshi K, Thornton A, Trapl ES, et al. (2019) “You guys really care about me…”: a qualitative exploration of a produce prescription program in safety net clinics. J Gen Intern Med 34: 2567-2574. [crossref]
- Jennings L, Marpadga S, Bonini C, Akers M, Levi R, et al. (2019) The impact of a community fruit and vegetable voucher program (Vouchers 4 Veggies) on improvements in dietary intake and food security. Current Dev in Nutr 3: 4-13-19. [crossref]
- Cook M, Ward R, Mister T, Webb Girard A (2018) Evaluation of the 2017 fruit and vegetable prescription program. Prepared for Open Hand Atlanta and Wholesome Wave Georgia.
- Cook M, McClintic E, High L, Webb Girard A. Evaluation of the 2018 fruit and vegetable prescription program. Prepared for Open Hand Atlanta and Wholesome Wave Georgia. [Preprint]. 2019 [cited 2020, Jun 23].
- Jacobson NS, Truax P (1991) Clinical significance: a statistical approach to defining meaningful change in psychotherapy research. J Consult Clin Psychol 59: 12-19. [crossref]
- Ware JE, Sherbourne CD (1992) The MOS 36-item short-form health survey (SF-36): I. conceptual framework and item selection. Med Care 30: 473-483. [crossref]
- Ferguson RJ, Robinson AB, Splaine M (2002) Use of the reliable change index to evaluate clinical significance in SF-36 outcomes. Qual Life Res 11: 509-516. [crossref]