Abstract
We present a novel way to increase the ability of students to think creatively and critically. We follow the approach used by students of the Jewish Talmud. The students are presented with a case or topic (an ANIMAL which wanders around destroying), instructed to create four questions relevant to the topic, and then to provide four answers (elements) to each question. The elements are mixed into vignettes according to an underlying experimental design, ensuring that each respondent evaluates a unique set of 24 vignettes. Each respondent is told to adopt one of two judgment criteria, to be lenient or to be stringent in terms of evaluating the evidence presented by the vignette. Each vignette is rated on a 5-point scale, ranging from innocent to guilty. External respondents evaluate the vignettes, and the data presented in immediately analyzed form. The process provides a structured path for students to think in a creative manner when setting up the study and when they discuss the results from the real experiment. The students emerge as creative critical thinkers and experimenters. The opportunity now exists for students to grow in their thinking, with concrete results, and exciting, ‘new-to-the-world’ discoveries, both motiving the student at the time of the ‘experiment’, as well as generating a student-created portfolio of studies showcasing the ability to think at a deeper level.
Introduction – Today’s Problem with Education
We live in a metric society, a society which measures all aspect of life, especially in the world of education [1]. The result is the sense that everything can be understand and redirected through these measures. The folk wisdom from many years is ‘that which is measured is done.’ The folk wisdom is right, because it seems to be the repeated observations that people move towards satisfying the demand of measurement. Somehow, it appears that anything that can be measured can become a way to set goals. It may just be that what is measured gives a specific value towards which one can aim. One may not be able to perform to reach a general goal, described by a paragraph, but it is extremely easy to put out a measure, and to measure how close people are to the measure. Eventually the measure itself becomes hallowed, and people stop thinking about what the measure means.
About two thousand years, in both Jerusalem and in Babylonia, after the destruction of the Second Temple, the rabbis who were to found today’s Rabbinic Judaism, the traditional Judaism was we know it, were concerned that the foundations of much of Jewish practice and religious thought would be brought to its end through the seemingly irresistible might of the Roman Empire. The movement was afoot to preserve Judaism in study halls with student and their teachers arguing the fine points of the law. Emerging from this give and take was the Talmud, the so-called ‘Oral Law’, comprising both legal discussion and stories, ‘halacha’ (the way), and ‘midrash’ (the exposition) [2,3].
What is important here is that the students were both taught the ‘law’ as immutable, but the specifics of the law were to be deduced by discussions, by back and forth, by critical and creative thinking, respectively. And so emerged schools of law and practice, the Yeshivot, in which students would sharpen their minds by study in groups he holy writings and the law and law commentaries. The learning was not rote, but demanded the discussion, the understanding of ‘why,’ and the ability to bring forth supporting prooftexts for any point of view. This type of learning is relevant today) [4-6].
As we move forward to today, we see a different world of education, one which is accused of failing the student. The failure of K-12 education world-wide, presented in paper after paper [7-9] suggest the opportunity and the need need for students to re-learn the art and practice of how to think creatively and critically. We live in a time when students must once again learn to argue, discuss, think, create, deduce, and so forth, cogently, effectively, and most of all correctly. In a world information is abundant, easily opened by typing or evening asking Apple’s Siri, or Google’s Assistant, more than ever the need is to return to creating students, not simply automata who can find any fact through the deft use of search engines. Knowledge may be easy to obtain today, thinking less so, critical, creative and exciting thinking far less so.
Doing an Experiment With Ideas
The notion of ‘experiment’ and ‘Talmud’ seem to be at odds with each other. We are accustomed, whether explicitly or implicitly, to hold that the word of Torah is immutable, subject to interpretation in accordance with ‘revealed wisdom.’ There is a ‘right’ way. The goal of Talmudic discourse is to find that right way, by bringing together prooftexts, using allowed principles of interpretation (e.g., the 13 hermeneutic principles of Rabbi Ishmael; Yadin, 2003) [10]. Once these principles have been understood, one can proceed to interpret, always being sure, however, of remaining within revealed knowledge, and accepted practice. The highest goal is for the student to contribute penetrating questions, as well as insights, accepted novella, a goal reached by few, and a goal which eludes many others, the more typical students whom one encounters.
How can we impart the excitement of learning, the joy that must have been experienced by scholars during the last two millennia, scholars about whom we read, but whose very enjoyment of learning is shared by so few? Can today’s technology reignite love of learning, real love, and not just perfunctory expression?
Can we make the methods of the Talmud, but for a secular world, exciting to the student, engaging, and thrilling when the student matures into creative thinking? In the Talmud creativity stops is founded on interpreting the written text, making itself evident in with the discussions, and of course with the written commentaries. Here we want to reproduce the joy of learning, the joy of becoming creative in learning, not for the scholar but for the every-day student, who is only beginning the journey of learning. The pattern be modeled on Talmud study but generalized to the from the mind of the student, living in today’s world, working with holy or the secular, the special or the quotidian, the mundane.
Let us transform ourselves, becoming scholars in the ways the ancient students became scholars, through the study of cases, the and the discussion of these cases. Let us rewrite the past, recreating old ways of learning, recasting them for today’s world, focusing on today’s needs. Let us take the cases of the Talmud, update them to today’s world but in the same form, expand these cases into different features, combine the features of these case in different ways, creating different ‘what if’s’, and telling different stories. But let’s not stop there… the effort is only half done. Now continue. Present to a panel of judges these new cases, developed by the students, instructing the panel of judges give a so-called in Hebrew a ‘psak’ a judgment on each respective case. Do this process for topics far and wide, topics from the Talmud perhaps, but then topics of any sort which engage the student [11,12].
What happens when the student who develops these cases discovers exactly how the judgments from ordinary people are ‘driven by’ each idea in the case, each idea developed by the student who creates this updated case? Can we create a new, engaged spirit for learning, one in which today’s student is an active creator of knowledge, and by doing so, become a deeply involved student?
This approach did not emerge by accident. It came about through a deep study of psychology of experimental design, statistics, consumer research, and the law. For many years, really a half century, these approaches have been involved in business, creating new products, helping schools (even yeshivas) understand how to communicate, and being a scientist. The approach has been used almost 30 years ago at first to create the cash back credit card in 1993 for Discover Card in Chicago, and the Oral B Mechanical Toothbrush in 1992 for Oral B Inc. in California. These same principles are now being approached to guide the student to a new level of understanding, encouraging creative thinking, and critical thinking [13].
So, what is this Approach Really, and What does it Deliver?
One of author HRM’s favorite sections of the Talmud is Shor Shenagach, The Ox Which Gored. Why? Because despite the topic, unusual to city-folk, is in essence real, quirky, and has aspects of ‘fun’ when the different aspects of the case are elaborated by students using their imagination. The topic, the Ox Which Gored, is one of the first sections taught to beginning students. The facts of the case are concrete, and it is simple, understandable, and can be easily identified with. So why not a ‘riff’ on that topic, to teach thinking to a new world, new people taught old problems, with creative methods?
The problem was how to drive creative thinking by the judicious application of experimentation to this age-old topic, the Ox which Gored, or more realistically the legal issue of someone destroying the property of another through a third agent (the ox). We wanted to be both respectful of the original topic — have it relate to the section of the Talmud, but also be creative — moving outside to explore ideas such as the behavior in the court, and whether it made any difference. To do so we enlisted the help of a student in a Jewish School (yeshiva) to ‘fill in the blanks,’ thus making the issues relevant for exploration using today’s computer technology.
We move now to a technology which explores the mind in a systematic way Mind Genomics. In its broader scope, Mind Genomics is simple, powerful, emerging science, one which makes it possible to understand how people think about the topics of the everyday. Mind Genomics is fast, simple, teaches, and encourages creative and critical thinking [14,15].
The Method Behind Mind Genomics
Let us apply Mind Genomics to the case of the ‘Ox Which Gored.’ Imagine we want to find out whether a person is to be let off, scot-free, or judged guilty and even fined in a case … a case recreated to follow a topic in the Talmud but recreated by the students based on their own thinking. We follow the steps below. By the way, they are the same steps as we follow for studying a teacher, studying a topic in business like what makes a good businessperson, what makes two countries fright with each other, and so forth.
The ideal here is to have a group of 2-4 students collaborate, a chevruta of students who will imagine, create, experiment, learn, and together build a portfolio of experiments, perhaps experiments finding their topics in the historical books, such as the Talmud, but brought up to date, and expanded using their minds and imaginations.
The specific process is templated. Figure 1 shows an example of the set-up for the study, with four panels. The BimiLeap program guides the researcher through the study, with the typical set-up taking about 15-20 minutes, after one is one familiar with the program. The BimiLeap program has been set up to guide users, step by step, in the process, without suggesting too much. The underlying world view is that with one or two attempts, the thinking will emerge from the mind of the user, not from the program
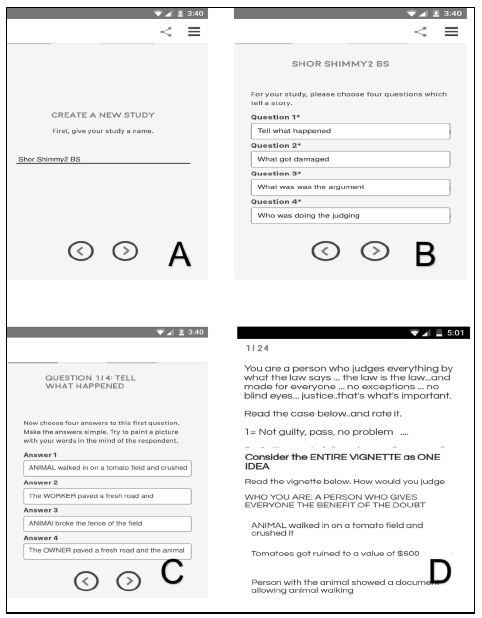
Figure 1: The four steps for the setup of the Mind Genomics ‘experiment’ about the ‘Ox which gored’.
Step 1 – Pick the Topic
Here it is a recreation of the Mishna ‘Shor Shenagach’, the Ox Which Gored. As noted above, the topic can be anything. For this example, selecting a topic used to introduce students to the study of the Talmud seems appropriate, because we can show how old methods of learning can be updated to become fun, with an aspect of the ‘daringly new,’ not known to teachers or fellow as students, at least as of this writing.
Step 2 – Ask Four Questions Which are Relevant to the Topic, Questions Which Tell a Story
It is a bit of effort, but the exercise is a powerful, effective way to teach one how to think. It is at this point that students find the approach difficult. They are accustomed to learning facts, and even deep reasoning but we are asking to think about the topic, to structure an inquiry, i.e., to organize without any information yet to be organized.
Step 3 – For Each Question in Step 2, Give Four Answers, Each Answer a Phrase, not Just a Word
Table 1 shows us the four questions ‘which tell a story’ (the case), and the four answers to each question, the answers providing specifics. The answers (elements) are easy to create once the questions are selected.
Table 1: The four new questions and the four new answers to each question.
| Question 1 – What happened? | |
| A1 | ANIMAL walked in on a tomato field and crushed it |
| A2 | The WORKER paved a fresh road and the ANIMAL started making a real mess |
| A3 | The ANIMAL broke the fence of the field |
| A4 | The OWNER paved a fresh road and the ANIMAL started making a real mess |
| Question 2 – What got damaged? | |
| B1 | Tomatoes got ruined to a value of $200 |
| B2 | Tomatoes got ruined to a value of $600 |
| B3 | Owner must rebuild an entire fence |
| B4 | ANIMAL broke the main water line …crops dried up and died |
| Question 3 – What happened in court? | |
| C1 | Everyone was screaming at each other |
| C2 | Owner attempted to kill the ANIMAL in his anger |
| C3 | Person with the ANIMAL showed a document allowing ANIMAL walking |
| C4 | Everyone left… not talking to each other … but mad |
| Question 4 – Who was doing the judging? | |
| D1 | Judges are local farmers who know the land |
| D2 | Judges are local magistrates (judges) who always are ‘in session’ |
| D3 | Judges are regular people … local businesspeople |
| D4 | Judges are clergy from the religious groups in the town |
Step 4 – Mix the Answers To Create A Simulated Case, Also Known as A Vignette
This is done by a computer program (BimiLeap; Big Mind Learning App). The strategy is to create 24 such simulated cases, each case comprising 2-4 answers or element in bare form, one line atop the other. The simulated cases look like a ‘blooming, buzzing confusions’ in the words of the famous psychologist, William James, who was asked to describe the sense of the world to a newborn child. Nothing could be further from the truth, however. The 24 elements are combined in a manner strictly defined, so that each element is statistically independent of every other element, allowing for high level analyses later, when the data are analyzed. Each of the 16 elements appears an equal number of times, and statistically ‘independent’ from the other 15 elements. Finally, each respondent evaluates a totally unique set of 24 combinations, combinations which follow the same structure. The difference across respondents is that the underlying design is ‘permuted’ to maintain the basic design, the combinations are different. This approach, the permuted experimental design ensures that the study covers a great number of the possible cases [16,17].
The process is summarized for this study in Figure 1, as noted above. Figure 1 comprises four panels, taken from screen shots of the study. The computer was told that this would be ‘Shor Shimmy2 BS’ (short for Shor Shenagach, the Ox Which Gored, by Shimmy), second study, with respondent instructions to be strict, the ‘law is the law.’ (viz., like School of Shammai).
Panel A shows the first step. Students pick a name for the topic. For this study the students (under a bit of guidance) chose the topic of ‘Shor Shenegach,’ the Ox Which Gored. Picking a topic is easy, although one might be surprised that without a bit of encouragement many students feel that they cannot ‘choose’ a topic. The terms BS refers to the ‘School (Bais) of Shammai’, a group of students and teachers who were notoriously strict interpreters of the law.) The instructions will tell the respondents to be ‘strict with their consideration,’ without bringing up any connections with historical situations at the time of the Talmud.
Panel B shows the four questions. Here is the hard part. The user must generate exactly four questions which tell a story, a task which seems easy at first, yet to the newcomer a task which often is daunting. We are not taught to think this structured way, to deconstruct a situation into a set of four questions which tell a story. Yet that talent, that ability, will be valuable in thinking creatively and critically. The four questions eventually emerge, often taking 10-15 minutes, as the students grapple with the topic, and try to come up with a ‘story in questions.’ Our four questions may not be the best, but they are those chosen by the students. Note: Almost everyone who starts on this process asks ‘Am I doing it right? Are these the right questions and the right answers? There is no right nor wrong questions. With practice the questions will be better, as will the answer. The group or individual doing this set-up will become more efficient with practice; each student will think better.
Panel C shows the four answers to the first question, these four answers also provided by the same students. Observations over the past several years suggest that the questions are harder to develop, whereas the answers to the questions are much easier. The answers are expressed in English, in simple phrases, with few if any subordinate phrases. Table 1 above shows the full set of questions and answers. Panel D shows an example of an introduction to the vignette, a vignette, instructions how to rate the vignette, and one of the 24 vignettes, this vignette with only three answers, one answer each from three questions. Behind the scenes the Mind Genomics program works with a recipe book, creating these combinations at presenting them.
Two procedure questions always emerge…. WHAT does the respondent see, and WHO evaluates the vignette? To answer the first question, the questions never appeared in the vignette, only the answers did. The questions are selected to motivate the answers. The WHO are people from a panel (here Luc.id, a company specializing in these studies), or the respondents can be from two groups in a single classroom, who compete.
Step 5 – Select an Orientation and a Rating Question, for this Case a Judgment of the Case
The experiment comprised two smaller cells, one cell with the respondent instructed ahead of time for each vignette to be lenient (Cell 1), and the second with the respondent instructed ahead of time for each vignette to be strict (Cell 2).
Panel D Shows the instructions to the stringent group (BS, School of Shammai) The text is You are a person who judges everything by what the law says … the law is the law…and made for everyone … no exceptions … no blind eyes… justice..that’s what’s important.
Not shown are the complementary instructions to the lenient group (BH, School of Hillel). The text to the lenient group is: You are a person who judges everything leniently…and gives everyone a fair shake…. no matter what… and turns a bit of a blind eye when needed.
The rating scale comprises five points, anchored at 1 and 5, respectively.
1= Innocent, No need to pay…. 5 = Guilty, Pays a fine for damages.
Step 6 – Invite Respondents to Participate, and Run the Study Usually Lasting 3-4 Minutes
This is easiest with a panel of respondents who are accustomed to do surveys such as this one. Fellow students can participate as well, but the results come back far more quickly with an online panel (minutes, rather than hours and days).
Each person who participates receives an email, and instructions to read the vignettes, participates in an experiment on the web lasting 3-4 minutes. The respondent spends about 4-6 seconds on each case, the above-mentioned vignettes, each comprising 2-4 statements and a rating scale.
A total of 90 respondents participated, all provided by Luc.id. 60 respondents participated with instructions to leniently (BH), 30 respondents participated with instructions to judge stringently (BS).
Making Sense of the Results
One of the recommended steps to ‘understand’ one’s data is to plot the data, in colloquial terms to ‘get dirty with the data, roll around, and get a feel of what are the results.’ In an era of rapid analysis, it is tempting to forget that, rushing immediately to the high-level analysis, without having a sense of what the data are saying at a very preliminary level. The effort of digging into the raw data is worth it, in terms of understanding, however.
Figure 2 shows two panels of the graphs each. Each graph on the top panel is a histogram, showing the number of ratings on the scale 1-5 (5 columns, one per point). Each graph on the bottom panel is a response time. The response times distribute from 0 seconds to 9 seconds. The bottom graph shows 10 columns, spaced out in a so-called logarithmic scale. That scale is used because most of the response times are shorter than 2 seconds.
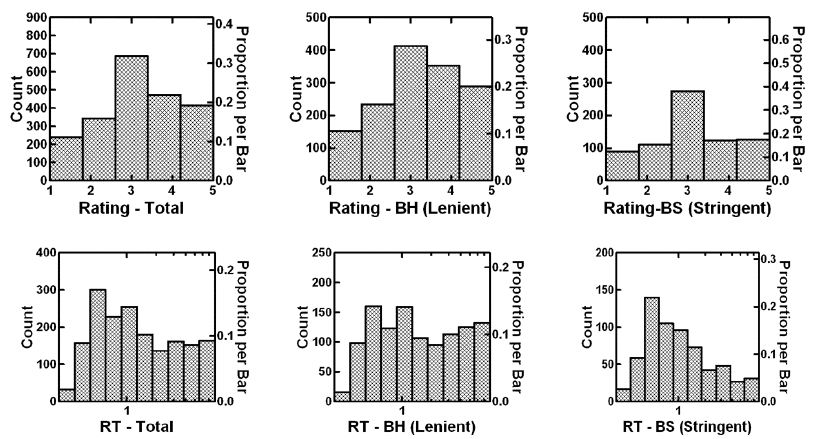
Figure 2: Distribution of ratings and responses times for the total panel and for respondents instructed to judgment leniently (BH) and for respondents instructed to judge stringently (BS).
The top set of graphs shows that the rating 3 is the mode, the most frequently selected rating. There is another observation which is lurking right below that. The first observation is that despite the instructions to judge ‘leniently,’ the respondents tend to judge the cases on the harsh side! We see this in the middle graph at the top, showing the ratings on the 5-point scale. There are many more ratings on the 5-poiont scale, the side of punishment, than there on are the side of the scale towards innocence. Our first conclusion is that it is probably easy to instruct people how to judge, viz., lenient or stringent, but hard for people to alter their way of thinking and judging, simply based on external instructions. This insight is our first, and a topic which should stimulate some discussion about ‘why is this the case?’
The second observation comes from the response times. The third graph on the right shows the distribution of response times for the respondents instructed to be stringent. The distribution of response times suggests that most of the response times are short. That is, it is easy to make judgments when the respondents are told to judge stringently. This is a normal way of looking at the case. When the respondents are instructed to judge leniently, the response times are longer, as if the respondents have to think about their judgments, because the tendency to judge leniently is not a natural one.
Going Deeper Into the Data To Really Understand The Judge’s Mind
Plotting out the distribution of ratings across the vignettes starts to give us hints about the mind of the respondent. At this point, we are at the stage where the results start to become interesting, and hopefully intrigue the student. We have learned that instructing the respondent does not necessarily work. That’s a discovery a student can ‘own,’ and talk about with others.
There is more. The experimental design mixes and matches the messages. The respondent evaluates the combinations, almost in a fashion that we might consider ‘intuitive,’ if we were generous, or better ‘indifferent’ if we were to be accurate. Indeed, the term indifferent sums up the way most people approach the typical events of their lives, the ordinary, quotidian events which become the fabric of daily life (Kahneman, 2011) [18]. Creating our mixtures of elements through the statistics of experimental design enables deconstructing the rating of these vignettes, to discover the ‘driving’ power of each element. That becomes another source of excitement to the student,
After one of these studies, it makes sense to ‘interview’ the respondents, to ask what they were thinking, what did they feel, and so forth. Most respondents in this so-called ‘exit interview’ confess, often guiltily, that they ended up these judgments without thinking, almost automatically, even though they had started the experiment with the intention of ‘doing it right, giving the right answer’. They simply could not. There was too much information. So, the respondents often admit that they simply assigned numbers at a gut level, without thinking. We soon will find patterns in the data which tell us, but more important, tell the student researchers, student experimenters, that despite what they hear, there ‘gold in them hills.’ It’s a matter of systematic analysis, a templated approach which is automated, relieving the student of the hard and grinding work.
The next step in the analysis is to deconstruct the ratings, originally on a 1-5 scale, into two new scales, both having just two points, 0 and 100, respectively. The rationale for the transformation comes from decades of experience by political pollsters and market researchers. Although the data from a 5-point scale tends to be more sensitive to differences, the frank reason is that most users of the data do not know how to interpret the results. The user of the data will readily admit that although the scale seems reasonable, the user does not need the precision to make use of the results. The user simply wants to know ‘what is good’ and ‘what is bad’ in terms of a meaningful criterion (viz., guilty or innocent, respectively, in our study.)
To make the data simpler to understand we perform two transformations on the data:
Guilty (Top2)
Ratings 1-3 transformed to 0 to denote not guilty; ratings 4-5 transformed to 100 to denote guilty, Afterwards, a small random number is added to each binary transform so that the binary rating has some modest degree of variation, necessary for the statistical analyses which follow.
Innocent (Bot2)
Ratings 1-2 transformed to 100; ratings 3-5 transformed to 0, and a small random number added to each binary transform)
Over the past century or more there has been an ongoing debate, albeit an informal one not often surfaced, that the graded scale, the 1-5 scale is probably more sensitive than a binary scale. That is true because the graded or Likert scale is more inherent granular, and more sensitive to small details. The problem with the granular scale is that people who use the results often ask about the specific meaning of each scale point, a question not easily answered. Thus, the resort to analyzing data with the the less sensitive but easier to understand scale, guilty or not guilty, innocent or not innocent, respectively. They are not opposites, since there is a middle point not counted for guilty or for innocent respectively, scale point 3.
After the transformation, which is done automatically by the BimiLeap program, ‘behind the scenes,’ the actual workhorse analysis is done, also behind the scenes. The analysis is the well-known method of OLS (ordinary least-squares) regression, also known as curve-fitting. The process fit an equation to the data, so that the equation predicts the dependent variable based upon known levels of the independent variables.
For our study there are 16 independent variables, small, structured combinations of which become the vignettes, evaluated as a single set of ideas. Regression related the presence/absence of these 16 variables, the elements, to the transformed rating (Guilty or Not Guilty; Innocent or Not Innocent, respectively.)
The independent variables take on one of two values, the value ‘0’ when the element is absent from the vignette, and the value ‘1’ when the element is present from the vignette. Most of the predictor values will be simply 0, based upon the experimental design.
Each data row, corresponding to a vignette, comprises two, three, or four values of ‘1’, and the remaining 14, 13 or 12 ‘0’s’, respectively.
In turn, the dependent variables take only on only one of two values, 0 or 100. The specific transform depends upon the rating assigned, and the rule for transformation. The data are now prepared for virtually instantaneous analysis by OLS regression, also done behind the scenes, so that the student can enjoy the experience of thinking, experimenting, and discovering in almost 0 time (viz., 1-2 hours for most effort).
The OLS regression analysis shows the coefficients from the equation, in the form of a table. Table 2 shows the model for INNOCENT, Table 3 shows the model GUILTY. The equation below says that the likelihood of a guilty verdict (Top2) is a constant and 16 weighting factors, one for each of the 16 elements, A1-D4. Note that the exact same interpretation applies to the equation relating the innocent verdict (Bot2) to the elements. The numbers in the equation, called parameters, are returned by the BimiLeap program in the form of a simple set of tables, easy to read.
Table 2: The models for ‘INNOCENT’ for total panel, School of Hillel (BH) and School of Shammai (BS), and two complementary mind-sets clustered and created using judgments of INNOCENT. Only the positive coefficients appear in the table.
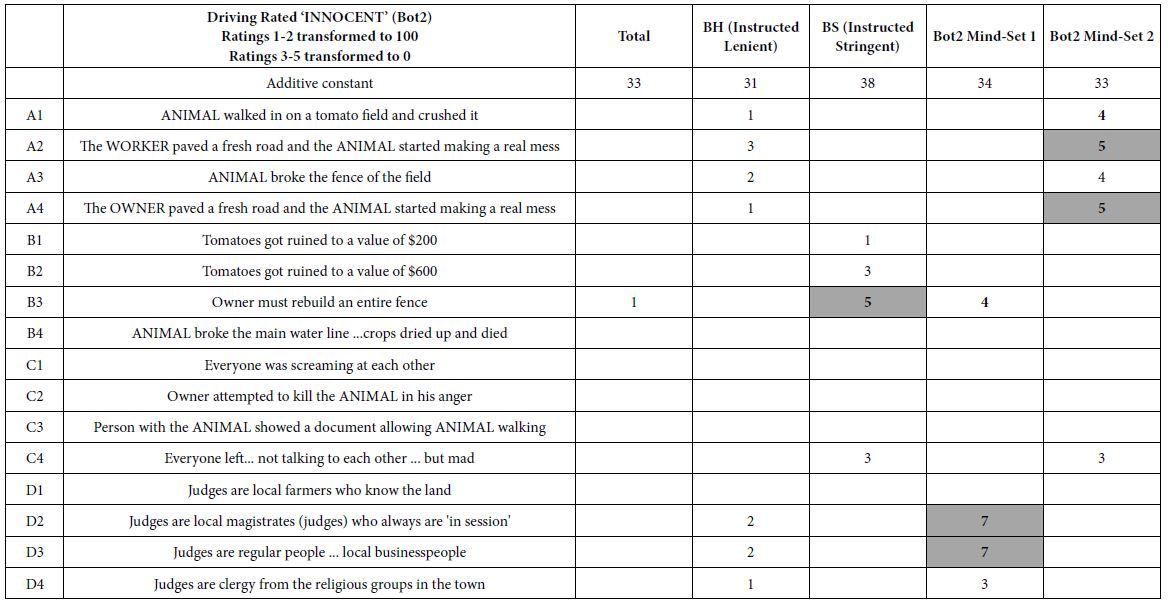
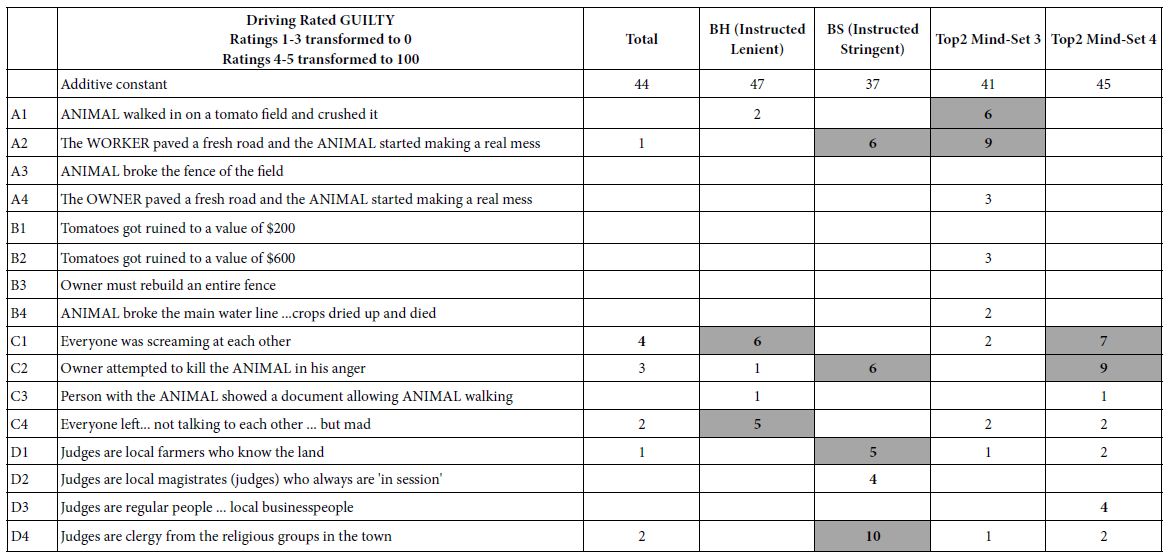
Table 3: The models for ‘GUILTY’ for total panel, School of Hillel (BH) and School of Shammai (BS), and two complementary mind-sets clustered and created using the judgments for GUILTY.
Dependent Variable (Top2, Guilty) = k0 + k1(A1) + k2(A2) … k16(D4)
a. The additive constant k0, is, metaphorically the ground floor. Thus, when the regression comes back with an additive constant of 28 for the variable Top2 (guilty), we interpret that to mean that in the absence of any elements we estimate the likely proportion of ratings of 4,5 (guilty) to be 28%. The additive constant may be interpreted as a sense of basic likelihood to find the defendant guilty in the absence of facts (Top2) or find the defendant innocent in the absence of facts (Bot2). Just knowing the value of the additive constants for a group of respondents is sufficient material to ignite a discussion among the students as to how one can be instructed to pay attention just to the facts and ignore a predisposition when making judgments.
b. The additional guilt (or reduction of guilt) for each element, metaphorically the height of each part of the building beyond the ground floor. There can be negative values as well such as when the element reduces guilt. Thus, we the regression suggests a coefficient of + 6, we interpret that to mean that beyond the additive constant (viz., the 28%), we expect to see an additional 6% of the responses be 4 or 5, respectively, for a value of 24. In the interests of simplicity, Tables 2 and 3 show only positive coefficients, elements which directly drive the verdict of Innocent (Table 2), or elements which directly drive the verdict of Guilty (Table 3).
c. The students discussing the results can reconstruct arguments (combinations of elements and additive constant), which either drive a verdict of Innocent, or drive a verdict of Guilty. The output is a sum of additive constant and coefficient, a number which provides the student with a tool for deeper understanding and excitement to look for patterns in the numbers. The only caveats are that the newly constructed vignette must comprised a minimum of two elements, a maximum of four elements, and at most one element from each question. This caveat reproduces the way the original vignettes were created. The ability to ‘know’ the underlying algebra of the mind of the ‘electronic jurors’ who participated provides the student with the tools to discuss simulated cases, with new combinations of elements. The student can easily construct new combinations and estimate the percent of responses to that combination, either in terms of guilty (estimated value of Top2), or in terms of innocent (estimated value of Bot2).
Up to now we have discussed only the analysis of the ratings themselves, presumed to be under the conscious control of the respondent. The Mind Genomics process further measures the time between the appearance of the vignette and the response. This total response time is deconstructed into the contributions of the different elements. Now the student can understand ‘engagement,’ viz., the number of estimated seconds occupied by the respondent reading the element and thinking about it. Again, the objective is to understand the mind of the respondent, bringing in new ways of thinking to traditional topics, with the BimiLeap programming doing all the hard ‘grunt’ work, and emerging with a table of results ready for discussion. The analysis of response times is similar to the deconstruction of the ratings. The differences the dependent variable (response time in seconds), and the absence of an additive constant. The additive constant is presumed to be 0 for the response time model, because in the absence of a stimulus vignette there is no underlying ‘tendency’ to respond. The equation is written below, and estimated by the same approach, OLS (ordinary least-squares regression).
Dependent Variable (Response Time = k1(A1) + k2(A2) … k16(D4)
Two Different Ways to Divide Our Respondents – By What We Instruct, By How They Think
It is when we divide our respondents in different ways, and look at how they make their judgments, that we can excite many students. It is at this point, in the study of individual differences, that the student’s imagination may be further fired up.
When we set up the experiment, we divided the respondents into two groups, based upon the instructions about how to judge the case (BH – lenient; BS – stringent). These instructions are imposed from the outside. We know the instructions provided to each respondent, whether the respondent was assigned to the BH group or the respondent was assigned to the BS group.
We can divide our respondents in a new fashion, by mind-sets, different and clear ways that the respondents weigh the information to drive a rating. Experimental psychologists and market researchers, and especially those working with Mind Genomics, have found that people differ profoundly and organically in the way they think about a topic. That is, the differences seem to be built in, and not a function of who the people ARE, what they people SAY they believe, or even how the people have previously BEHAVED. These differences, called mind-genomes, are empirically discovered ways by which people differ in their judgments for specific, granular situations (Moskowitz, 2012; Moskowitz et. al., 2006) [14,15].
The mind-sets are created by considering the 16 coefficients for Top2 (guilty). Each respondent generated a separate equation, estimated once again ‘behind the scenes.’ The set of coefficients is analyzed by a program called a cluster program (Dubes and Jain, 1980) [16]. Respondents are put into two or three groups (here two groups), based upon the pattern of their 16 coefficients for Top2. We find that the people naturally divide into a limited number of groups, clearly interpretable, groups specific to the topic. A good metaphor is the set of ‘primary colors’ (red, blue, yellow) for the particular topic being studied. We then create two pairs of models, one pair based on clustering using the Bot2 coefficients (MS1 vs MS2), and the other pair based on clustering using the Top2 coefficients (MS3 vs MS4). By having the BimiLeap program do all work ‘behind the scenes,’ and by having the results returned to the student in the form of a PowerPoint to be shared, discussed, and presented, the Mind Genomics system now enjoys the further potential of exciting the student.
Looking at the Data for Innocent (Bot2), Guilty (Top2) and Engagement (Response time)
We begin with the detailed analysis, shown in Table 2 (Innocent), Table 3 (Guilty), and Table 4 (response time). Each table will be set up similarly. The elements will be on the left, the first data column will correspond to the total panel, the second and third data columns will correspond to the two sets of instructions (lenient vs stringent, respectively), the fourth and fifth data columns will correspond to the two mind-sets created using the appropriate model.
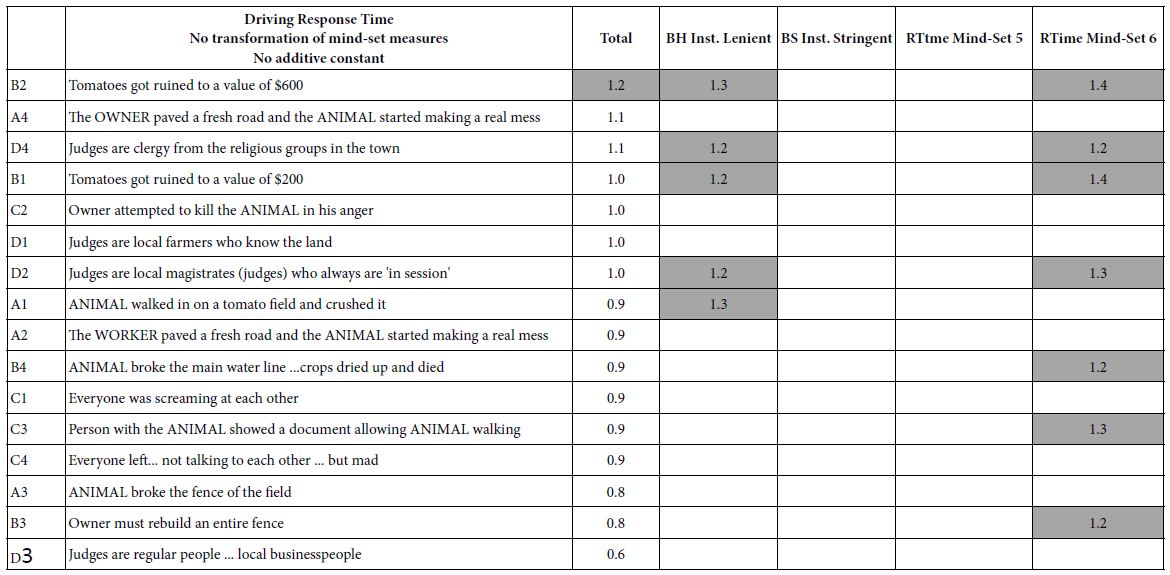
Table 4: The models for ‘response time’ (engagement with the element) for total panel, School of Hillel (BH) and School Shammai (BS), and two complementary mind-sets based upon the patterns of response times.
We look at the three sets of models, one set at a time, to identify interesting points.
Innocent: Table 2 shows the parameters for the five models.
- The additive constants are 31-38, meaning about one in three responses (viz., verdicts) are likely to be Innocent the absence of elements, viz., a one in three proclivity to leniency.
- Paradoxically, instructing a respondent to be lenient generates a person who is less lenient (BH, additive constant 31), and instructing a respondent to be stringent (BS, additive constant 38).
- Instructions to the respondent regarding lenience vs stringency , do not make much of a difference. The coefficients for BH (drive to leniency) are low, as are the coefficients for BS (drive to stringency)
- Differences emerge when one clusters the respondents based upon the pattern of the coefficients for lenience Mind-Set 1 is lenient when the defendant must make total amends, or when it appears that the legal system is stacked against him. Mind-Set 2 is lenient when the story emphasizes an ANIMAL.
- Overall, there are remarkably few ratings of ‘Innocent,’ even when the respondents in one of the groups (BH) are specific instructed to be lenient in their judgments.
Table 3 shows the parameters of the models for GUILTY (Top2). The two mind-sets, Mind-Set 3 and Mind-Set 4, emerged from clustering the coefficients based upon the individual models for Top2 (Guilty). The patterns emerging from Table 3 are quite different. That is, when we look at the data from the perspective of judgments of Guilty, we see different elements emerging, elements which are much stronger performers.
- The additive constants are 37-47, meaning about two in five responses are likely to be Guilty in the absent of elements. It appears that people are more ready to judge the defendant to be guilty, rather than innocent, in the absence of information. For the total panel, as an example, the additive constant for innocent (Table 2) is 33, whereas the additive constant for guilty (Table 3) is 44. This is a topic for the students to discuss.
- Instructions to the respondents regarding leniency vs stringency (BH vs BS) again show an unexpected reversal when we look at ratings of Guilty. BH, instructed to be lenient shows an additive constant for guilty of 47. BS, instructed to be stringent, shows an additive constant for guilty of 37! This is a dramatic reversal in what we expect and should lead to questions about the instructions to the jury by those in authority.
- The two new emergent mind-sets differ in what messages or elements drive them to assign a verdict of guilty. Mind-Set 3 votes guilty when the case talks about the actual damage. Mind-Set 4 is most stringent when the case talks about the emotional response of the litigants.
- Overall, there are many elements driving stringency in the ratings, and 13 elements out of a possible 80 show a significant level of guilty (viz., 5 or higher, based upon a standard error of 5 for the coefficient, from statistical tests.)
Table 4 shows the results for response time. Response times need not have anything to do with judgments of innocent or guilty, but rather measure the time to ‘process’ the information in the elements. Table 4 shows the same sets of groups, Total Panel, lenient vs stringent instruction (BH vs BS), and two newly created mind-sets based upon the pattern of response times. As noted above there is no additive constant in the model. The data from the total panel are shown for all 16 elements. For the four groups, and in the interest of readability of the results, only the response times of 1.2 seconds or longer are shown, considered to be those elements to which the respondent paid attention. These long response times are shaded as well.
- The data are sorted from high to low using the coefficients from the Total Panel. These response times give a sense of the range of times across the 16 elements. The longest response time is 1.2 second B2: Tomatoes got ruined to a value of $600. The other element, with almost as long a response time is: A4: The OWNER paved a fresh road and the ANIMAL started making a real mess. Both these elements deal with facts. The remaining response times are shorter, down to 0.6 seconds, D3: Judges are regular people … local businesspeople.
- When the respondent is instructed to be lenient (BH), the response times are substantially longer, with five of the response times being 1.2 seconds or longer.
- When the respondent is instructed to be stringent (BS), the response times are universally shorter. It may well be that the mind-set is to judge, and to judge means to judge stringently, not to judge leniently.
- Dividing the respondents by the pattern of response times means not paying attention to long response times versus short response times, but rather focusing on the similarity of patterns of response times across the 16 elements. Considered from that perspective, Mind-Set 5 shows universally short response times. Mind-Set 6 shows seven of the 16 elements driving long response times. Mind-Set 6 engages with the information, whereas Mind-Set 5 does not.
Deeper Understanding by Plotting Coefficients
We began the analysis by plotting the distribution of ratings, an exercise which gave us some idea of the differences among groups. That plot was equivalent to looking at a world from the outside, seeing ‘stuff move around in different ways.’ We could sense that there were differences, and if the mood suited us, then we could have created some hypotheses.
We learned a great deal more by creating equations, models, relating the presence/absence of the elements to either the ratings, or the response time. Our learning was enhanced because the elements convey messages. We moved close in, to understand the ‘case’ from the inside out, from the facts, and from the mind of the judges.
We now move back, to look at general patterns, this time by plotting coefficients against each other. We are looking at the outside, after having dived into the minds of the respondents. In the world of science, ‘plotting the data’ is one of the exercises inculcated into young researchers. ‘Playing with data’ may like something which is frivolous, but nothing is further from the truth. It is playing with data, plotting it, average it, testing out ideas, looking for insights, for new patterns, for something to discover, those are the behaviors which teach one how to become a scientist, and how to think both creatively and analytically.
The first plot in our ‘deeper analysis’ looks at the coefficients for BH (instructed to be lenient) vs the coefficients for BS (instructed to be stringent). The plot comprises three scatterplots, shown in Figure 3, one for each key dependent variable (innocent, guilty, response time). The left panel plots the coefficients for innocent (Bot2), the middle panel plots the coefficients for guilty (Top2), and the right panel plots the coefficients for engagement (Response Time). Each filled circle corresponds to one of the 16 elements. It is the pattern which interests us here, not the specific elements.
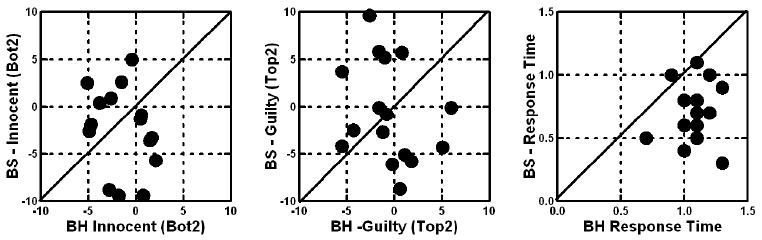
Figure 3: Scattergram showing the pattern of 16 coefficients for Innocent (Bot2), Guilty (Top2) and Engagements (Response Time). The abscissa shows the data from the School of Hillel (instructed to be lenient), the ordinate shows the data from the School of Shammai (instructed to be stringent).
The two groups differ in the pattern of their coefficients for all three measures, innocent, guilty and response time. That is, the instructions given to the respondents at the start of the experiment make a difference. The same element judged on the same scale (e.g., innocent) can generate two radically different coefficients, depending upon how the respondent is instructed. The impact of instruction is even more dramatic when we look at the response times. The response times show greater element-to-element variation when the respondent is instructed to judge stringently (BS), and lesser element-to-element variation when the response in instructed to judge leniently (BH).
The second plot in our deeper analysis looks at the three pairs of complementary mind-sets, for innocent, for guilty, and response times, respectively. The clustering had generated two groups of respondents for each dependent variable, respectively, based upon the pattern of the coefficients. Presumably, the patterns should be quite different.
Figure 4 shows the mind-sets to be most different for the mind-sets generated from response times. The mind-sets created for judgments of innocent and guilty differ but are correlated. For judgments in this topic, there are not groups of individuals who think about the same problem, but in different ways. It is a matter of degree, of focus on some elements but not others, when we deal with verdicts of innocent versus guilty (left and middle panels, respectively.) Once again, the discoveries here should excite the student to discuss the ‘what’ (what has been discovered), the ‘why’ (why would this be the case), and the ‘next’ (what would be a good legal case to discover more radically different mind-sets.)
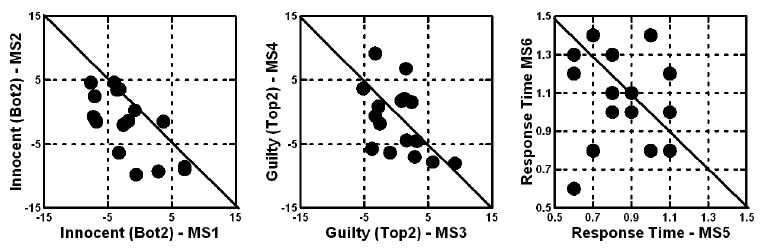
Figure 4: Scattergram showing the pattern of 16 coefficients for pairs of complementary mind-sets, based upon coefficients for judgments of innocent (Bot2), for judgments of guilty (Top3), and for measured engagement (response time), respectively.
Going Forward – What does this Mean for the Critical Thinking for Students
There are different ways to study critical topics, such as the law. The tools just presented show that one can take old texts, old problems, topics that often were studied without joy and enthusiasm, and transform them to topics relevant to today. The objective is not only to excite students who study the Talmud, generally limited to a small cadre of younger people of Jewish faith, but rather to use the topics on which they are trained, bringing those topics into the modern-day world as exemplars. In this 21st century of the common era, the notion of studying to develop creative and critical thinking requires moving beyond the simple, limited, strictures of remembering, reciting, and answering questions. The objective is to think, to explore, to create, and to add to the body of knowledge. All this from students age 10 and above! The approach of Mind Genomics may provide just so a new direction, consistent with ethical and religious values held by the student but brought to life by the spirit of the times, the Zeitgeist of this new day.
References
- Almog T, Almog O (2019) Academia: All the Lies.
- Dolgopolski S (2013) The Open past: Subjectivity and remembering in the talmud: fordham Univ Press.
- Guzmen-Carmeli S (2020) Texts as Places, Texts as mirrors: Anthropology of judaisms and jewish textuality. Contemporary Jewry 1-22.
- Alexander ES (2009) Why study talmud in the twenty‐first century?: The relevance of the ancient jewish text to our world 11-24.
- Block AA (2004) Talmud, curriculum, and the practical: Joseph schwab and the rabbis (Vol. 2). Peter Lang.
- Shulman LS (2008) Pedagogies of interpretation, argumentation, and formation: From understanding to identity in Jewish education. Journal of Jewish Education 74: 5-15.
- Hilty EB (2018) The professionally challenged teacher: Teachers talk about school failure. In Thinking about Schools. Routledge.
- McLaughlan R, Lodge JM (2019) Facilitating epistemic fluency through design thinking: A strategy for the broader application of studio pedagogy within higher education. Teaching in Higher Education, 24: 81-97.
- Pithers RT, Soden R (2000) Critical thinking in education: A review. Educational research, 42: 237-249.
- Ingall CK (2003) Cooperative or collaborative learning. The ultimate Jewish teacher’s handbook, pp: 351-362.
- Yadin A (2003) The hammer on the rock: polysemy and the school of Rabbi Ishmael. Jewish Studies Quarterly 10: 1-17.
- Lehman, Kanarek J (2011) Talmud: Making a case for Talmud pedagogy-the Talmud as an educational model. In International Handbook of Jewish Education (pp. 581-596). Springer, Dordrecht.
- Moskowitz HR, Gofman A (2007) Selling blue elephants: How to make great products that people want before they even know they want them. Pearson Education.
- Moskowitz HR (2012) ‘Mind genomics’: The experimental, inductive science of the ordinary, and its application to aspects of food and feeding. Physiology & behavior, 107: 606-613. [crossref]
- Moskowitz HR, Gofman A, Beckley J, Ashman H (2006) Founding a new science: Mind genomics. Journal of sensory studies, 21: 266-307.
- Dubes R, Jain AK (1980) Clustering methodologies in exploratory data analysis. In Advances in computers 19: 113-228. Elsevier.
- Gofman A, Moskowitz H (2010) Isomorphic permuted experimental designs and their application in conjoint analysis. Journal of Sensory Studies 25: 127-145.
- Kahneman D (2011) Thinking, fast and slow. Macmillan.