DOI: 10.31038/IDT.2020111
Abstract
This paper aims to help the authorities but especially the EU / EEA public health authorities in monitoring and managing the COVID-19 pandemic. The study provides concrete data on up-to-date and future developments in different countries and territories. The best results can be analyzed and pharmaceutical measures can be implemented in other countries. Thus, in order to have a clear picture of the danger of COVID-19, we studied a possible method of calculating the death rate among the positively confirmed cases. Thus, we have developed different equations, specific for each country, with which we can calculate the death rate. For example, for cases up to 19.03., For Italy, the death rate after 9 days was 25.58170% (9136 deaths / 28.03.) practically and theoretically 24.8% (8857 deaths); for cases up to the date of 4.04. the death rate at a minimum of 9 days was 16.6081% (19901 deaths / 13.04.) practically and theoretically 16% (19172 deaths); for the date of 19.04. the death rate will theoretically be 16.49187% and 23686 deaths, ie from 14.04. by including 19.04 there will probably be 3785 deaths. The method can be used for Italy, Spain and United States of America or other countries. The advantage of this method is that it is specific to each country. It helps us to have an overview and correlating with the number of tests and the age of the patients to choose the best treatments.
Keywords
Cases Italy, Spain, United Kingdom, United States of America deaths COVID.
Introduction
If we consider the total number of cases, 147577 and the number of deaths, 18851, from Italy until April 11, according to https://www.ecdc.europa.eu/en/cases-2019-ncov-eueea then we can say that the death rate increased from 9.50% to 12.77% compared to March 24. But considering that death usually occurs after 14 days, then we can say that this calculation is wrong [1-4].
Using the available preliminary data, the average time from onset to clinical recovery for mild cases is approximately 2 weeks and is 3-6 weeks for patients with severe or critical illness. Preliminary data suggest that patients develop severe disease symptoms, including hypoxia, at 1 week. Among patients who have died, the time from onset of symptoms to outcome varies from 2-8 weeks. [5, 6].
This paper aims to help the authorities but especially the EU / EEA public health authorities in monitoring and managing the COVID-19 pandemic. The study provides concrete data on up-to-date and future developments in different countries and territories. The best results can be analyzed and pharmaceutical measures can be implemented in other countries.
From the desire to be well informed and to have a clear picture of the danger of COVID-19, we studied a possible method of calculating the death rate among the positively confirmed cases. Studying the preliminary data available, there is an increase in deaths at nine or eleven days from increases in confirmations.
According to the model in [4, 5, 7] we have redone the graphs overlapping the deaths until 20.03.2020 with the cases until 11.03.2020 for Italy, Spain, United Kingdom and United States of America, different but representative countries and territories, cultures, approaches, behaviors , different equipment. The graphs overlap at 9 or 10 days. Thus, we have developed different equations, specific for each country, with which we can calculate the death rate. The method can be used for Italy, Spain and United States of America or other countries. The advantage of this method is that it is specific to each country. It helps us to have an overview and correlating with the number of tests and the age of the patients to choose the best treatments.
Results and discussions
In the case of Italy, we noticed, on April 11, changes in the data on the official website regarding the days of March 3, 4, 15, 16. The data used in this study are from the official website.
For Italy, there is an increase in deaths nine or eleven days after the confirmation increases. Because of this, we studied the 9-day death rate using the formula below.
Death rate at least 9 days = (total number of deaths day a + 9/ total number of cases day a) * 100.
There is a greater decrease in the death rate corresponding to 21.03 cases. the medical system was probably helped or was effective.
Graphically representing the death rate at a minimum of 9 days, we deduced the corresponding equation. With this equation we can calculate the death rate and the number of deaths 6 days in advance. If we adapt the method for a longer period of time, we will be able to calculate ahead with that interval.
Table 1. Death rate at least 9 days – Italy.
|
Criterion number |
Date of confirmed cases |
Date of deaths |
Death rate after 9 days%(y) |
|
1 |
11.03. |
20.03.2020 |
33.5698 |
|
2 |
13.03. |
22.03. |
31.9393 |
|
3 |
15.03. |
24.03. |
28.7233 |
|
4 |
17.03. |
26.03. |
26.8227 |
|
5 |
19.03. |
28.03. |
25.5817 |
|
6 |
21.03. |
30.03. |
22.9280 |
|
7 |
23.03. |
1.04. |
21.0186 |
|
8 |
25.03. |
3.04. |
20.1182 |
|
9 |
27.03. |
5.04. |
19.0739 |
|
10 |
29.03. |
7.04. |
17.8702 |
|
11 |
31.03. |
9.04. |
17.3669 |
|
12 |
2.04. |
11.04. |
17.0483 |
In the deduced equations x represents Criterion number and y represents the Death rate after 9 days.
Day 11.03 is the 20th day for Italy and for Spain day 13.03 is the 20th day, if we consider the number of consecutive days in which cases were registered.
The death rate after 9 days is higher initially in Spain but falls more than in Italy. The evolution for these countries is encouraging, the major problem being the number of cases.
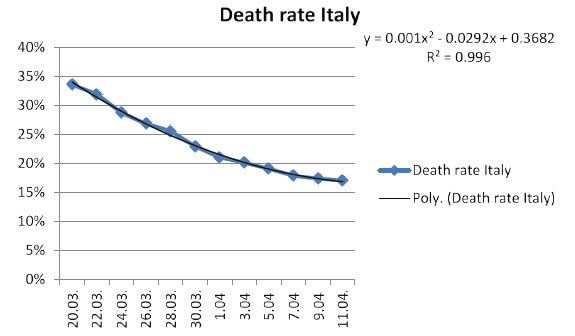
Figure 1. Cases and deaths on 11 / 20.03.2020 – Italy. The deaths on 20.03.2020 correspond to the cases from 11.03.2020. x: Criterion number; y: Rate of death %.
Table 2. Death rate at least 9 days – Spain.
|
Criterion number |
Date of confirmed cases |
Date of deaths |
Death rate after 9 days % |
|
1 |
11.03. |
20.03. |
46.7968 |
|
2 |
13.03. |
22.03. |
44.1558 |
|
3 |
15.03. |
24.03. |
37.9280 |
|
4 |
17.03. |
26.03. |
37.3626 |
|
5 |
19.03. |
28.03. |
35.4184 |
|
6 |
21.03. |
30.03. |
32.6726 |
|
7 |
23.03. |
1.04. |
28.6609 |
|
8 |
25.03. |
3.04. |
25.2136 |
|
9 |
27.03. |
5.04. |
20.9012 |
|
10 |
29.03. |
7.04. |
18.0699 |
|
11 |
31.03. |
9.04. |
17.0843 |
|
12 |
2.04. |
11.04. |
15.5116 |
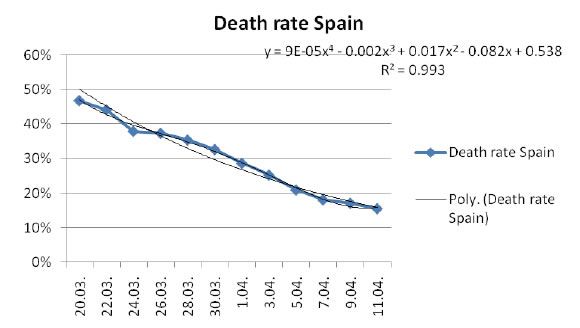
Figure 2. Cases and deaths on 11 / 20.03.2020 – Spain.. The deaths on 20.03.2020 correspond to the cases from 11.03.2020. x: Criterion number; y: Rate of death %.
Later I studied the situation in the United Kingdom. Initially, the social spacing measures were not applied here. Studying the appropriate United Kingdom charts, we observed correlations between the number of confirmed cases and deaths from 9 to 12 days later. We calculated the death rate 10 days after confirmation.
March 11 is the 19th day in which cases have been registered in the United Kingdom but the 13th in a row, so we can say that the United Kingdom is behind Italy with 6 days. Spain versus Italy with 3 days.Comparing the death rate corresponding to 11.03.For Spain with the day corresponding to 13.03.for the United Kingdom there is a big difference, the latter registering a much lower death rate initially but a later stay.
In this case it is difficult at the moment to elaborate the corresponding equation.
Studying the appropriate graphs United States of America we observed correlations between the number of confirmed cases and deaths from 9 to 12 days later. But more at 11 days. In order to make comparisons I calculated the death rate 10 days after confirmation.
In this case, the most favorable evolution is the United States of America.
If we consider air pollution, according to [8] then the most polluted is the United Kingdom followed by Italy and Spain which have similar and much lower values.
Table 3. Death rate after 9 and 10 days – United Kingdom.
|
Criterion number |
Date of confirmed cases |
Date of death |
Date of death |
Death rate after 9 days% |
Death rate after 10 days % |
|
1 |
11.03. |
20.03. |
21.03. |
38.6058 |
47.4530 |
|
2 |
13.03. |
22.03. |
23.03. |
39.4915 |
47.6271 |
|
3 |
15.03. |
24.03. |
25.03. |
29.3859 |
37.0175 |
|
4 |
17.03. |
26.03. |
27.03. |
30.0064 |
37.4594 |
|
5 |
19.03. |
28.03. |
29.03. |
28.8593 |
38.7452 |
|
6 |
21.03. |
30.03. |
31.03. |
30.8310 |
35.3502 |
|
7 |
23.03. |
1.04. |
2.04. |
31.4798 |
44.5539 |
|
8 |
25.03. |
3.04. |
4.04. |
36.1644 |
44.6329 |
|
9 |
27.03. |
5.04. |
6.04. |
36.9960 |
42.3228 |
|
10 |
29.03. |
7.04. |
8.04. |
31.4412 |
36.0407 |
|
11 |
31.03. |
9.04. |
10.04. |
32.0536 |
36.0326 |
|
12 |
2.04. |
11.04. |
12.04. |
30.3928 |
33.5041 |
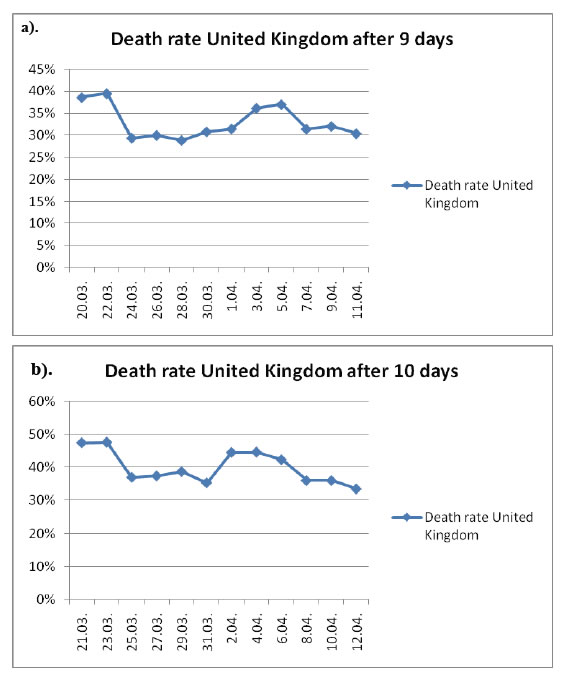
Figure 3. Cases and deaths on 11 / 20.03.2020 United_Kingdom.
a). The deaths from 20.03.2020 correspond to the cases from 11.03.2020.
b). The deaths from 21.03.2020 correspond to the cases from 11.03.2020.
Table 4. Death rate after 9 and 10 days – United States of America.
|
Criterion number |
Date of confirmed cases |
Date of death |
Date of death |
Death rate after 9 days % |
Death rate after 10 days % |
|
1 |
11.03. |
20.03. |
21.03. |
14.6341 |
25.3658 |
|
2 |
13.03. |
22.03. |
23.03. |
20.4449 |
28.3223 |
|
3 |
15.03. |
24.03. |
25.03. |
19.9932 |
27.1433 |
|
4 |
17.03. |
26.03. |
27.03. |
22.5273 |
27.8051 |
|
5 |
19.03. |
28.03. |
29.03. |
18.1306 |
23.2713 |
|
6 |
21.03. |
30.03. |
31.03. |
12.7853 |
16.1536 |
|
7 |
23.03. |
1.04. |
2.04. |
11.5860 |
14.5941 |
|
8 |
25.03. |
3.04. |
4.04. |
10.9594 |
12.9583 |
|
9 |
27.03. |
5.04. |
6.04. |
9.8859 |
11.2186 |
|
10 |
29.03. |
7.04. |
8.04. |
8.8148 |
10.3437 |
|
11 |
31.03. |
9.04. |
10.04. |
9.0007 |
10.1385 |
|
12 |
2.04. |
11.04. |
12.04. |
8.6641 |
9.5090 |
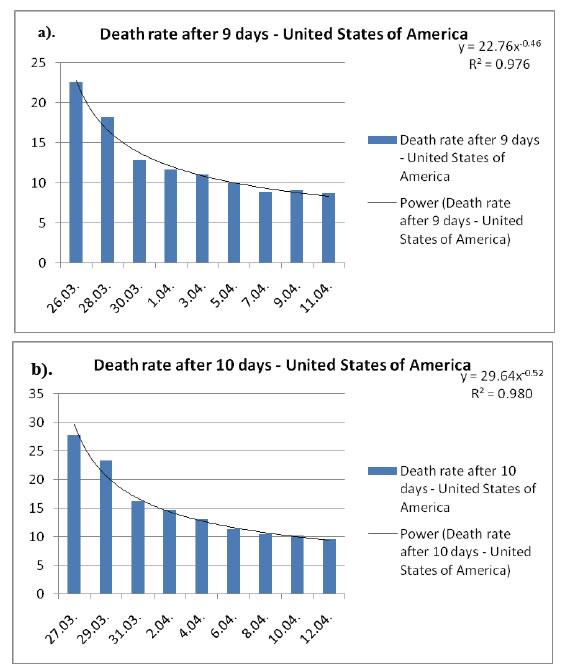
Figure 4. Cases and deaths on 11 / 20.03.2020 – United States of America.
a). The deaths from 20.03.2020 correspond to the cases from 11.03.2020.
b). The deaths from 21.03.2020 correspond to the cases from 11.03.2020.
Conclusion
We have proposed a possible method of calculating the death rate among the positively confirmed cases.
We have developed different equations, specific for each country, with which we can calculate the death rate. adapt the method for a longer time we will be able to calculate before that time. For example, for cases up to 19.03., for Italy, the death rate was 25.58170% (9136 deaths / 28.03.) practically and theoretically 24.8% (8857 deaths); for cases up to the date of 4.04. the death rate at a minimum after 9 days was 16.6081% (19901 deaths / 13.04.) practically and theoretically 16% (19172 deaths); for the date of 19.04. the death rate will theoretically be 16.49187% and 23686 deaths, ie from 14.04. by including 19.04 there will probably be 3785 deaths. With this equation we can calculate the death rate 3-4 days before and implicitly the number of deaths for the next 4 days. If we adapt the method for a longer period of time we will be able to calculate ahead with that time interval. The method can be used for Italy, Spain and United States of America or other countries.
The advantage of this method is that it is specific to each country. It does not require sophisticated calculations that involve advanced mathematics or special statistical programs. It helps us to have an overview and correlating with the number of tests, comorbidities and the age of the patients the authorities can choose the best treatments.If we consider the particular cases studied in this paper, we can say that: for Italy, there is a greater decrease in the death rate corresponding to the cases 21.03. the medical system was probably helped or was efficient. The death rate is initially higher in Spain, but is lower than in Italy. The evolution for these countries is encouraging, the major problem being the number of cases. Comparison of the corresponding death rate 11.03.for Spain with the corresponding day 13.03. for the United Kingdom there is a big difference, the latter registering a much lower death rate initially, but a later stay.
In this case, the most favorable evolution is in the United States of America.
References
- https://www.ecdc.europa.eu/en/cases-2019-ncov-eueea.
- Ezekiel JE, Govind Persad JD, Ross Upshur, Beatriz Thome, Michael Parker, et al. (2020) Fair Allocation of Scarce Medical Resources in the Time of Covid-19. The NEW ENGLAND Journal of Medicine. [Crossref]
- Pengfei Sun, Xiaosheng Lu, Chao Xu, Wenjuan Sun, Bo Pan (2020) Understanding of COVID‐19 based on current evidence. Journal of Medical Virology. [Crossref]
- Dumitraș CA (2020) Warning – Italy mortality of 32.35%. EdituraSfântulNicolae. http://librariascriitorilor.ro/Lectura/Atentie%20Italia%20mortalitate%20%2032,35_/index.html
- DumitraşHuţanu CA, Zaharia M, Pintilie O (2013) Quenching of Tryptophan Fluorescence in the Presence of 2, 4-DNP, 2,6-DNP, 2,4-DNA and DNOC and Their Mechanism of Toxicity. Molecules 18: 2266-2280. [Crossref]
- Report of the WHO-China Joint Mission on Coronavirus Disease 2019 (COVID-19).
- Dumitraş CA (2015) Poluanți majori ai mediului: dinitrofenoli și dinitrofenil eteri, sinteză, caracterizarechimică, activitate biologică, Ed MatrixRom, București.
- waqi.info/ro.