Abstract
Prisoners are often thought to harbor thoughts about suicide, with sensationalized stories about the despair in prisons touching the hearts of listeners and readers. We explore the degree to which ordinary people, non-prisoners, feel that there is despair versus hope among prisoners. Through experimentally designed vignettes, we describe who the prisoner IS, what the prisoner FACES, what the OTHER PRISONERS are like, and what preparatory efforts are in place regarding RELEASE. Each respondent read a unique set of 24 vignettes, comprising different elements, and for each vignette rated the degree to which the prisoner would be likely to think of committing suicide versus be hopeful. The analysis reveals the specific contribution of each element in the vignette as a driver of projected suicide versus hopes, and the numbers of tenths of second required to ‘process’ the element before making the decision. The study suggests two mind-sets, one focusing on the prisoner, the other focusing on the surrounding, each as a driver of despair, as represented by the phrase ‘contemplates suicide.’
Introduction
The increasing cost of imprisonment, the increasing number of those imprisoned, and the alternative ways of imprisoning people, have created an entire industry of concern about what to do with the prisoner, how to rehabilitate the prisoner, and how to avoid post-release recidivism, or despair-driven suicide. Certainly, the prisoner, upon release, can be considered as a person with one or many ‘black marks, ’ responses by others to his or his misdeeds and punishments. The prospect of a life after prison or a life in prison, one marked with rejection and condemnation by society often leads to severe psychological and social problems. One of these is the possibility of contemplating suicide and then successfully suiciding. The recent literature, both popular and academic, deals with the emotions involved in prison.
The experience of imprisonment is difficult, with detrimental effects on prisoners and their families [1]. The nature of life in prison is particularly noticeable among women whose socialization left them with a lack of voice in the public domain. Female prisoners often referred to their feeling of helpless during their prison experience [2]
Accounts of prison life for males consistently describe a culture of mutual mistrust, fear, aggression and barely submerged violence [3]. Often too, prisoners adapt to this environment by putting on emotional ‘masks’ of masculine bravado hiding their vulnerabilities and deterring the aggression of their peers. Johnson [4] claimed that prisoners’ self-presentations of cool, hard manliness’ often reflect a ‘chronically defensive’ attitude rooted in feelings of moral self-doubt, social rejection and psychic vulnerability. This is a posture against the hurt that imprisonment threatens to expose [5]. Prisoners have a psychological need to re-establish their sense of masculine self-esteem and the need to develop personas to save them from exploitation [3]. De Viggiani [7] emphasized the ‘survival’ functions of prisoners whereas Jewkes [8] emphasized their jostling for positions of power in their depriving environments.
Interviews with prisoners pointed to the protective functions of emotional self-control to hide fear or hurt which may be interpreted as signs of weakness exposing prisoners to ridicule and exploitation [3]. Prisoners expressed anger, fear, sadness and disgust through facial expressions [9] Emotional control is an internal defense as means of coping. Many prisoners stressed the need to control their emotions in order not avoid ‘cracking’ especially due to events outside the prison over which they had almost no control [3].
Occasional displays of emotion were deemed acceptable if they were the outcome of bereavements or if they related to children (e.g. serious illnesses, custody issues). Yet to unload one’s emotions on a continuing basis was reported to be unwelcome. In the visiting room, prisoners showed warmth and tenderness that were taboo on the landings, closed to visitors. Visits offered the only opportunity to display authentic feelings and to show warmth. Some were visibly upset as their visitors left, or sat in silent contemplation, their stolidity contrasting with the animated tone of a few minutes earlier.
Although there are many studies about the statistics of prisoners and imprisonment, along with interview accounts with prisoners, there is relatively little in the literature about metric studies on the ‘mind’ of the prisoner from the point of view of those who are not prisoners, i.e., studies of one’s empathic feeling toward prisoners. This study examines the perception of the public regarding emotions of prisoners and the extent of empathy understanding, with empathy being the ability to ‘sense the feeling of the other. This paper introduces a new approach to thinking about a topic, namely the study of empathy of normal people towards people who find themselves in a particularly stressful situation. The worlds of literature and song, stories, novels, poems, ballads, are is filled with descriptions of how one person feels about another or a group of others. Science is not, however, at least with descriptions having depth and tonality. This study begins that new course of research effort.
Method
Mind Genomics is an emerging science of the ‘everyday, ’ studying how people make decisions when confront by descriptions of ordinary experience, or at least experiences which could happen to people, experiences with which people are familiar [10, 11] Mind Genomics moves away from the traditional scientific approach of isolating one variable at a time and studying that variables. Rather, the premise of Mind Genomics is that we are continually confronted by compound situations, comprising many aspects. We, ordinary people, seem to have no trouble coping with these compound situations, making a series of decisions, and moving forward. Often, we are not able to articulate the reason WHY we do what we do. Yet, our behavior is rapid, automatic, appearing considered rather than random.
In its world-view and execution, Mind Genomics differs from most conventional research, which pay a great attention to the test stimuli, and may test a very few stimuli, but offer a variety of conclusions and implications from one study. With Mind Genomics, we look at simple, broad brush strokes of different aspects of prison, and do fast, simple research. Our metaphor is to cover ground, to explore, much like a cartographer explores and maps out an area, without paying very close attention to the minutiae of the area being mapped. The goal is to understand the key points of the topic, what ideas drive strong responses, what ideas drive strong engagements. The responses are measured using rating scales, converted later to a binary scale. The engagements are measured by response time, deconstructed into the number of tenths of second a statement ‘holds the respondent’s attention’ while being processed.
The test stimuli comprise four questions dealing with the person who is in prison, what the person does basis, the nature of other people in the prison, and the preparations, if any, for re-entry. The four questions are used as prompts to drive the researcher to provide four answers to each question. Table 1 show the four questions and the four answers to each question.
Table 1. The four questions, and the four answers to each question.
|
Question A: What kind of person is this? |
|
|
A1 |
Young inner-city black woman |
|
A2 |
White middle-age for theft |
|
A3 |
21-year-old second conviction for drugs |
|
A4 |
54-year old woman convicted for drugs |
|
Question B: What does the person do on a daily basis? |
|
|
B1 |
Boring stay, little to do |
|
B2 |
Machine shop license plates |
|
B3 |
4-hours of forced library |
|
B4 |
Rehabilitation and reeducation |
|
Question C: What other kind of people are in the prison? |
|
|
C1 |
Lower and upper middle class (in the prison) |
|
C2 |
Comradely (in the prison) |
|
C3 |
Drug addicts (in the prison) |
|
C4 |
Invisible status (in the prison) |
|
Question D: What kind of links are there for a future after prison? |
|
|
D1 |
Optional courses to prepare for jobs |
|
D2 |
Out you go |
|
D3 |
No support |
|
D4 |
Re-enter prison |
Test stimuli created by experimental design
The typical way to understand what people feel about a topic is to ask them questions about the topic, either in discussion (interviews), or through a survey on pencil and paper. An emerging way to understand people is the belief that observing their recorded behavior, e.g., what the person buys or does, gives a sense of who the person is, and what the person believes. This latter approach, is called ‘Big Data.’ The reality is that each of the approaches provides some information about the person, but does not provide the specific information for the topic. Our topic is the empathy of normal people towards their ideas of prisoners, and specifically prisoner despair. There is no way that Big Data can provide this information. Rarely can we find a survey which focuses on this topic because the topic is so specific, and so different from the more mainstream, conventional topics in the world of sociological or psychological research,
Mind Genomics approaches the issue of empathy about prisoner despair by running a simple experiment. The respondent or subject is provided with test combination of the 16 answers, and instructed to rate the combination, the vignette, on an anchored 9-point scale, with the scale focusing on an assessment of estimated feelings. Figure 1 shows the test stimulus.
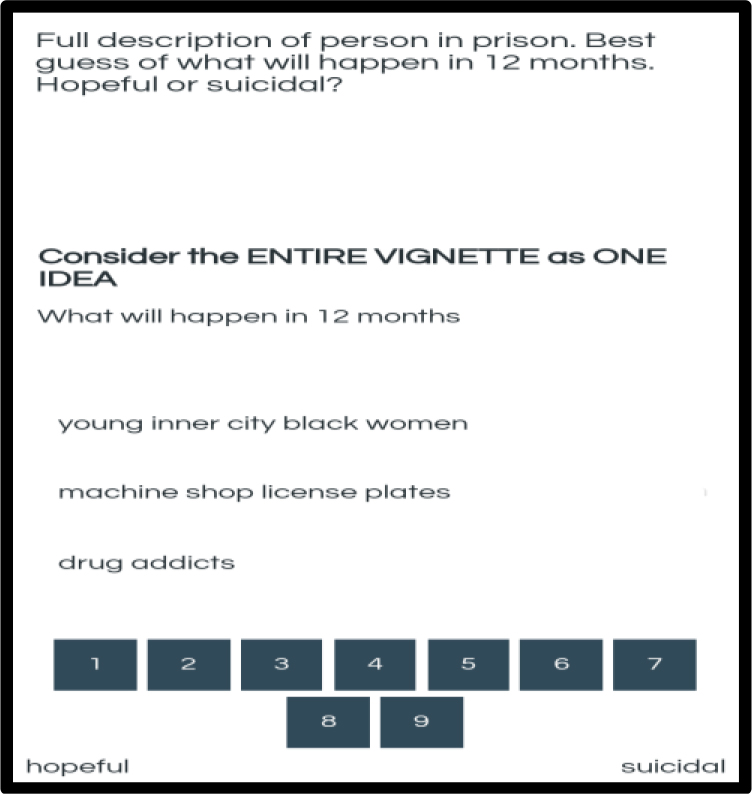
Figure 1. Example of a 3-element vignette about a prisoner, and the instruction to the respondent to rate.
The underlying experimental design comprises a ‘recipe’ or systematic layout of 24 combinations, vignettes, each vignette comprising 2–4 elements or answers, selected from Table 1. Each respondent evaluated 24 different vignettes, comprising 2–4 elements per vignette, at most one element or answer from one question. The experimental design presents the combinations without concern as to whether the combination ‘makes sense’ [12] The objective is to present the respondent with a set of test stimuli and force a judgment, that judgment being a rating of the entire vignette. The respondent cannot assign a ‘politically correct rating’ because there is no underlying pattern that the respondent can discern. The respondent may begin by trying to be politically correct and do the task ‘properly’ by paying attention, but soon gets frustrated, and reacts at an almost automatic, intuitive, ‘gut level.’ This is the desired state for the respondent. The intuitive response means that the response will be relatively uncontaminated by what the respondent feels to be that which the research ‘wants.’
The experiment with 42 respondents generated a data set, comprising 1208 vignettes. Most of the vignettes differed from one another. This structure of testing different combinations by each respondent is known as a permutable experimental design [13] The structure allows the researcher to ‘cover the space’ of possible test combinations, an approach analogous to the MRI (taking different pictures of the tissue), rather than the way typical scientific research works (repeating the pictures many times to reduce the error of measurement.)
Analysis
The ratings from the respondents were transformed to a binary scale, following the approach used by author HRM for 35 years, since the mid 1980’s, and based upon a combination of experience and common industry practice. Experience suggests that most users of scales do not know what the scales mean. Often the user of the data, the ultimate ‘client’ of the results, asks for an interpretation, such as ‘is a 6 a lot or a little better than a 5, or a little or a lot worse than a 7?’ These questions continue to reaffirm the fact that the user of the data does not really understand what to do with the data, other than to make conclusions about ‘better or worse.’ A more productive approach, used for decades by market researchers bifurcates the scale, so that there is a top of the scale (e.g., 7–9), and a bottom of the scale (e.g., 1–6). In our case, we would interpret the top of the scale, the ratings of 7–9, as indicating that the prisoner is believed to be thinking of suicide. A rating of 1–6 indicates that the prison is not likely to commit suicide, or to think about committing suicide. We can also look at the scale from the opposite end, hopefulness with a rating of 1–3 indicating that the prisoner is believed to be hopeful,
The underlying experimental design enables us to combine the data from our 42 respondents into a database comprising the 1008 observation. Each observation comes from one respondent, one vignette. The experimental design ensures that the 16 predictor variables, the elements, are statistically independent of each other. The dependent is augmented by the addition of a very small random number, approximately 10–5
Table 2 shows the results from the first OLS (ordinary least-squares) regression, focusing on the data from the transformation to the binary scale (1–6 = not thinking about suicide; 7–9 = thinking about suicide.) The regression procedure, colloquially known as curve fitting, deconstructs the 0/100 binary rating into the basic contribution of the 16 elements, the 16 coefficients, and an estimated basic level, the additive constant.
Table 2. Coefficients for ‘thinking about suicide’ (ratings 7–9 converted to binary). Data from the total panel.
|
Thinking about suicide (Scale points 7–9) |
Coefficient |
T Statistic |
P Value |
|
|
Additive constant |
24.46 |
3.48 |
0.00 |
|
|
D3 |
No support |
11.16 |
2.62 |
0.01 |
|
C3 |
Drug addicts |
10.98 |
2.54 |
0.01 |
|
A3 |
21-year-old second conviction for drugs |
7.08 |
1.65 |
0.10 |
|
B1 |
Boring stay, little to do |
4.10 |
0.94 |
0.35 |
|
D2 |
Out you go |
1.10 |
0.26 |
0.80 |
|
A2 |
White middle age for theft |
-0.02 |
-0.01 |
1.00 |
|
A4 |
54-year-old woman convicted for drugs |
-0.68 |
-0.16 |
0.88 |
|
C4 |
Invisible status (in the prison) |
-1.17 |
-0.27 |
0.79 |
|
B4 |
Rehabilitation and reeducation |
-2.34 |
-0.54 |
0.59 |
|
C2 |
Camaraderie (in the prison) |
-3.40 |
-0.80 |
0.43 |
|
B3 |
4-hours of forced library |
-3.81 |
-0.88 |
0.38 |
|
C1 |
Lower and upper middle class (in the prison) |
-4.13 |
-0.96 |
0.34 |
|
D4 |
Re-enter prison |
-4.22 |
-0.99 |
0.32 |
|
B2 |
Machine shop license plates |
-5.25 |
-1.23 |
0.22 |
|
D1 |
Optional courses to prepare for jobs |
-8.31 |
-1.94 |
0.05 |
|
A1 |
Young inner-city black woman |
-8.52 |
-1.98 |
0.05 |
The interpretation of the results is straightforward:
- The additive constant is the estimated probability of a respondent saying that the person described in the vignette will attempt suicide (rating 7–9 on the scale.) The additive constant is 24.46, which we interpret to mean that in the absence of elements, the expected proportion of responses 7–9 (thinking of suicide) is 24.46, about 25%.
- Table 2 shows the 16 elements sorted from highest (believed most likely to think of suicide), to lowest (believed least likely think of suicide.)
- The coefficients have ratio-scale values, so that a value of 10 means believed twice as likely to thinking of suicide than a value of 5.
- The coefficients can be added to the additive constant to create a sum which provides the estimated probability of a prisoner thinking about suicide. Thus, one needs only the additive constant, and the elements, as well as their coefficients, to estimate the likelihood that one believes that thoughts of suicide will plague prisoner described by the vignette.
- The coefficients in Table 2 suggest that the two elements co-varying most strongly with likelihood of suicide are C3 (drug addicts, as fellow prisoners), and D3 (the recognition of no support.) These two elements talk about two aspects, one who the fellow prisoners happen to be, and second the emotional support in the prison.
- The coefficients suggest that two descriptions are least likely to covary with the thought of suicide. One is the young inner-city black woman, the other is optional courses to prepare for jobs. These are radically different. The first suggests the appreciation who the prisoner happens to be. The second is the fact that someone is taking care of the prisoner, or at least thinking of the prison to prepare for a job.
- The T statistics tells us the ratio of the coefficient to the standard error of the coefficient. The higher the T statistic, the more likely it is that the coefficient or the additive constant comes from a distribution whose true value is not 0. The P value, in turn, is the probability that the T statistic comes from a distribution whose true value is 0.
Reversing the perspective – what drives the rating of ‘hopeful’ (1–3 on the 9-point scale)
Our respondents could assign rights on either side of the scale, 1 representing hopeful, 9 representing contemplating suicide at some point. What happens when we focus on the positive aspects, looking at the elements driving the ratings of 1–3. We now convert the ratings on the low end of the scale, 1–3, corresponding to hopeful, so that they become. In turn, the value 100. The remaining six scale points, 4–9, become 0, to denote not hopeful. We perform the same analysis on the data from the total panel, looking at the additive constant, and the coefficient for each element.
- The additive constant is 43.79, almost 44, meaning that in the absence of elements, almost half of the responses will be between 1 and 3, hopeful. We interpret this to mean that it is basic information (a person is in prison) which conveys some hope. Being in prison does not automatically drive one’s feeling that the imprisoned person will contemplate suicide. Being is prison does, however, drive a sense that the prisoner will be modestly hopeful.
- Estimated hopefulness is driven by reading about preparations for release, such as ‘optional courses to prepare for job’, and ‘4-hours of forced library.’.
- Lack of hopefulness is driven by who a person is, and the situation in the prison. These are the elements with the lowest coefficients for hopefulness.
21-year-old second conviction for drugs
54-year-old woman convicted for drugs
drug addicts (in prison)
white middle age for theft
no support
Individuals – are they optimistic or pessimistic, based upon their coefficients
Can we classify an individual as optimistic (perceiving the situations in the vignette as ‘hopeful’) or pessimistic (contemplating suicide), both or neither? One way to answer this question computes the average coefficient across 16 elements for each individual, when we look at the equation for ratings of 7–9. Recall that the coefficient shows the believed likelihood that the prisoner being described is likely to commit suicide. Each respondent generates 16 coefficients. The average coefficient for a respondent tells us the proclivity of the respondent to see the described prisoner’s feelings as leading to thoughts of suicide. The second part of the answer is to compute the average for the same respondents for the 16 coefficients dealing with hopeful. The average coefficient for a respondent tells us the proclivity of the respondent to see the described prisoner vignette as leading to hopefulness.
We begin with the scattergram for the total panel, in Figure 2. Each filled point represents one respondent. The abscissa corresponds to the average of the respondent’s 16 coefficients on the top part of the scale, tendency to suicide, i.e., the coefficients of the individual-level regression model run for the respondents when the ratings of 1–6 were converted to 0, and the ratings of 7–9 were converted to 100. The ordinate corresponds to the average of the respondent’s 16 coefficients on the bottom of the scale, hopeful, when the ratings of 1–3 were converted to 100, and the ratings of 4–9 were converted to 0.
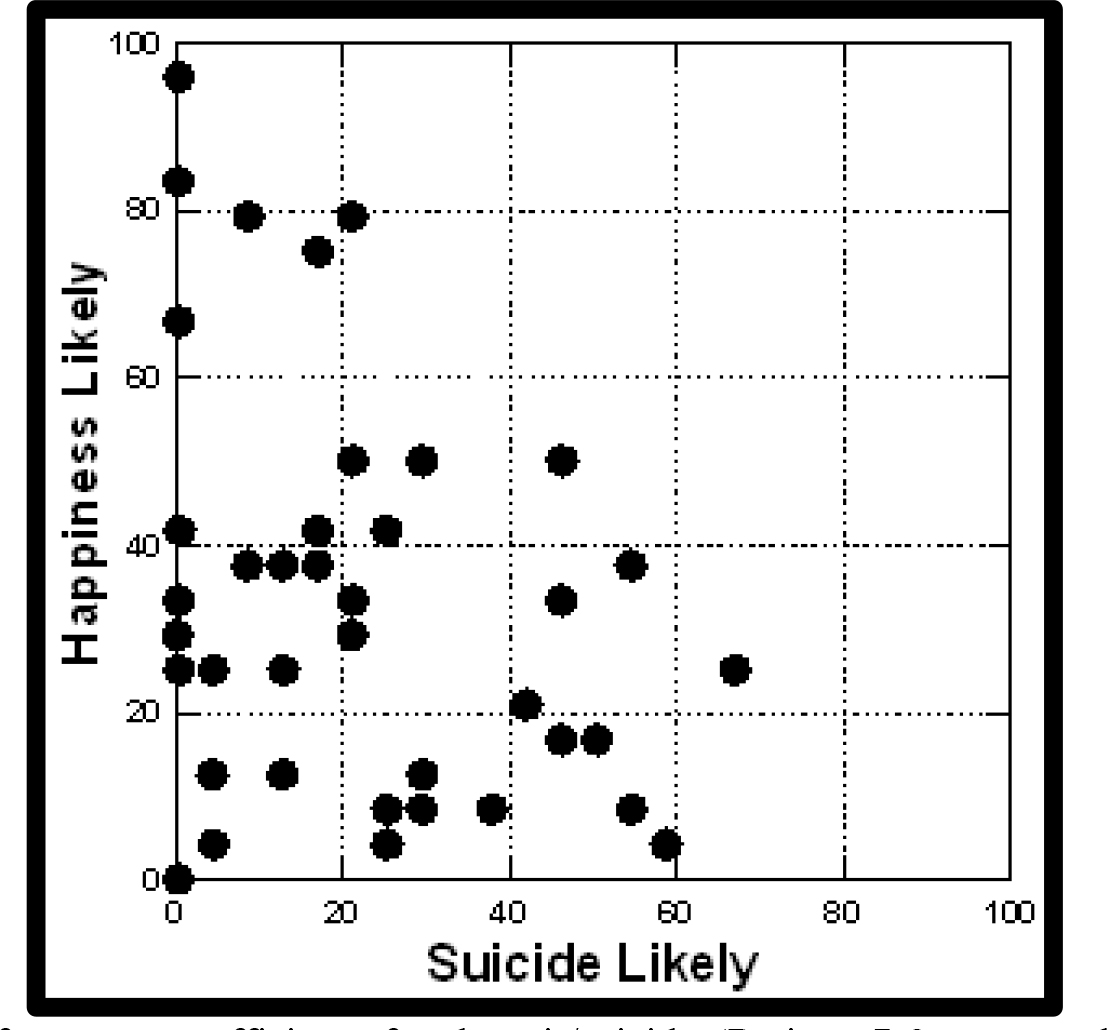
Figure 2. Distribution of average coefficients for despair/suicide (Ratings 7–9 converted to binary) and average coefficients for happiness/hopefulness (Ratings 1–3 converted to binary). Each filled circle corresponds to a respondent.
When the respondent cluster at 0, 0, we conclude that the respondent does not sense either prisoner despair or prisoner hopefulness in the vignettes. The averages for the latter two scales are both near 0, and thus the respondent falls at the bottom left. The further out to the right on the abscissa lies the respondent’s average, the more the respondent feels that the prisoner will contemplate suicide. The further up the ordinate lies respondent’s average more the respondent feels that the prisoner will feel hopeful. Figure 2 suggests more respondents feel that the prisoner will be hopeful, and fewer respondents will feel that the prisoner will contemplate suicide. Looking more closely at the distribution, we see about five respondents who feel primarily despair in the vignettes, and about five respondents who feel primarily hopefulness in the vignettes.
As a side note, this format of presenting data suggests a new way to understand the basic mind-set of a person on two opposing dimensions of a feeling. The location of the points gives a sense of how different people think and empathize. Most of the respondents in the large area between 0, 0 and 0.3, 0.3. The location 0, 0 corresponds to a person who is neither pessimistic nor optimistic in the estimation of how the prisoner would feel. The location 0.5, 0.5 corresponds to the location where the person is absolutely decisive, rating the vignettes as either hopeful or despairing (contemplate suicide.) For the person located at 0.5, 0.5, there is no middle ground. For the person located at 0, 0 there is virtually only middle ground.
Subgroups – Gender, Age, Mind-Set – What is expected to drive the prisoner’s though to suicide?
One of the key benefits of the Mind Genomics approach is the use of different combinations of vignettes for each respondent, but at the same time ensure that each respondent evaluates the appropriate set of vignettes in order to create an experimental design. One can do the analysis on key subgroups, both self-defined (gender, age), and defined through analysis (mind-set.) The small group of 42 respondents provides sufficient depth into the mind of the respondent to reveal the responses of subgroups, perhaps a bit noisily, but nonetheless powerfully.
Table 4 shows the set of key subgroups. For this study we divided the respondents by gender and by age, respectively, and then created mind-set segments as described in the following section.
Table 3. Coefficients for ‘hopeful’ (ratings 1–3 converted to binary). Data from the total panel.
|
Coeff |
T Statistic |
P Value |
||
|
Additive constant |
43.79 |
5.55 |
0.00 |
|
|
D1 |
Optional courses to prepare for job |
13.24 |
2.76 |
0.01 |
|
B3 |
4-hours of forced library |
8.52 |
1.76 |
0.08 |
|
C1 |
Lower and upper middle class (in the prison) |
6.38 |
1.32 |
0.19 |
|
B4 |
Rehabilitation and reeducation |
5.04 |
1.04 |
0.30 |
|
B1 |
Boring stay, little to do |
1.38 |
0.28 |
0.78 |
|
B2 |
Machine shop license plates |
1.15 |
0.24 |
0.81 |
|
A1 |
Young inner-city black woman |
-1.44 |
-0.30 |
0.77 |
|
D2 |
Out you go |
-2.10 |
-0.44 |
0.66 |
|
C4 |
Invisible status (in the prison) |
-4.53 |
-0.94 |
0.35 |
|
C2 |
Camaraderie (in the prison) |
-5.45 |
-1.14 |
0.26 |
|
D4 |
Re-enter prison |
-8.72 |
-1.82 |
0.07 |
|
A3 |
21-year-old of second conviction for drugs |
-11.23 |
-2.33 |
0.02 |
|
A4 |
54-year-old woman convicted for drugs |
-11.86 |
-2.46 |
0.01 |
|
C3 |
Drug addicts |
-11.89 |
-2.45 |
0.01 |
|
A2 |
White middle age for theft |
-12.48 |
-2.59 |
0.01 |
|
D3 |
No support |
-16.69 |
-3.49 |
0.00 |
Table 4. Strongest performing elements by key subgroup of the models relating the presence/absence of elements to the estimate of the prisoner’s contemplation of suicide.
|
Contemplate Suicide (Top 3 scale points, 7–9) |
Total |
Males |
Females |
Age <30 |
Age 31+ |
Mind-Set 1 |
Mind-Set 2 |
|
|
Base size |
42 |
19 |
23 |
14 |
26 |
19 |
23 |
|
|
Additive constant |
24 |
25 |
22 |
22 |
27 |
26 |
24 |
|
|
D3 |
No support |
11 |
5 |
18 |
10 |
12 |
32 |
-6 |
|
C3 |
Drug addicts |
11 |
11 |
12 |
16 |
10 |
5 |
13 |
|
A3 |
21-year-old of second conviction for drugs |
7 |
3 |
11 |
7 |
8 |
5 |
9 |
|
B1 |
Boring stay, little to do |
4 |
14 |
-4 |
5 |
4 |
-5 |
12 |
|
D2 |
Out you go |
1 |
5 |
0 |
-2 |
2 |
20 |
-15 |
- Additive constant – all subgroups are approximately the same, showing an additive constant of 22 – 27.
- Males feel that simply ‘being bored, having nothing to do’ is a cause for contemplating suicide. Females do not.
- There is no difference in projected potential of contemplating suicide by younger versus older respondent.
- We created two mind-sets by clustering the array of 16 coefficients, and extracting two different groups, which are maximally different from each other (De Hoon et. al., 2004.) Clustering is a purely statistical technique. We extract the fewest number of clusters (parsimony) which tell coherent stories (interpretability.)
- Mind-Set 1 feels that the prisoner will think of suicide if there is no emotional support in the prison, and if the prisoner is simply discharged, released, without any preparation. To Mind-Set 1, it is the sense of aloneness in the prisoner which is distressing. Mind-Set 1 can be called ‘want preparation.’
- Mind-Set 2 feels that the prisoner will contemplate suicide if there is a sense of nothing to do, and if the prisoner is either a serious drug addict (second conviction) or surround by drug addicts. Mind-Set 2 can be called sensitive to surroundings.
Subgroups – Gender, Age, Mind-Set – What is expected to drive the prisoner’s thoughts to happy
We can follow the same logic, this time looking at gender, age, and newly constructed mind-sets for the low part of the scale, ‘hopeful.’
- Males show a much higher imputed basic hopefulness for prisoners than do females (54 versus 36.) Without any additional information, males believe that that the prisoner will be neither hopeful or not hopeful (additive constant 54), whereas females believe that it’s more likely that the prisoner will not be hopeful (additive constant 36).
- For males, hopeful is perceived as a matter of preparing for a job and being surrounded by prisoners who are middle class.
- For females, hopefulness is perceived when the message is about preparing for a job, library, rehabilitation, and surprisingly, with the prisoner has little to do. Males, in contrast feel when the prisoner in bored, and has little to do, the despair is higher, with a greater thought of suicide.
- Younger respondents (under 30) feel that hopefulness will come from job preparation and from the hours in the library.
- Older people feel the same way, and also feel that hopefulness will come from being surrounded by middle class prisoners.
- The previously created Mind Set 1 feels that hopefulness is a matter of the requirement of four forced hours in library, as well as being surround by middle-class prisoners.
- The previously created Mind-Set 2 feels that hopefulness will come with the preparatory course for jobs, and the requirement of library.
Subgroups – are they optimistic or pessimistic, based upon their coefficients
The previous analysis for the total panel presented a novel way to gauge whether the respondents are optimistic or pessimistic, by plotting the average coefficient from the two models, doing so for each respondent. The coefficient shows the average conditional probability that the respondent would assign the element a rating of 7–9 (top 3, contemplating suicide), versus that the same respondent would assign the element of 1–3 (bottom 3, happy). The two averages come from the coefficients of 16 elements.
When we plot each respondent on a two-dimensional graph, we can sense the respondent’s mind. To review:
- Each filled circle corresponds to one respondent
- The location 0, 0 corresponds to a person who is ‘all middle ground, ’ sensing neither despair leading to contemplation of suicide, nor sensing hopefulness. All the ratings for the vignettes lie between 4 and 6.
- The location 0.5, 0.5 corresponds to a person for whom there is ‘no middle ground’ but not basically optimistic nor basically pessimistic in the estimation of how a prisoner would feel.
- Plots to the right on the abscissa suggest a person who is more pessimistic, and sees despair leading to the contemplation of suicide.
- Plots upwards on the ordinate suggest a person who is more optimistic, and sees ‘hopefulness’
Figure 3 shows the plots for key subgroups. Each panel (top,
middle, bottom) compares two complementary subgroups. The
statements below are purely from visual observation and impression,
not from a statistical analysis.
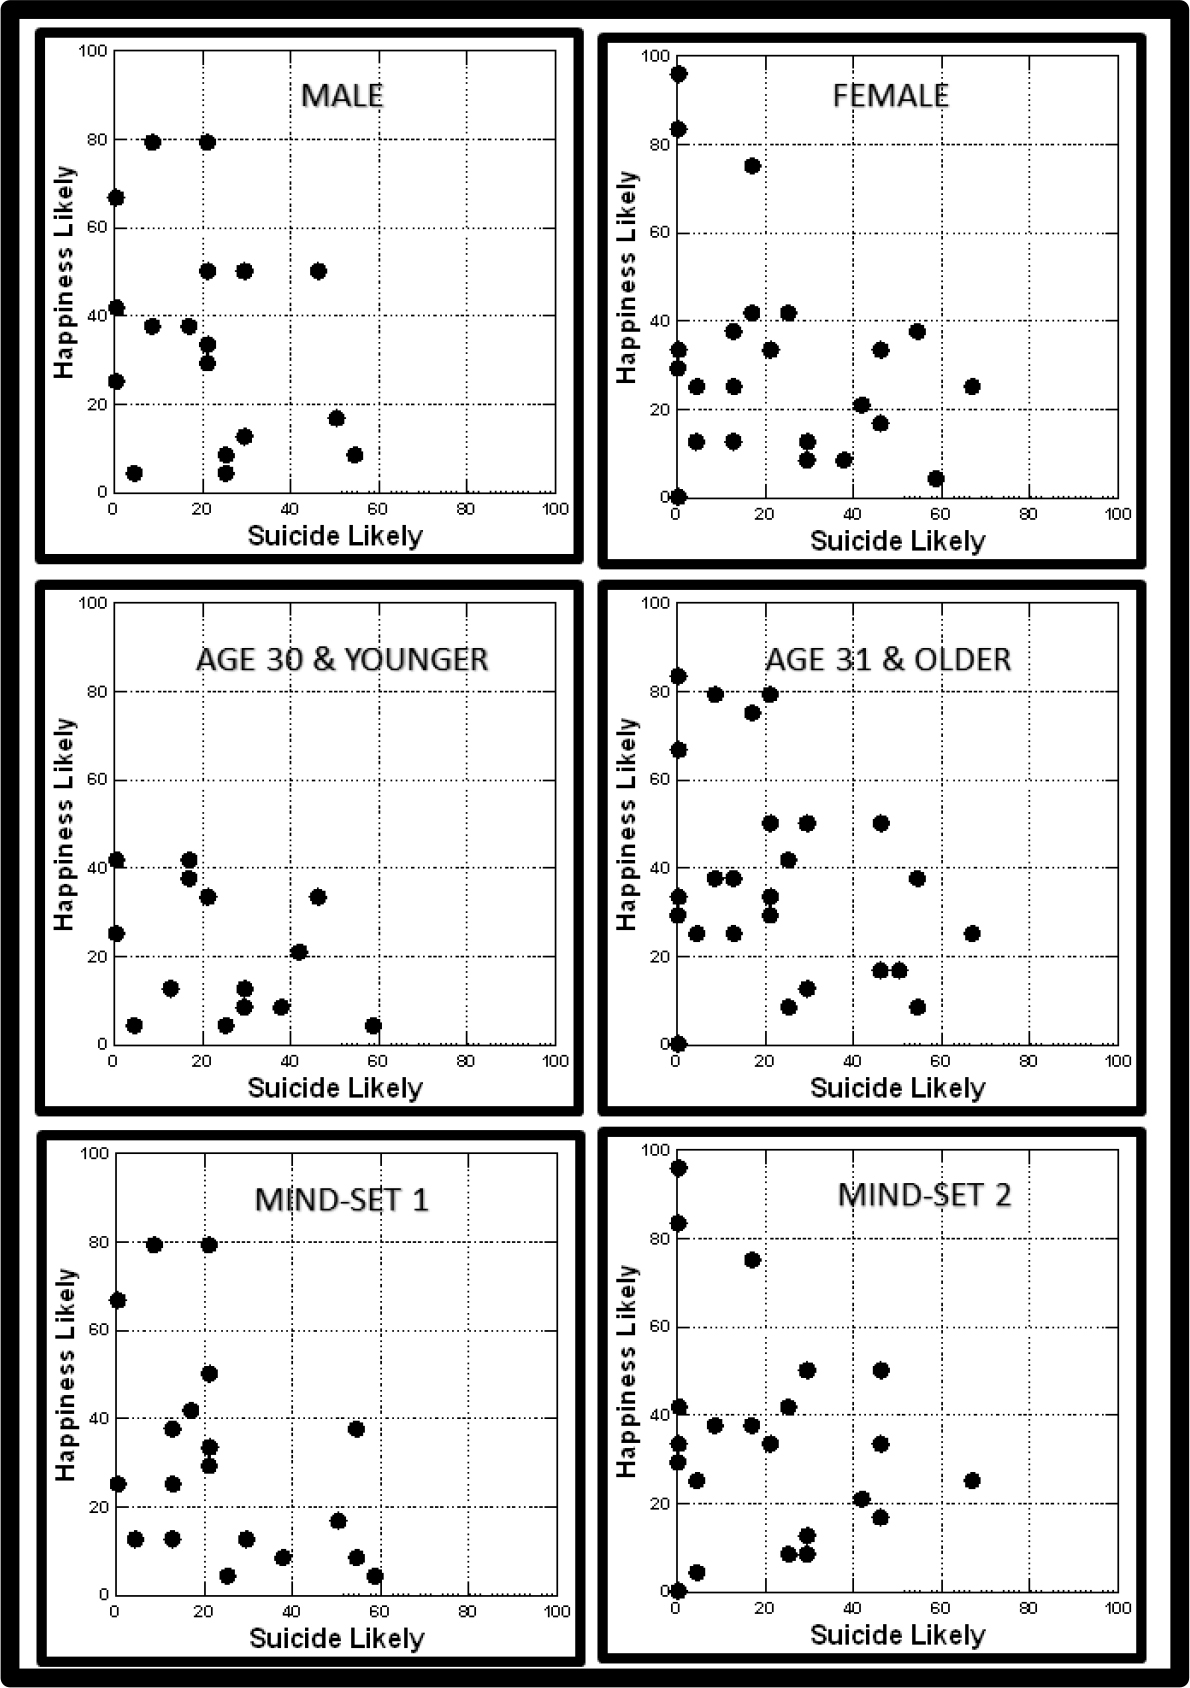
Figure 3. Distribution of average coefficients for despair/suicide (Ratings 7–9 converted to binary) and average coefficients for happiness/hopefulness (Ratings 1–3 converted to binary). Each filled circle corresponds to a respondent. The three panels show the results for complementary subgroups.
- Females show more respondents closer to the 45-degree line, and further out than men on that line. Qualitatively, females seem to be more judgmental than men, but neither overly optimistic nor pessimistic.
- Younger respondents aged 30 and younger show more respondents lying close to the non-judgmental region of 0, 0. Older respondents age 31 and older show more respondents as lying further out towards 0.5, 0.5, with a tendency to be more optimistic, and feeling that the prisoner is more hopeful.
- Mind-Set 1 (want preparation) appears to be less judgmental, and if judgmental then optimistic in terms of rating what the prisoner would feel. Mind-Set 2 (sensitive to surroundings) is more judgmental, with fewer ratings in the 4–6 region of the scale. Mind-Set 2 appears to be slightly more pessimistic.
Response Time
The previous sections dealt with the analysis of the ratings, specifically what elements are perceived, in one’s opinion to correlate with thinking that would contemplate suicide, at least in the opinion of a non-prisoner respondent reading a vignette about the prisoner. The analysis deals with the conscious assignment of ratings to the test stimuli, even if the decisions tend to be automatic.
Researchers have been interested in the past few years in possibly deeper mechanisms of decision-making, many of which they put in the grab-bag called neuromarketing, or more correctly non-conscious, physiological correlates of decision-making. Fugate [15], Lee et. al. [16] and Stipp [17] summarize this new area of neuromarketing, or really physiological correlates of messaging. Genco et. al. [18] have popularized in a book ‘Neuromarketing for Dummies.’ We now proceed to the analysis of one of one of these measures, response time. The ingoing assumption is that longer response times signal that the respondent is somehow ‘engaged’ in reading and thinking about the particular element in the vignette.
Some of the vignettes constructed were responded to slowly, others were responded to quickly. After removing the first vignette evaluated by each respondent because the respondent was just ‘learning what to do in the experiment, ’ and after removing all vignettes responded to after 9 seconds because it was likely the respondent was doing something else, we emerge with a distribution of response times as shown in Figure 4. The time scale, abscissa, is logarithmically spaced, emphasizing the many vignettes responded to faster than 2 seconds. The computer program picked up the response times in tenths of seconds.
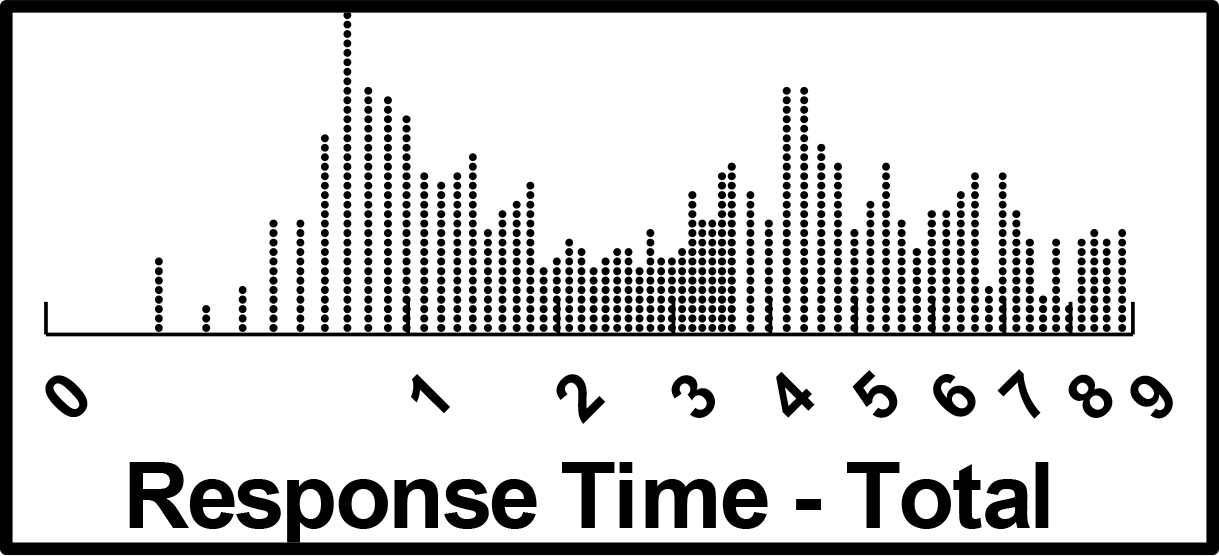
Figure 4. Distribution of the response times for the vignettes, after removal of the first vignette and after removal of all response times of 9 seconds or longer.
As stated above, we assume response time to be a correlate of engagement. We operationally define the term as ‘time spent attributed to the element when the vignette is being evaluated.’ We cannot, of course, ask the respondent to tell us how engaging each element seems to be, although occasionally the novice researcher might ask that question. The reading and response occur so rapidly, so automatically, that the respondents are not aware of what holds their attention unless there is something so powerfully strong that it ‘stops’ the respondent.
The experimental design enables us to estimate the likely number of seconds in the response time that can be attributed to each element. It is important to note that this assignment is an estimate, only, based upon the application of OLS regression to the response times. Some interesting patterns emerge from Table 5.
The elements are presented in descending order of response time based upon the results from the total panel. These ratings are from 40 respondents, each evaluating at most 23 vignettes, but a number of vignettes have been removed because they were recorded as being unusually long.
We have highlighted and bolded those response times of 1.4 seconds or longer, which can be assumed to be ‘engaging.’ The choice of 1.4 seconds is simply to represent a time that can be thought of as possibly conscious attention.
The longest response time for any group is 1.7 seconds (female respondents with the element ‘lower and upper middle class’).
The shortest response time for any group is virtually 0 time, ‘optional courses to prepare for jobs’ (0.2 seconds, for Mind-Set 2, who are sensitive to their surroundings, and would be expected not to care about courses for the future.)
Total panel: The longest response times, i.e., the most engaging, are descriptions of the person, requiring multiple words. The shortest times, i.e., the least engaging, are descriptions of occupation training in prison. It’s all about the people, who they are.
Assigning new individuals to one of the two mind-sets
Conventional research is grounded on the belief that there is an indivisible link between who the person IS and what the person THINKS. This belief motivates the use of large, representative samples of respondents, believing that it is important to measure the correct group of people in order to understand the way the mind works. Thus, good practice in business and political polling is often accompanied by large base sizes and a measure of ‘error, ’ or underlying variability.
Table 5. Strongest performing elements by key subgroup of the models relating the presence/absence of elements to the estimate of the prisoner’s hopefulness.
|
Total |
Male |
Female |
LT30 |
GT31 |
Mind-Set 1 |
Mind-Set 2 |
||
|
Base size |
42 |
19 |
23 |
14 |
26 |
19 |
23 |
|
|
Additive constant |
44 |
54 |
36 |
35 |
48 |
46 |
42 |
|
|
D1 |
Optional courses to prepare for jobs |
13 |
8 |
17 |
14 |
13 |
7 |
18 |
|
B3 |
4-hours of forced library |
9 |
6 |
11 |
9 |
8 |
9 |
8 |
|
C1 |
Lower and upper middle class |
6 |
8 |
5 |
6 |
8 |
8 |
5 |
|
B4 |
Rehabilitation and reeducation |
5 |
-1 |
10 |
-1 |
7 |
4 |
6 |
|
B1 |
Boring stay, little to do |
1 |
-12 |
11 |
3 |
-1 |
5 |
-1 |
Table 6. Coefficients for response times, by total panel and key subgroups. Coefficients of 1.4 or higher are shown in shaded cells, with bold numbers.
|
Total |
Male |
Female |
Age 30 or less |
Age 31+ |
Mind-Set 1 (want preparation) |
Mind Set 2 (sensitive to surroundings) |
||
|
C1 |
Lower and upper middle class (in the prison) |
1.4 |
1.2 |
1.7 |
1.2 |
1.4 |
1.2 |
1.5 |
|
A1 |
Young inner-city black woman |
1.4 |
1.4 |
1.3 |
1.2 |
1.6 |
1.6 |
1.3 |
|
A3 |
21-year-old-old, second conviction for drugs |
1.4 |
1.6 |
1.1 |
1.0 |
1.6 |
1.6 |
1.3 |
|
A4 |
54-year-old woman convicted for drugs |
1.4 |
1.5 |
1.1 |
1.0 |
1.5 |
1.3 |
1.5 |
|
C4 |
Invisible status (in the prison) |
1.3 |
1.6 |
1.2 |
1.4 |
1.4 |
1.5 |
1.1 |
|
C3 |
Drug addicts (in the prison) |
1.3 |
1.3 |
1.4 |
1.2 |
1.5 |
1.7 |
0.9 |
|
A2 |
White middle age for theft |
1.2 |
1.8 |
0.7 |
0.4 |
1.7 |
1.4 |
1.2 |
|
B1 |
Boring stay, little to do |
1.0 |
0.8 |
1.2 |
0.6 |
1.2 |
1.1 |
1.0 |
|
B2 |
Machine shop license plates |
1.0 |
1.3 |
0.8 |
0.6 |
1.3 |
0.9 |
1.1 |
|
D4 |
Re-enter |
1.0 |
0.5 |
1.4 |
0.6 |
1.2 |
1.1 |
0.7 |
|
C2 |
Camaraderie (in the prison) |
0.9 |
1.0 |
0.9 |
0.4 |
1.3 |
0.7 |
1.2 |
|
B3 |
4-hours of forced library |
0.8 |
0.6 |
1.1 |
0.8 |
0.8 |
0.8 |
0.9 |
|
B4 |
Rehabilitation and reeducation |
0.7 |
0.4 |
1.0 |
0.3 |
1.0 |
0.7 |
0.8 |
|
D1 |
Optional courses to prepare for jobs |
0.6 |
0.3 |
0.8 |
0.7 |
0.6 |
1.0 |
0.2 |
|
D3 |
No support |
0.5 |
0.1 |
0.7 |
0.4 |
0.7 |
0.7 |
0.3 |
|
D2 |
Out you go |
0.3 |
0.0 |
0.5 |
0.5 |
0.2 |
0.6 |
-0.1 |
One of the premises of Mind Genomics is that in virtually any topic area where human judgment comes into play one can discover different points of view, different criteria for judgment. These are called Mind-Sets. Their reality emerges from the analysis of how individuals respond to the different elements or ‘answers’ in the particular study. That is, these mind-sets exist, but are really groups of individuals who behave similarly in a specific situation, as revealed by their patterns of responses, or perhaps as the next paragraph suggests, mind-sets are really combinations of ideas.
Underlying the research in Mind Genomics is the belief that some ideas ‘flow together.’ It is the combination of such ideas which flow together that comprises the focus of interest of Mind Genomics. Individuals, the respondents who participate, are ‘protoplasm’ which in some way embody these basic mind-sets, but the individuals are NOT the mind-sets. The mind-sets are primaries, like the colors red, yellow and blue. Each person comprises a set of mind-sets, with the methods of Mind Genomics both identifying the nature of the mind-sets from clustering, and establishing who in a study embodies each mind-set. Whether these mind-sets represent true primaries like color primaries, red, blue and yellow, is not important. What is important is that they show remarkably different, and interpretable patterns of responses, patterns which make sense, can be interpreted and labelled. These primaries may co-vary with external behaviors, and perhaps even with physiological patterns of responses. What is important is that they represent a new way of looking at individual differences.
With the foregoing accepted, the question is whether there is a natural affinity for the mind-sets established in an experiment to distribute in the way to which we have been accustomed. That is, for our study we have established two mind-sets, those who want preparation, and those who are sensitive to their surroundings, etc.
Table 7 shows that there is no clear relation between mind-set membership and either gender or age. This is typically the case. Mind-sets emerge quite clearly in Mind Genomics studies, but these mind-sets do not distribute in ways that are easy to discern, despite the radical differences in content between or among the mind-sets.
Table 7. Distribution of the two mind-sets by gender and age, respectively.
|
Want preparation |
Sensitive to surroundings |
Total |
|
|
Male |
9 |
10 |
19 |
|
Female |
10 |
13 |
23 |
|
Total |
19 |
23 |
42 |
|
Mind-Set |
Mind-Set 2 |
Total |
|
|
30 and under |
8 |
6 |
14 |
|
31 and Older |
10 |
16 |
26 |
|
No age given |
NA |
NA |
2 |
|
Total |
18 |
22 |
42 |
Given the clear similarity in the patterns of WHO are in the two mind-sets, at least in terms of gender and age, how then do we assign a new person to a mind-set? This is an important question, both for science, and for commerce. For science, we can begin to study the relation between membership in a mind-set for one topic, and both membership in other mind-sets for other topics, and/or external behaviors, and even biological/genetic covariates of membership in different mind-sets.
Our approach uses the average coefficients from each mind-set. We create 1, 000 different variations of the average profile by adding ‘noise’ to the coefficients. We then identify the six questions which, in the presence of “noise” can be used to correctly assign the respondents to the correct mind-set. Figure 5 shows an example of the PVI (personal viewpoint identifier), presenting the six strongest questions which, in concert, help us assign a person to the correct mind-set. We also show the feedback page, which can go to the person being typed, or be used to drive the respondent to the right e-commerce website, or perhaps incorporated into the person’s profile for future use. As of this writing (March, 2019), the PVI is located at this location: http://162.243.165.37:3838/TT19/
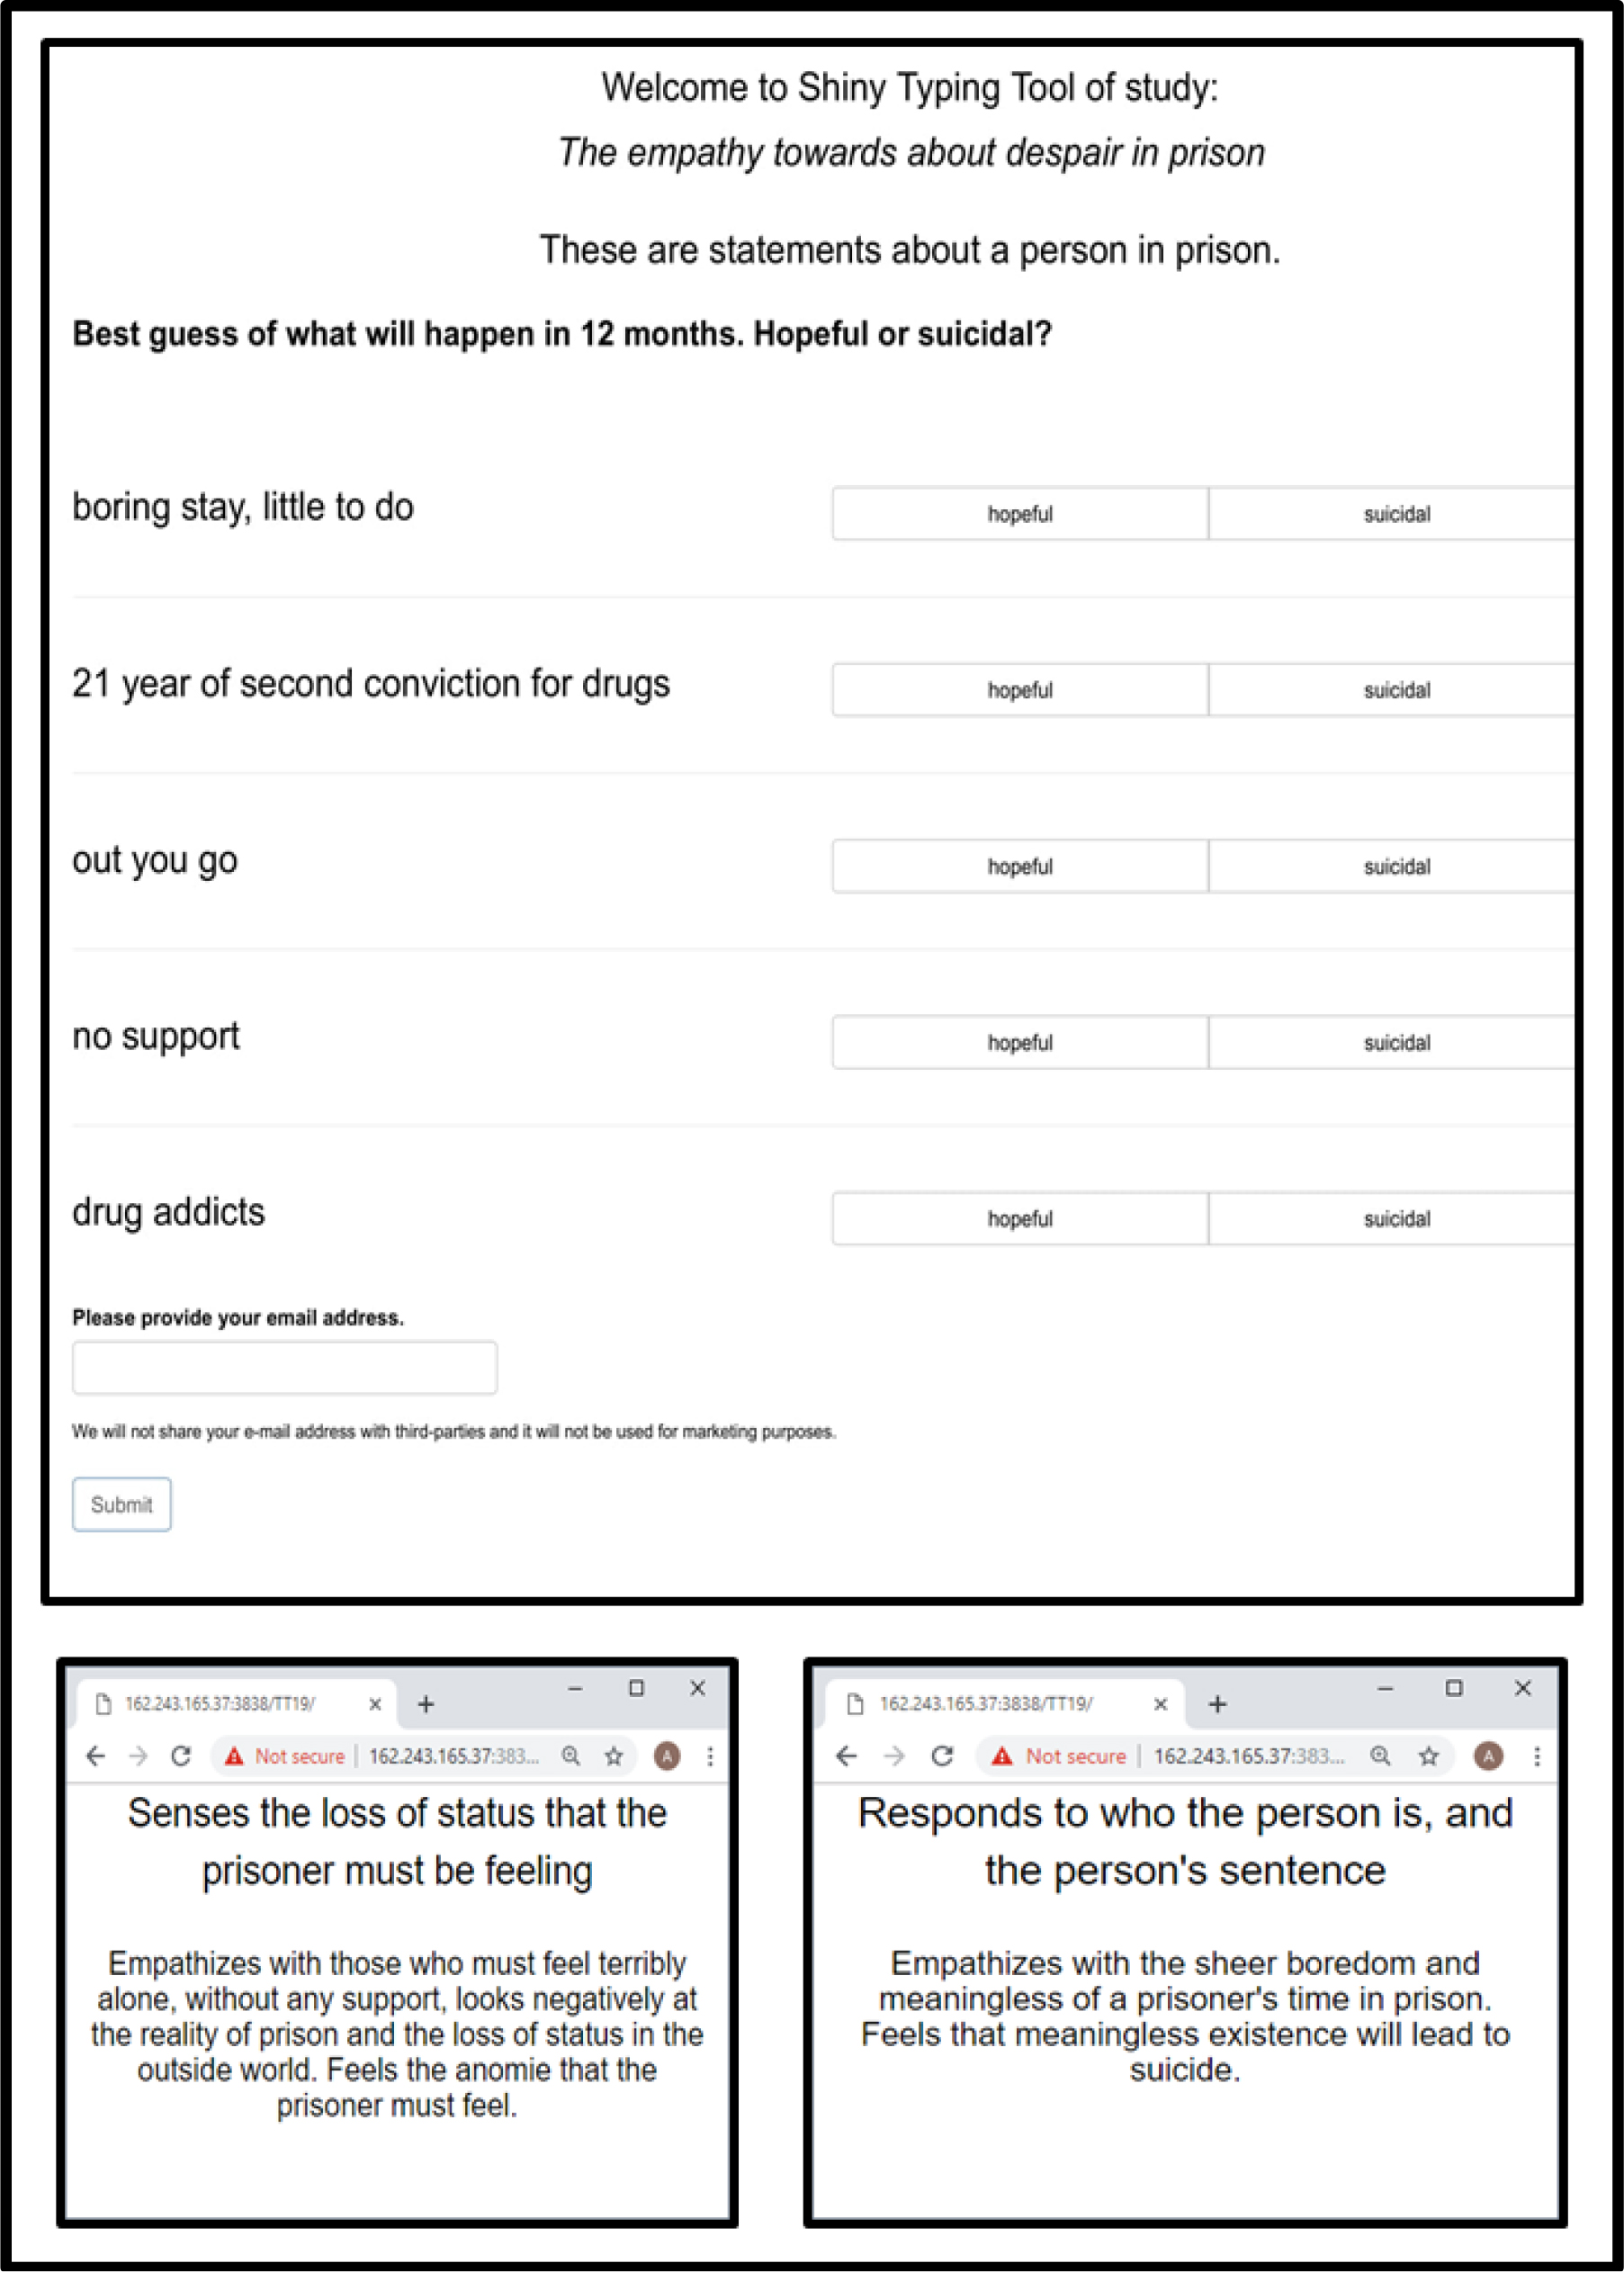
Figure 5. The PVI (personal viewpoint identifier) and the two feedback pages, one for each mind-set segment uncovered in the original study.
Discussion and Conclusion
The sociology and psychology literatures are replete with studies presenting statistics about the backgrounds of prisoners, their environment, and clinical analyses of personalities. There is no end to the fascination with other people, especially those who commit crime. What is lacking, however, is a sense of how the ‘other’ reacts to prisoners. We are aware of the prisoner, but what do we think of prisoners in terms of specifics? The answer may be found in novels, in news clippings, in common discussion, but not particularly in the scientific literature.
Mind Genomics provides a way of understanding how people perceive the ‘other, ’ not so much in a clinical sense, but the ‘other’ when represented in a story, that story provided by the vignette. Mind Genomics opens new vistas, probing into the mind, and how the mind reacts to others, the ‘others’ presented in meaningful but manageable descriptions. Simple experiments, of the type presented here, generate the foundations of new knowledge that that hitherto could only be obtained in unstructured form by talking with people, or by reading personal accounts, news commentary, or literature.
Acknowledgement
Attila Gere thanks the support of Premium Postdoctoral Research Program of the Hungarian Academy of Sciences.
The authors wish to thank Dr. Gillie Gabay for her help in formulating the problem and placing it into its academic perspective.
References
- Liebling, A, Maruna, S (2005) The Effects of Imprisonment, Devon: Willan.
- Chamberlen, A (2016) Embodying prison pain: Women’s experiences of self-injury in prison and the emotions of punishment. Theoretical Criminology 20: 205–219.
- Crewe B, Warr J, Bennett P, Smith A (2014) The emotional geography of prison life. Theoretical Criminology 18: 56–74.
- Cole Johnson R (1987) Hard Time: Understanding and Reforming the Prison. Pacific Grove, CA, Brooks
- Newton C (1994) Gender theory and prison sociology: Using theories of masculinities to interpret the sociology of prisons for men. The Howard Journal of Criminal Justice 33: 193–202.
- De Viggiani N (2012) Trying to be something you are not: Masculine Performances within a prison setting. Men and Masculinities 15: 271–291
- Jewkes Y (2012) Autoethnography and emotion as intellectual resources: doing prison research differently, Qualitative Inquiry, 18: 63–75.
- Robinson L, Spencer MD, Thomson LD, Sprengelmeyer R, Owens DG, et al (2012) Facial emotion recognition in Scottish prisoners. International journal of law and psychiatry 35: 57–61.
- Moskowitz HR (2012) ‘Mind genomics’: The experimental, inductive science of the ordinary, and its application to aspects of food and feeding. Physiology & behavior 107: 606–613.
- Moskowitz HR, Gofman A, Beckley J and Ashman H (2006) Founding a new science: Mind genomics. Journal of sensory studies 21: 266–307.
- Box GEP, Hunter WP, and Hunter JS (1978) Statistics for experimenters, New York, John Wiley.
- Gofman A, Moskowitz H (2010) Isomorphic permuted experimental designs and their application in conjoint analysis. Journal of Sensory Studies 25: 127–145.
- De Hoon MJ, Imoto S, Nolan J, Miyano S (2004) Open source clustering software. Bioinformatics 20: 1453–1454.
- Fugate DL (2007) Neuromarketing: a layman’s look at neuroscience and its potential application to marketing practice. Journal of Consumer Marketing 24: 385–394.
- Lee N, Broderick AJ, Chamberlain L (2007) What is ‘neuromarketing’? A discussion and agenda for future research. International journal of psychophysiology 63: 199–204.
- Stipp H (2015) The Evolution of Neuromarketing Research: From Novelty to Mainstream: How Neuro Research Tools Improve Our Knowledge about Advertising. Journal of Advertising Research 55: 120–122.
- Genco SJ, Pohlmann AP, Steidl P (2013) Neuromarketing for dummies. John Wiley & Sons.