Abstract
16 messages (elements) about the rising prices of gasoline and its effects on the economy and on consumer behavior were created by a school age researcher, using Idea Coach, an artificial intelligence program embedded in the Mind Genomics system. The elements were combined into vignettes, with each respondent evaluated 24 unique vignettes. Regression analysis and clustering revealed two clearly different mind-sets in the population of 101 respondents, about half responding strongly to messages about the macroeconomic causes and effects, and the other responding strongly to messages about consumer reactions. The coupling of artificial intelligence to help students select ideas and Mind Genomics to test these ideas with real people provide the communities with a new way to understand the mind of young people regarding the ‘real world’, as well as a novel tool to encourage learning and education through the experience of one’s own research.
Introduction
At the time of this writing, February 2023, gasoline prices have increased dramatically since the election of President Joseph Biden. It is almost impossible to avoid hearing about the increasing and then oscillating price of energy, and at the same time the cacophony surrounding the introduction of electric cars as a savior of the environment. The combination of economics and environment creates a perfect storm, one where the two aspects, economics and environment, are at odds with each other.
The popular press as well as the academic press are filled with learned disquisitions on the economics of energy and policy, along with the plaints of the ordinary citizen in the street, frustrated, befuddled, often frightened. Almost all of the discourse is run by adults, with adults. Young people hear about the energy issues, but not being drivers themselves, they can only see the responses of adults who are juggling their own daily lives as a consequence of the energy issue, and especially the gasoline prices. It is a rare family whose adult driver does not, at the time of filling up the tank, note and remark, however short, on the price of gas (Gillingham, 2014; Geotzke & Vance, 2021).
With the foregoing in mind, we turn now to how younger people, school-age students, respond to this issue of today’s energy pricing. The previous papers in this series use the emerging science of Mind Genomics to understand how young people can explore a serious topic, using a student-oriented, and student-friendly application, www.BimiLeap.com (Mendoza et al., a, b, c). Rather than simply ignoring young people, or asking them questions about energy through the lens of an adult, the young people being the respondent, the ongoing project in Mind Genomics is to understand how young people of school age understand a topic by becoming researchers, and investigating that topic. The approach is different from the conventional methods of studying children because we let the students ask the questions, select relevant answers, and then let the students test out the answers with real people. The process teaches about the topic, the student’s conception of the topic, and the response of the adult word to the topic.
The Mind Genomics Approach to Answering Questions
Mind Genomics is an emerging science about the way people make decisions about the granular aspects of their lives. Rather than dealing with issues from the way an academic or a policy professional might do, with various arguments, counterarguments, suppositions and facts, Mind Genomics works at the level of the daily, the ordinary. The test stimuli are statements about an issue, statements created in a systematic manner ahead of the experiment, and then tested in vignettes. These vignettes are combinations of statements. Thus, the respondent, the person who is taking part as a test subject ends up seeing combinations of messages about a topic, reading this combination, and rating the combination on a scale. The analysis determines which of the messages or elements drive the respondent to make a judgment.
The actual process will be presented below in an example created by the senior author, Cledwin Mendoza. The uniqueness of the process is that it is the student, not the professional, who determines the structure of the study. It will be regular people, individuals ages xx-58, who will respond to the test stimuli, the vignettes, but it will be the student who chooses the types of elements to put into the vignette. One of the happy consequences of this approach is a new way to understand how people think about problems, about what issues they choose to explore.
The steps in Mind Genomics are summarized in Figures 1 and 2. Figure 1 shows the sequence of screens in the Mind Genomics ‘app’, available on the web (www.BimiLeap.com). Table 1 provides the information in text form.

Figure 1: The six steps in the set-up process for a Mind Genomics study using www.BimiLeap.com.
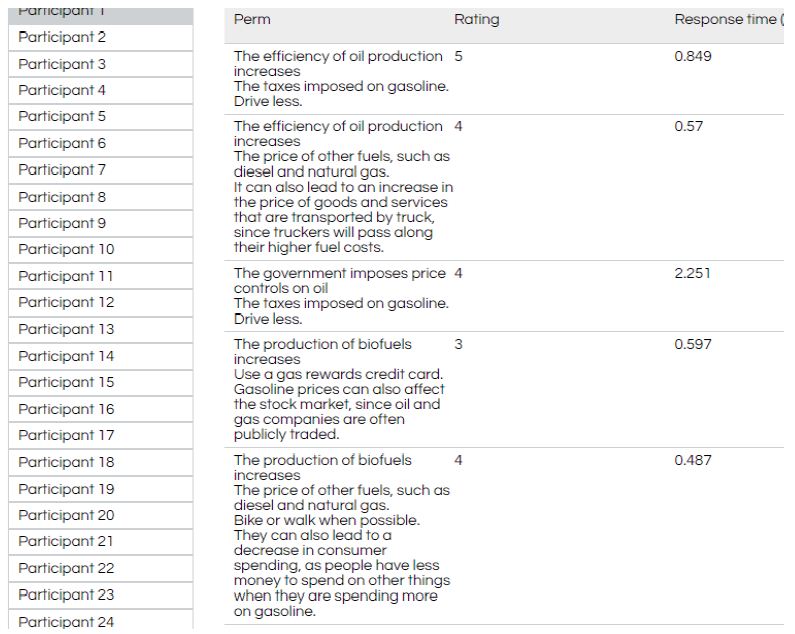
Figure 2: Five vignettes evaluated by Participant #1. The figure shows the participant, the text, the rating, and the response time in seconds.
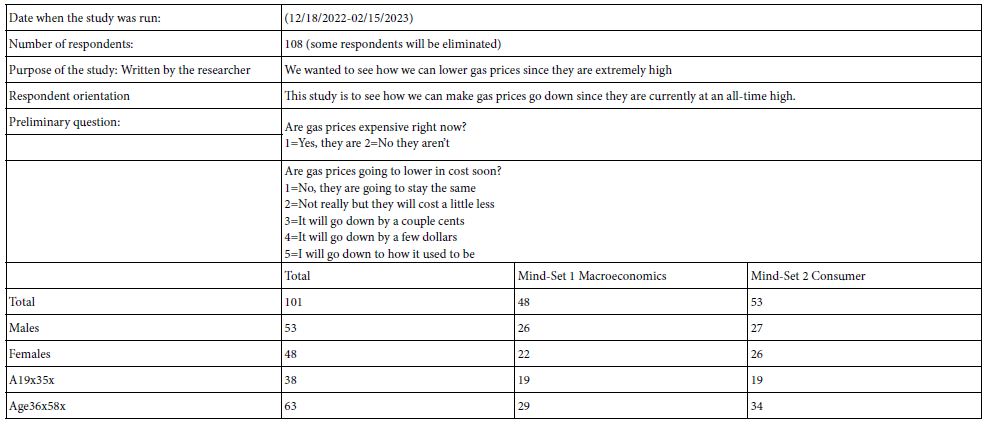
Table 1: Study information
Screen A – Select a topic.
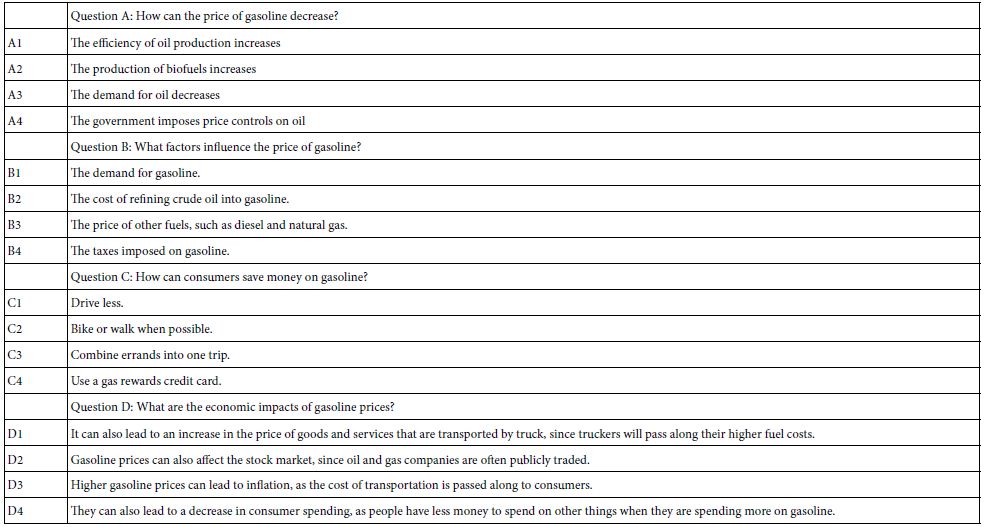
Screen B – Create four questions. The researcher supplies four questions which ‘tell a story’. It is as this point that artificial intelligence in the form of ‘Idea Coach’ will be used to augment the process (see below).
Screen C – For each question create four answers. The combinations of these answers will become the test stimuli, read and rated by the respondent (see Figure 2 for an example of different combinations).
Screen D – The researcher can instruct the respondent to answer up to ten additional questions, called self-profiling questions. Each question has from two to eight answers. The respondent selects only one answer from the set. Two self-profiling classifications are mandatory in each study, gender and age, respectively. The two Gender and age questions are automatically ‘built in’ to the BimiLeap program.
Screen E – The researcher provides a short introduction to the respondent, telling the respondent about the study. It is good research practice to provide the respondent with just enough information about the topic to make the test combinations (vignettes) meaningful. For well-known situations such as the price of gasoline dealt with in this study objective is to learn as much as possible from the reaction of respondents to the specific elements. In other situations, such as a legal case, it might be important to create a much deeper background, and so the orientation would be more detailed.
Screen F – The rating question, the scale, and when desired, anchor points on the scale.
Figure 2 shows examples of the type of test stimuli that the respondent evaluates (middle panel, combinations of test estimates), and then both the rating on a 5-point scale, and the response time, defined as the number of seconds to the nearest thousandth of a second elapsing between the time the vignette appeared on the screen and the time that the respondent assigned a rating.
As Figure 1 shows, the actual steps that the researcher takes, from start to finish, have been put into an easy-to-use template. When Mind Genomics was first introduced in the 1980’s, a key issue to emerge was to create the raw materials, the elements, or the answers. These would be combined into vignettes, in the manner shown in Figure 2. The effort involved in designing the original Mind Genomics projects was so great, the focus so strong on the design and the analysis, that the creation of the elements themselves was seen as the most relaxing, enjoyable part of the study. The elements would be created leisurely, often after two or three focus groups or in-depth interviews in which a skilled interviewer could ‘tease out’ key aspects and language of a topic to be used in the Mind Genomics project. The analysis in those days, four decades ago, might take a day or two.
The creation of a DIY (do it yourself) system for Mind Genomics, during the 1990’s, ended up revealing the need for researchers to think more quickly, and more globally. Rather than the leisurely pace of the 1980’s and the decades before, research was speeded up. The analysis could be speeded up, and made automatic, as it has been for today’s Mind Genomics program, the program embedded in www.BimiLeap.com. The speed revealed one major problem pointed out dozens of times to author HRM over the decades, the problem of ‘where do we get elements to test?’ Unrealized for all the years before was the fact that the Mind Genomics studies were ‘testing’ the response to information already known. In these traditional, slow, now-seemingly-arduous studies, thinking quickly about the content being tested was not critical. Research was slow, and by the time the research process began those who commissioned the research project pretty well ‘knew’ the topic, experiencing no problem in developing the test elements.
As the Mind Genomics process streamlined, both with DIY and with better Internet panel providers, it became obvious that one could do a study in about 1-2 hours, from start to finish. The key problem was how to find the elements to incorporate into the study. The computer could accelerate the process, but not creative thinking. It was at this point, in the of 2022 that the effort was made to create a system using AI, in which AI would be automatically prompted through a short paragraph about the topic, the result of that prompting being 30 questions to ask. Furthermore, with the same technology, the effort would be made even easier by using same the AI to supply up to 15 answers to any question. The development of the Idea Coach was the realization of this approach, a system which provided the researchers 30 questions for each short paragraph describing the topic/problem, and a system which provider the researcher with 15 answers for each question, doing so each time, and providing different answers.
Three decades of experience with Mind Genomics have allowed the streamlining of the process, along with the inclusion of aids to the researcher, such as Idea Coach, which provide suggestions for the study, using artificial intelligence. Experience with Idea Coach since its introduction in the Fall of 2022 showed that its primary values were both to help the project along, and for some researchers, a way to understand the topic using their natural curiosity with the Idea Coach helping teach by the Socratic method, question and answer, question and answer.
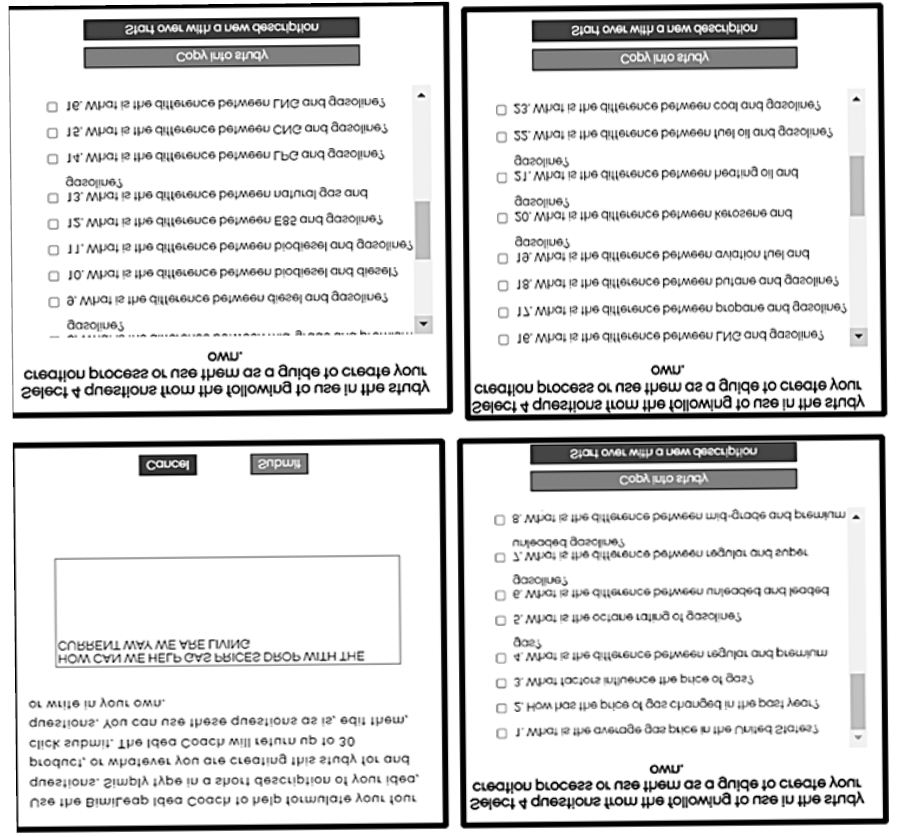
Figure 3a shows (top left panel) shows a screen shot of Idea Coach preparing the researcher to develop the four questions. The panel simply requests that the researcher write about the topic. Experience with Idea Coach continues to suggest that researchers can formulate good descriptions of their project, even at the start of the project, and with no experience, either in using the BimiLeap program, or even in thinking about the topic in any structured fashion. As the researcher becomes increasingly experience either in the topic or in BimiLeap, often the researcher opts to skip the Idea Coach entirely for the formulation of questions, having developed sufficient self-confidence to create the questions without any aid. This latter state, a researcher with confidence and no need for Idea Coach, happens with regularity, and the Idea Coach ends up being perceived as an unnecessary step.
Once the four questions have been formulated and put into the template, the researcher can again use Idea Coach to create answers. For each query with a single question Idea Coach returns with up 10-15 ‘answers’ based upon that question, as well as a place to put in one’s own answer. Figure 4 shows the first page of three separate queries to the question ‘How can the price of gasoline decrease?’ Once again the query can be made again and again for each of the four selected questions in the BimiLeap template, providing both a way to help the research progress the study, as well as a simple way to teach, using the Socratic method.
Figure 3a: Idea Coach questions formulated from a topic statement.
The remaining three panels show different questions emerging from the first ‘query’ of Idea Coach, based on the text in the set-up box. Typically, Idea Coach generates 10-30 questions for each query submitted. The research can become educated in questions by repeating the query several times, getting a variety of new answers, or changing the query and resubmitting the request to Idea Coach. In other words, the researcher’s ‘education’ in the topic can begin with Idea Coach, and remain there for a while as the researcher explores the topic from the vantage point of questions that can be asked about the topic, the topic itself modified each time to explore nuances.
The actual process of a Mind Genomics study follows a set of steps designed to reveal the mind of the respondent. The next section of this paper presents the approach, illustrated by the case history of studying responses to reducing gasoline prices (Figure 3b).
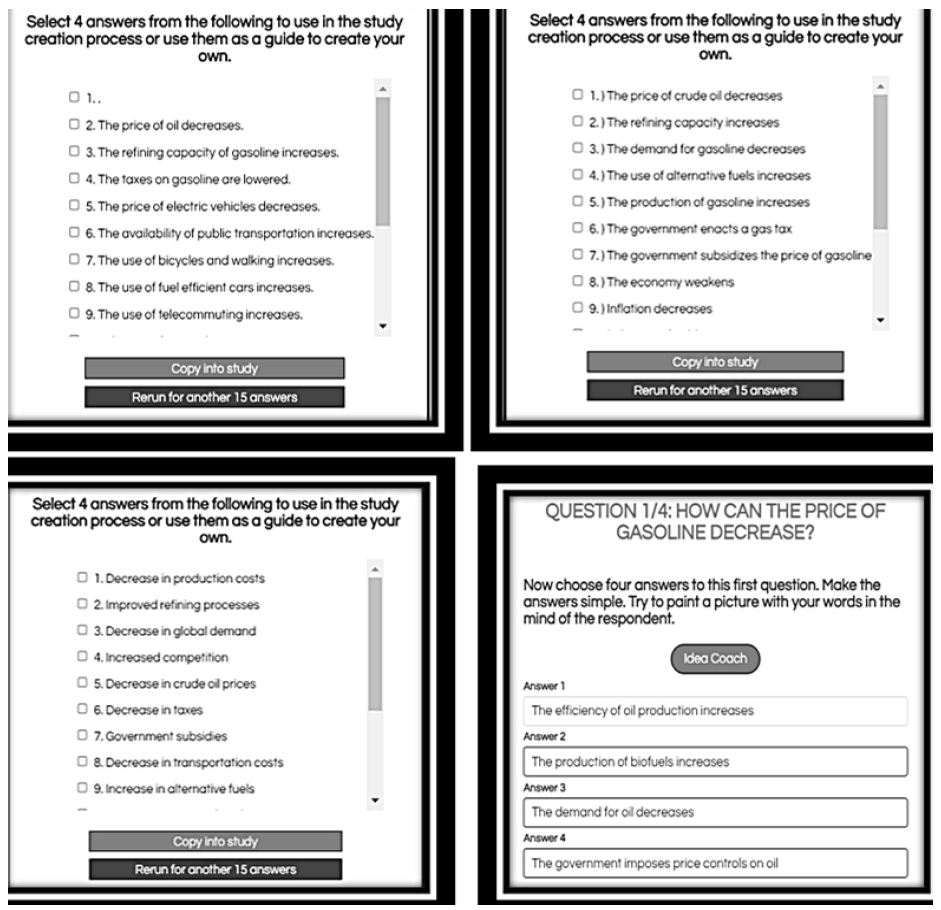
Figure 3b: Idea Coach answers formulated from a single question. The figure shows three sets of answers (1-8), for Question #1.
Step 1: Develop the Study Topic, Create Four Questions, and Create Four Answers to Each Question
The entire study was set up by the senior author, a student going into middle school. The researcher had previously set up six studies and was familiar with the process. No effort was made to change the language, to explore the feasibility of having a young researcher with little life-experience create the entire study, front to back Table 2 presents the questions emerging from the Idea Coach, and the answers to each question chosen by the researcher.
Table 2: The four questions and the four answers to each question
Step 2: Create the Orientation Phrasing and the Rating Scale
Table 1 shows the actual language used. As noted above, the orientation phrasing is minimal, although it need not be. Furthermore, in this study each of the five rating scale points was labelled, although the only labelling that is really required is the labelling of the anchors, rating scale value 5 and rating scale value 1.
Step 3: Create the self-profiling classification questionnaire, if desired, also shown in Table 1.
Step 4: Create 24 Vignettes, Using Experimental Design, to Specify the Combinations
Experimental design ensures that each of the elements in the study appears equally often, and that each of the 16 elements is statistically independent of the other 15 elements. The experimental design here ends up producing vignettes comprising 2, 3, or 4 elements, with at most one element or answer from a question, but often no answer from a specific question. Each element ends up appearing five times in 24 vignettes, absent 19 times. Each question contributes exactly 20 answers, appearing in 20 vignettes, and is absent from 4 vignettes. Finally, each respondent evaluates a unique set of 24 vignettes, most or all vignettes different from the vignettes evaluated by the other respondents, for base sizes of 200 respondents or fewer. This method of testing different vignettes for each respondent ensures that the research covers a great deal of the possible ‘design space’, allowing the research to be exploratory rather than confirmational. The approach is called permuted designs (Gofman & Moskowitz, 2010). Figure 2 shows an example of these vignettes for a respondent.
Step 5: Execute the Study on the Internet
For this study, the respondents were provided by Luc.id, Inc., to be between the ages of 19-60. Luc.id, Inc. is an aggregator of on-line panelists, working all over the world. Using the API or interface provided in the BimiLeap program, the researcher can specify a number of different self-profiling demographic features that the respondent should possess. The requirement for this study was that it be done in the United States, among the general population ages 18-60. The BimiLeap program works efficiently with the inputs to create the test stimuli at the site of the respondent’s computer to minimize communication issues, presents the stimuli one at a time, acquire the rating, and measure the response time defined as the number seconds to the nearest thousandth of a second between the time the stimulus vignette was presented and the time the respondent assigned rating.
Step 6: Acquire the Data, Create a Database to Prepare for Statistical Analysis
The BimiLeap program creates the database on a record-by-record basis. Each record comprises the same type of information, specifically the name of the study, the respondent ‘ID’ number (assigned by the program in order of completion), the self-profiling information (gender, age, response to the self-profiling question created by the researcher). All of the pieces of information remain the same for the 24 rows of data. The remaining columns comprise the order of testing (01-24), 16 columns coding the elements, one column per element (‘1’ when element is present in the vignette, ‘0’ when element is absent from the vignette), one column for the actual rating, one column for the response time (truncated to 0-9 seconds, two decimal places). Finally, the program creates two new binary variables, TOP2 (rating 5-4 → 100, rating 1-3 → 0), and BOT2 (rating of 1-2 → 100; rating 3-5 → 0). To the transformed binary variables, TOP2 and BOT2, a vanishingly small random number is added (<10-4), in order to ensure some minimal variation in these two variables, which will become the dependent variables in regression analysis.
Step 7: Create Models (Equations) Relating the Presence/Absence of Elements to the Newly Created Variable R54 (R4 =It will go Down by a Few Dollars, R5 =It will go Down to How it Used to be)
The equation is straightforward to estimate, either at the level of the individual respondent, or at the level of the self-defined subgroup (e.g., gender, age). The equation is written as: R54 = k1(A1) + k2(B2) … k16(D4). The equation lacks an additive constant. In earlier studies, the equation was estimated with an additive constant. It makes minor difference whether the additive constant is estimated or not estimated, if one is consistent. The coefficients (A1 – A16) highly correlate with each other when estimated with versus without each an additive constant (Figure 4).
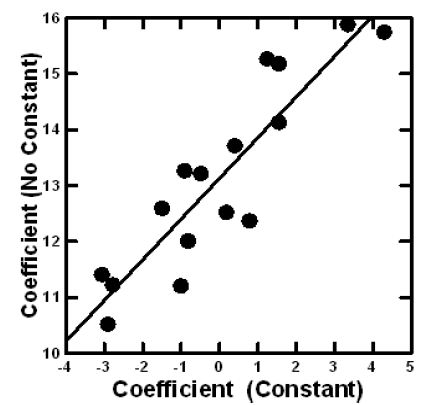
Figure 4: Scatterplot showing the coefficients for R54 estimated with an additive constant versus without an additive constant. Each point corresponds to one of the 16 elements.
Step 8: Estimate the Models for the Self-defined Subgroups
These subgroups are self-defined by gender, and age, respectively. Table 3 shows the statistically significant elements, operationally defined here as a coefficient of 11 or higher. Strong performing elements are operationally defined here as a coefficient of 20 or higher. Table 4 suggests only a moderate range of significant elements, and no strong performing elements.
Table 3: Coefficients for the Total Panel and key subgroups emerging from the self-profiling of WHO the person is (gender, age).
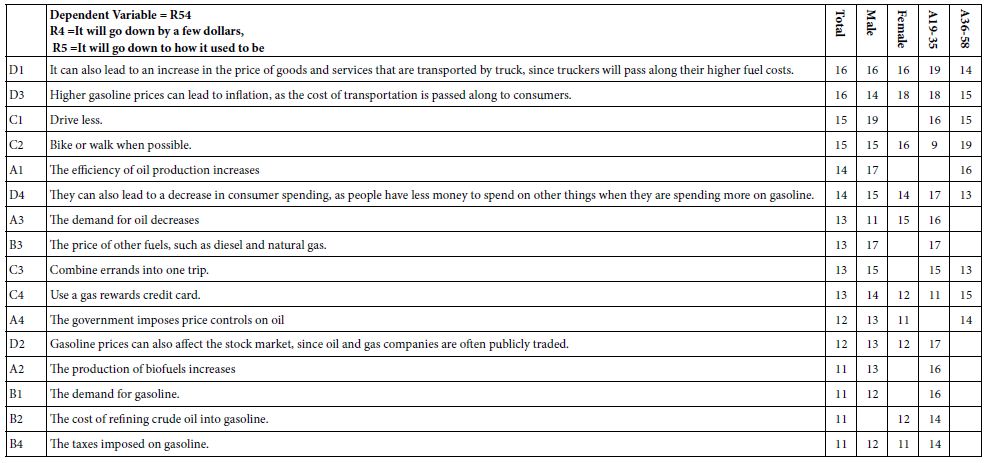
The two strongest performing elements for the Total Panel (D1, D3) paint word pictures in the mind of the respondent:
It can also lead to an increase in the price of goods and services that are transported by truck, since truckers will pass along their higher fuel costs.
Higher gasoline prices can lead to inflation, as the cost of transportation is passed along to consumers.
Only one of the four weakest performing elements paints a word picture.
The production of biofuels increases.
Three pf the four weakest performing elements for the Total Panel are simply ‘factoids.’
The demand for gasoline.
The cost of refining crude oil into gasoline.
The taxes imposed on gasoline.
The key to strong performance is to paint a word picture which is both obvious and convincing.
Step 9: Uncover Mind-sets and Create a Model for Each Mind-set
The hallmark contribution of Mind Genomics is the discovery of mind-sets in the world of the everyday. Researchers have long recognized that people think differently and have used methods such as clustering to divide people into groups or clusters, based upon factors about the people that can be measured, such as demographics. Demographic clustering assumes people who on the surface ‘look like each other’ should probably think like each other. This is not the case, requiring clustering to move more deeply into the way people think. . Often the clustering focuses on the way people define themselves on large-scale topics, such as the way they think about finances, health, and so forth. The studies which create clusters of different ways of thinking end up being large, expensive, and global. By global means, the studies do not easily deal with a simple granular issue. It is left to the ingenuity of the researcher and marketing manager to figure out what to communicate to a person belonging to a specific cluster, regarding local, granular topics (Kadyan et al., 2012).
Mind Genomics works at the local level, looking at the pattern of coefficients generated by different people reacting to the specifics of a topic. For our study here, the reaction of people to the issue of gasoline prices, a sufficiently granular topic, the challenge becomes the task of uncovering clusters in this specific area. The objective is to find different ways of thinking about a simple problem, without worrying about the issue of generalizing the clusters to other topics that may be related.
Mind Genomics creates clusters of like-responding individuals, based upon the use of the well accepted statistical procedure called cluster analysis. These like-responding groups are called ‘mind-sets’ because they show how a person thinks about a specific topic. The mechanics of the approach have been presented in books and papers (Moskowitz et al., 2006; Moskowitz & Gofman, 2007; Porretta et al., 2019). A simple way to think about the discovery of mind-sets to is think about the ingoing data, which is simply a set of 16 coefficients for each respondent. Rather than creating the equation for Total Panel, or for males, or females, simply create the equation for each respondent, which is straightforward because each respondent evaluated the appropriate set of 24 vignettes which ensured that all 16 elements appeared in uncorrelated form.
The actual steps involve creating the 101 individual-level models, measuring the ‘distance’ or dissimilarity between pairs of respondents (Distance = 1 – Pearson Correlation), and then using so-called k-means clustering to divide the respondents into two or perhaps three groups, clusters, called ‘mind-sets’ (Likas et al., 2003). Each cluster comprises individuals who show similar patterns. Each respondent falls into exactly one of two clusters for a two-cluster solution, or one of three clusters for a three-cluster solution, etc. The mathematics of clustering is ‘objective’, based upon minimizing the ‘distances’ within a cluster across the respondents, while maximizing the distance between/among the centroids of the cluster. It is the job of the researcher to determine the number of clusters, and to name them. A good way to approach the task is to opt for as few clusters (viz., mind-sets) as possible (parsimony), while at the same time ensuring that the components of the cluster make sense and tell a story (interpretability).
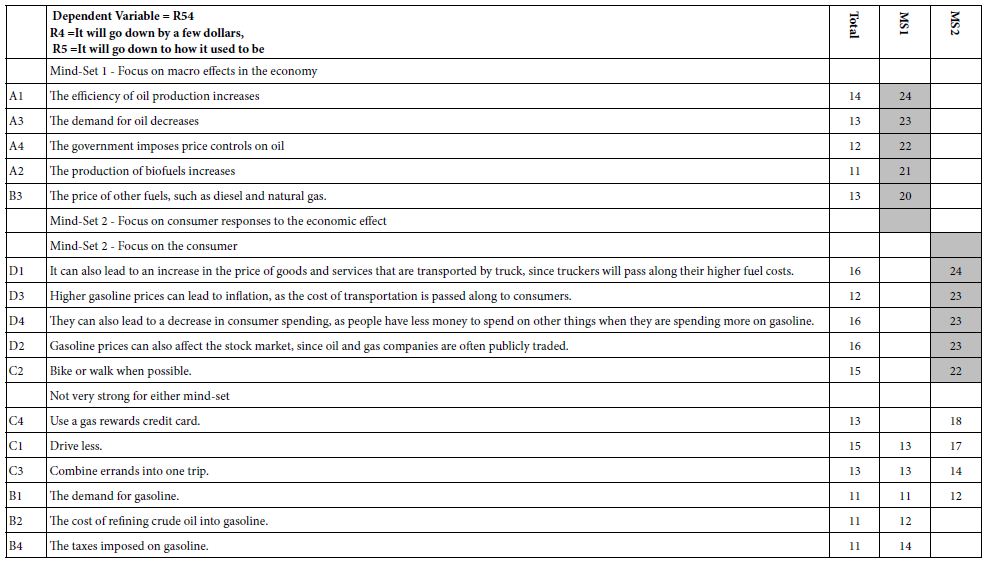
Table 4 shows the emergent solution from clustering, suggesting two mind-sets. There are a fair number of elements in Table 4 which perform very strongly in one or the other mind-set, with ‘strong performance’ operationally defined as a coefficient of 20 or higher. There are no strong performing elements for the Total Panel or for the self-defined subgroups, presumably because the mind-sets end up being attenuated because different mind-sets are ‘fighting each other’ in the Total Panel and in each group, respectively. It is only when the mind-sets are separated, put into different groups, that we see the mind-sets more clearly. In Table 4 the mind-sets are labelled according to the commonalities of the elements which perform strongly.
Table 4: Performance of the 16 elements in the two mind-sets. Only coefficients of 11 or higher are shown
Step 10: Uncover Pairwise Interactions Using Scenario Analysis
Traditionally, researchers interested in communication have stopped at the measurement of how each element by itself contributes to the response. Even the approach thus far using experimental design has and t treated each element as an individual contributor, without considering the effects of combinations of elements. The ‘avoidance’ of searching for pairwise interactions emerges from the reality of traditional research, which uses a fixed set of combinations in the research. One almost has to ‘know’ or at least hypothesize the nature of the pairwise interactions, create these pairwise interactions, and somehow insert them into the test combinations (vignettes). It is possible to do so, but the effort is worthwhile only when there is a compelling reason ahead of time to select certain combinations to test. A good example of this is testing interactions of brand names and features. In the majority of cases there is no reason to create specific combinations to test, in order to reveal pairwise interactions.
Mind Genomics becomes a feasible way to discover pairwise interactions, due to the nature of the underlying experimental design. The aforementioned ‘permuted design’ (Gofman & Moskowitz, 2010) creates many different combinations. Each respondent evaluates a unique set of combinations. In 2007, Moskowitz & Gofman introduced the notion of ‘scenario analysis’ to test for strong interactions between pairs of elements. We use that analysis here because of its simplicity to reveal how one element affects other elements (Moskowitz & Gofman, 2007).
Scenario analysis simply divides the data set into the five ‘strata’ defined by the different elements (or answers) for a single question. Scenario analysis then creates the model for each stratum. The researcher need only look at the coefficients of a specific element across the five strata. The five coefficients show the interaction. In operational terms, the researcher follows these specific sets, all easily done with the raw data available. Table 5 shows the results for the scenario analysis for both mind-sets.
Table 5: Results from the scenario analysis for two mind-sets, and using Question A as the defining variable for the five strata.
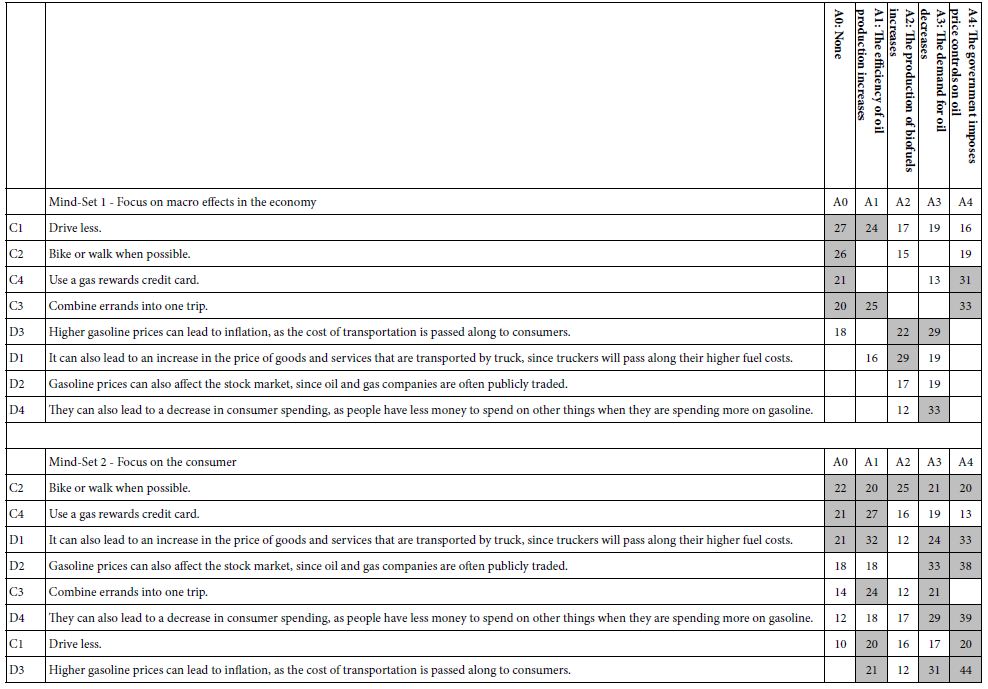
Step a. Identify the question or variable that will define the strata. Here the question is ‘A’, the macroeconomic result of higher gasoline prices. Any of the four questions can become the defining variable for the five strata.
Step b. Sort the database by the five elements corresponding to A0 (question A does not contribute an element), A1, A2, A3 and A4, respectively.
Step c. For each stratum create the equation relating the presence/absence of the 12 elements to the rating. Each stratum has only 12 independent variables (B1-D4) because for the stratum ‘A’ is held constant. The coefficients A1-A4 are not estimated. The equation is expressed as: R54 = k1(B1) + k2(B2) … k12(D4). The nomenclature for the coefficients is kept as before.,
Step d. Although we estimate the coefficients of the remaining 12 elements, Table 5 shows only the coefficients for C1-D4, because elements B1-B4 do not paint a word picture.
Step e. Table 5 shows only coefficients of 11 or higher and highlights the elements of coefficient 20 or higher. There are many elements which score very highly (coefficients of 25 or higher) when their contributions to vignettes are evaluated in the proper mind-set, and in the proper stratum. Consider, for example, D4: They can also lead to a decrease in consumer spending, as people have less money to spend on other things when they are spending more on gasoline. For the total panel the coefficient is +14, and across age and gender, the coefficient ranges from a low of 13 to a high of 17. Consider the performance of this element in Mind-Set 2 (focus on the consumer), pair the element with A4 (The government imposes price controls on oil) and the coefficient for more than doubles, to 39. Yet, as Table 5 shows, it is only with specific combinations that we see this synergy emerging.
The importance of scenario analysis is its ability to identify synergisms without having the researcher even suspect that they exist. The researcher need not know anything about the topic, and yet discover these synergisms. As a consequence, the exploratory value of Mind Genomics moves from studying messages to studying how the person processes these messages. One might imagine future studies with the elements more carefully crafted, in order to understand how the tonalities of pairs of elements interact with each other, e.g. the combination of two positive tonalities, two negative tonalities, or one positive tonality and one negative tonality.
Step 11: Estimate Response Time for Each Element
Researchers are always interested in potential processes for decision making which are not under the conscious control of the respondent. There is the assumption that ‘somehow’ there is a deeper reality when the metric is not a verbal one. To this end, the study of response time has a long history in psychology (Silverman, 2010). The assumption is that long response times show an underlying, presumably non-verbal aspect of decision making, such as the below-conscious effort to be correct, to please the researcher. Indeed, there is a growing school of researchers who look at response times to understand the ‘underlying truth’ of a response (Bassili, & Fletcher, 1991).
In the spirit of exploration, we close this paper with an analysis of response times attributable to each element, for the total panel, mind-sets, self-defined classificaiton (gender, age), and order of testing. We have not looked at the order of testing in this paper, but a continuing observation is that people get faster at making decisions as they practice the task. With 24 vignettes one has 24 clearly defined practice sessions, so the analysis can be on the response time as a function of order of task.
The response times are estimated in the same way that the coefficients were estimated for the dependent variable, R54. The BimiLeap program records the time when the vignette appeared on the respondent’s screen, and the time when the respondent assigned a rating. The elapsed time was defined as the response time. Response times greater than 9 seconds were truncated to 9. Figure 5 shows the distribution of response times for each of the responses (R1 – R5), as well as for Total Panel.
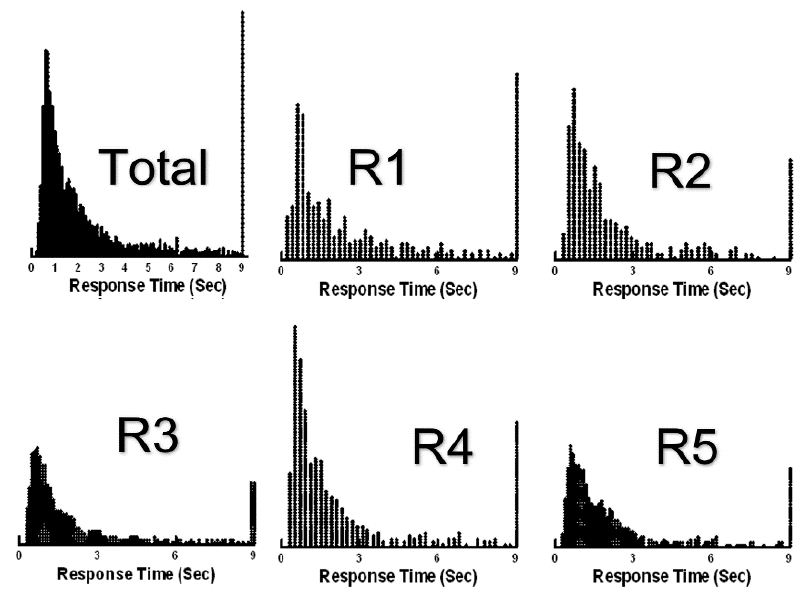
Figure 5: Distribution of response times by total panel, and by the rating assigned to the vignette
It is clear from Figure 5 that except for these morphological differences among the distributions, there is little to glean from the plot of the response distribution. It is only when we deconstruct the response time to a vignette into the component response times that we see patterns. The equation is the same as above. Only the dependent variable changes from the transformed binary variable R54 to the response time, viz. RT = k1(A1) + k2(A2) … k16(D4).
Table 6 shows the estimated response times for the 16 elements by Total, mind-set, gender, age, and order of testing (first 12 vs. last 12 vignettes). The first row shows the average response time across the 16 elements. The average response time changes by group. The interesting comparisons are by age (younger respondents, 19-35 years old respondent much more quickly than do older responses, 36-58 years old), and by order of testing (the same element is responded to more slowly when it appears in the first half of the evaluations, and respondent to more quickly when it appears in the second half of the evaluations).
Table 6: Response times of elements by Total Panel and key subgroups
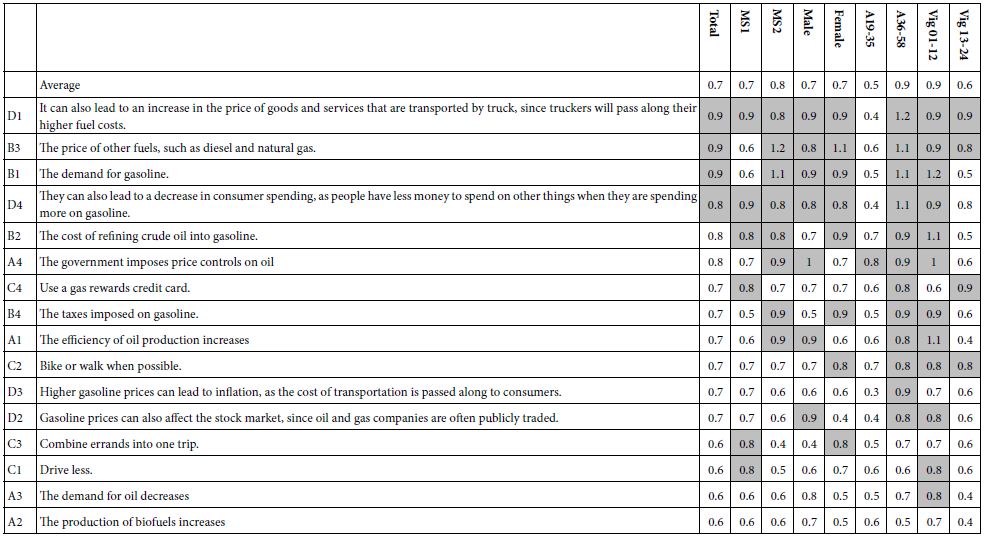
Two other patterns should be noted:
Long elements with explanations generate longer response times, perhaps because they must be reasoned through.
D1 It can also lead to an increase in the price of goods and services that are transported by truck, since truckers will pass along their higher fuel costs.
D4 They can also lead to a decrease in consumer spending, as people have less money to spend on other things when they are spending more on gasoline.
Elements which paint a common word picture generate longer response times, perhaps because they distract the reasoning as the mental picture is formed.
B3 The price of other fuels, such as diesel and natural gas.
B1 The demand for gasoline.
Step 12: Measure Response Time of Interacting Elements
The final analysis looks at the interaction between pairs of elements and response times, again using Scenario Analysis. Table 7 shows the response time to each pair of elements, with the element defined by the column staying constant, but paired, respectively, with each element defined by the row. The table is divided into two parts, the top of the table presenting the estimated response times for Mind-Set 1 (focus on macro effects in the economy), and the bottom of the table presenting the estimated response times for Mind-Set 2 (focus on the consumer response). Despite the differences in the difference in patterns of ratings, generating two mind-sets, the patterns of response times do not show clear patterns (Figure 6). The letters in the plot show the response time from Mind-Set 1 versus the response time for the same element from mind-set 2. Each of three questions (B, C or D) contributes 16 points (e.g., B1, B2, B3, B4), coming from four elements per question, and interacting with A1, A2, A3, or A4, respectively.
Table 7: Scenario analysis for the two mind-sets, with response time as the dependent variable
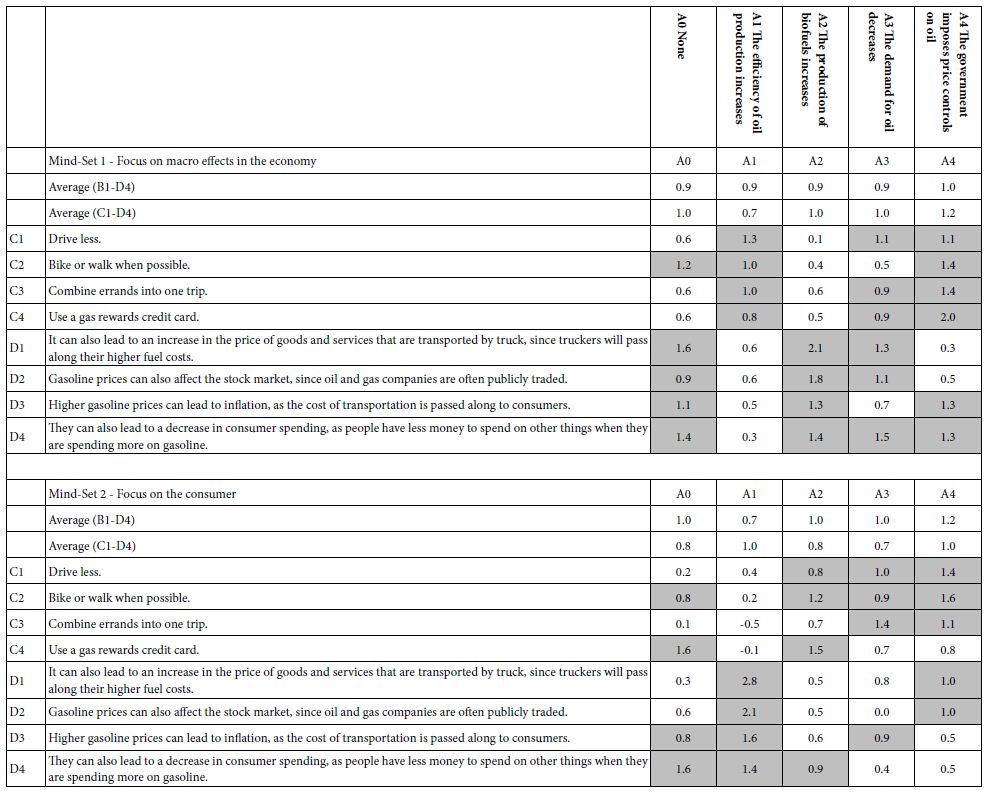
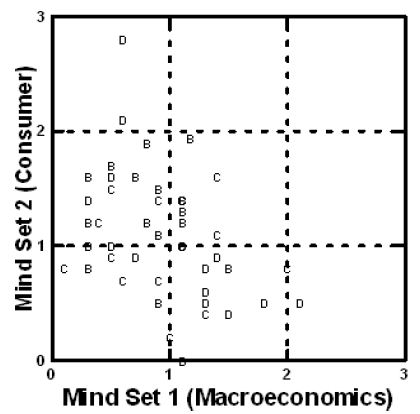
Figure 6: Scatterplot of the coefficients for response time from scenario analysis. The letters in the plot show the response time from Mind-Set 1 versus the response time for the same element from mind-set 2. Each of three questions (B, C or D) contributes 16 points (e.g., B1, B2, B3, B4), coming from four elements per question, and interacting with A1, A2, A3, or A4, respectively.
Discussion and Conclusions
A common theme in Mind Genomics studies with students as researchers is the interest in understanding the world in a new way. The developmental psychologist, Piaget, discussed the necessity of understanding the world through the eyes of a child (Gopnik, 1996). Such understanding produces insights, but cannot be easily transformed to a scalable database with the potential that such a database can teach. At the same time a child is a child, and not an adult. The child thinks in one fashion, with the task of the child psychologist to decipher the child’s thinking in a way which is faithful to the child’s conception of the world, but at the same time reveals patterns that can be compared to the patterns of adult thinking about the same topic.
As noted in the introduction, there is a growing realization that the education of children can be improved by experiencing active involvement in research, or at least in efforts wherein the student has to explore new areas (Gardner, 2011; Hogan & Fisherkeller, 1996; Kerry, 1983).In that spirit, the Mind Genomics project is simply a way to make the process smoother, more fluid, more automatic, ensuring that the effort returns with new to the world knowledge. The present study might be considered either a way to introduce students to problems of society (Hämeen-Anttila et al., 2006; Sonnewald et al., 2001; Swartz, 2020; Walstad & Watts, 2015), or even a way to introduce students to economics, indeed to what might be called experimental economics (Croson, & Gächter, 2010; Guala, 2005)).
When considering the results, it is important to keep in mind that the Mind Genomics approach in the hands of a student is not necessarily going to yield the same results as it does when a seasoned professional does the study. Students are young, inexperienced, and focusing on what they see, hear and read. They do not yet have the ability of the professional, nor of course the life experience. They have not yet even gone to college nor in some cases high school. The result is that their experience with the selection process of elements will differ from the way a seasoned professional selects elements. Rather than focusing on the student becoming the seasoned professional the use of Mind Genomics + Idea Coach allows us to understand way a student thinks about a problem versus the way the seasoned professional or even just an adult thinks about the problem. One can simply imagine what might happen were various groups of individuals to be given this same task, and the nature of the four questions and 16 answers might be, even without doing the actual experiment with respondents.
References
- Bassili JN, Fletcher JF (1991) Response-time measurement in survey research a method for CATI and a new look at nonattitudes. Public Opinion Quarterly 55: 331-346.
- Croson R, Gächter S (2010) The science of experimental economics. Journal of Economic Behavior, Organization 73: 122-131.
- Gardner HE (2011) The Unschooled Mind: How Children Think and How Schools Should Teach. Basic books.
- Gillingham K (2014) Identifying the elasticity of driving: evidence from a gasoline price shock in California. Regional Science and Urban Economics 47: 13-24.
- Goetzke F, Vance C (2021) An increasing gasoline price elasticity in the United States? Energy Economics 95.
- Gofman A, Moskowitz H (2010) Isomorphic permuted experimental designs and their application in conjoint analysis. Journal of Sensory Studies 25: 127-145.
- Gopnik A (1996) The post-Piaget era. Psychological Science 7: 221-225.
- Guala F (2005) The Methodology of Experimental Economics. Cambridge University Press.
- Hämeen-Anttila K, Juvonen M, Ahonen R, Bush PJ, Airaksinen M (2006) How well can children understand medicine related topics? Patient education and counseling 60: 171-178. [crossref]
- Hogan K, Fisherkeller J (1996) Representing students’ thinking about nutrient cycling in ecosystems: Bidimensional coding of a complex topic. Journal of Research in Science Teaching: The Official Journal of the National Association for Research in Science Teaching 33: 941-970.
- Kadyan R, Arora N, Chhabra P (2012) An overview of data mining. International Journal of Scientific and Engineering Research 3: 1-7.
- Kerry T (1983) Developing pupils’ thinking through topic work. Education 3: 13: 11 4-7.
- Likas A, Vlassis N, Verbeek JJ (2003) The global k-means clustering algorithm. Pattern Recognition 36: 451-461.
- Mendoza C, Deitel J, Braun M, Rappaport S, Moskowitz HR. 92023)(a) Empowering young researchers: Exploring and understanding responses to the jobs of home aide for a young child. Pediatric Studies Care3: 1-9.
- Mendoza C, Mendoza C, Deitel Y, Rappaport S, Moskowitz HR (2023)(b) Empowering young people to become Researchers: What does it take to become a police officer? Psychology Journal Research Open 5: 1-12.
- Mendoza C, Mendoza C, Rappaport S, Deitel J, Moskowitz HR (2023)(c) Empowering young researchers to think critically: Exploring reactions to the ‘Inspirational Charge to the Newly-Minted Physician’. Psychology Journal, Research Open 2: 1-9.
- Moskowitz HR, Gofman A (2007) Selling Blue Elephants: How to Make Great Products that People Want Before They Even Know They Want Them. Pearson Education.
- Moskowitz HR, Gofman A, Beckley J, Ashman H (2006) Founding a new science: Mind genomics. Journal of Sensory Studies 21: 266-307.
- Porretta S, Gere A, Radványi D, Moskowitz H (2019) Mind Genomics (Conjoint Analysis): The new concept research in the analysis of consumer behaviour and choice. Trends in Food Science, Technology 84: 29-33.
- Silverman IW (2010) Simple reaction time: It is not what it used to be. The American Journal of Psychology 123: 39-50. [crossref]
- Sonnenwald DH, Wildemuth BS, Harmon GL (2001) A research method to investigate information seeking using the concept of Information Horizons: An example from a study of lower socio-economic students’ information seeking behavior. The New Review of Information Behavior Research 2: 65-86.
- Swartz L (2020) Teaching Tough Topics: How Do I Use Children’s Literature to Build A Deeper Understanding of Social Justice, Equity and Diversity? Pembroke Publishers Limited.
- Walstad WB, Watts M (2015) Perspectives on economics in the school curriculum: Coursework, content, and research. The Journal of Economic Education 46: 324-339.